What Is a Rent Calculator?
A rent calculator is a financial planning tool that determines how much rent you can afford based on your income, expenses, and financial goals — or conversely, what income you need to comfortably afford a specific rental price. It takes the guesswork out of one of the most consequential financial decisions most people make repeatedly throughout their lives: how much to spend on housing.
Rent is typically the largest single line item in a household budget. Get it right and the rest of your financial life has room to breathe. Get it wrong — paying more than your income can comfortably support — and every other financial goal gets compressed: savings stagnate, debt accumulates, and financial stress becomes a constant background condition.
A rent calculator operationalizes the rules of thumb and budgeting frameworks that personal finance experts have refined over decades into a concrete, actionable number. But the best rent calculators go beyond simple ratios — they account for total financial picture, local cost of living, additional housing costs beyond rent, and the full opportunity cost of different rent levels.
The Core Rent Affordability Formulas
Several widely used formulas serve as the foundation of rent calculators. Each takes a different perspective on what “affordable” means, and understanding all of them gives you a more complete picture than any single rule alone.
Formula 1: The 30% Rule
The most widely cited rent affordability guideline is the 30% rule: rent should not exceed 30% of gross monthly income.
Maximum Affordable Rent = Gross Monthly Income × 0.30
Origin: The 30% threshold originated in the U.S. Housing Act of 1969, which defined housing as “affordable” when it consumed no more than 25% of income. This was later revised to 30% in the 1980s. It became the de facto standard used by landlords, property managers, lenders, and financial advisors.
Example:
- Annual gross income: $65,000
- Monthly gross income: $65,000 ÷ 12 = $5,416.67
- Maximum rent (30%): $5,416.67 × 0.30 = $1,625/month
Formula 2: The 50/30/20 Budget Rule Applied to Housing
The 50/30/20 budget framework — popularized by Senator Elizabeth Warren in All Your Worth (2005) — allocates income as follows:
- 50% of after-tax income to needs (including rent)
- 30% to wants
- 20% to savings and debt repayment
Since rent is one of multiple “needs” (also including utilities, groceries, transportation, insurance, and minimum debt payments), a common interpretation targets rent at roughly 25–30% of net (after-tax) income rather than gross.
Maximum Affordable Rent = Net Monthly Income × 0.25 to 0.30
Why net income matters: The 30% rule applied to gross income overestimates affordability for higher earners in high tax brackets. Someone earning $120,000 gross may take home only $80,000 net after federal, state, and FICA taxes. Applying 30% to $10,000 gross monthly income suggests $3,000/month in rent — but that’s 45% of their $6,667 net monthly income, leaving very little for everything else.
Formula 3: The 40× Rule (Landlord Income Requirement)
Most landlords and property management companies use a different formula for qualifying tenants: annual income must be at least 40 times the monthly rent.
Minimum Annual Income Required = Monthly Rent × 40
Or rearranged to find maximum rent from income:
Maximum Rent (40× Rule) = Annual Gross Income ÷ 40
Example:
- Annual gross income: $72,000
- Maximum rent: $72,000 ÷ 40 = $1,800/month
The 40× rule is equivalent to spending approximately 30% of gross income on rent (since 12 monthly payments × 30% of monthly income ≈ 40× monthly rent in annual income terms). It is the landlord’s shorthand version of the 30% rule.
Formula 4: The Residual Income Method
The most financially rigorous approach does not use a percentage at all — it starts from actual monthly expenses and works backward to determine what rent level is sustainable.
Maximum Affordable Rent = Net Monthly Income − All Other Essential Expenses − Savings Goal − Debt Payments − Buffer
Example:
| Income and Expenses | Amount |
|---|---|
| Net Monthly Income | $4,200 |
| Groceries | −$400 |
| Transportation | −$350 |
| Utilities (excl. rent) | −$150 |
| Health Insurance | −$200 |
| Minimum Debt Payments | −$300 |
| Savings Goal (20%) | −$840 |
| Buffer / Discretionary | −$300 |
| Maximum Affordable Rent | $1,660 |
The residual income method is more work to calculate but far more accurate for individuals whose expenses deviate significantly from national averages — whether because of high student loan debt, unusual healthcare costs, car payments, or expensive commuting costs.
Step-by-Step Rent Calculation Examples
Example 1: Single Renter, Entry-Level Income
Profile: Recent graduate, annual salary $42,000 Location: Mid-size city (not New York, San Francisco, or similar high-cost market) Tax situation: Approximately 22% effective tax rate
Gross Monthly Income: $42,000 ÷ 12 = $3,500
Net Monthly Income (after tax ~22%): $3,500 × 0.78 = $2,730

30% Rule (gross): $3,500 × 0.30 = $1,050/month max
40× Rule: $42,000 ÷ 40 = $1,050/month max
25% of Net: $2,730 × 0.25 = $683/month
30% of Net: $2,730 × 0.30 = $819/month
Analysis: The 30% gross rule suggests $1,050/month, but on a net income of $2,730, $1,050 rent represents 38.5% of take-home pay — leaving only $1,680 for everything else: food, transportation, utilities, savings, healthcare, and discretionary spending. In most markets, $1,680 for all remaining expenses is extremely tight.
Practical recommendation: Target $700–$850/month, using the net income approach. Consider roommates to achieve a comfortable rent level at this income.
Example 2: Dual-Income Household
Profile: Couple, combined annual gross income $110,000 ($55,000 each) Situation: Looking for a two-bedroom apartment
Combined Gross Monthly Income: $110,000 ÷ 12 = $9,167
Combined Net Monthly (est. 24% effective rate): $9,167 × 0.76 = $6,967

30% Rule (gross): $9,167 × 0.30 = $2,750/month max
40× Rule: $110,000 ÷ 40 = $2,750/month max
25% of Net: $6,967 × 0.25 = $1,742/month
30% of Net: $6,967 × 0.30 = $2,090/month
Residual income check:
| Expense | Amount |
|---|---|
| Net Monthly Income | $6,967 |
| Groceries (2 people) | −$700 |
| Two cars (payment + insurance + gas) | −$1,100 |
| Utilities | −$200 |
| Health Insurance (employer-sponsored) | −$300 |
| Minimum debt payments | −$500 |
| Combined savings goal (15%) | −$1,045 |
| Discretionary / buffer | −$600 |
| Maximum Affordable Rent | $2,522 |
Result: The couple can comfortably afford between $2,000–$2,500/month, with $2,750 being a stretch that would require reducing the savings rate.
Example 3: High Cost-of-Living Market
Profile: Software engineer, $130,000 annual gross income, relocating to San Francisco Reality: Average one-bedroom apartment in San Francisco: $2,800–$3,500/month (2026 market)
Gross Monthly Income: $130,000 ÷ 12 = $10,833
California Net Monthly (est. 28% effective rate including state tax): $10,833 × 0.72 = $7,800

30% Rule (gross): $10,833 × 0.30 = $3,250/month
40× Rule: $130,000 ÷ 40 = $3,250/month
25% of Net: $7,800 × 0.25 = $1,950/month
30% of Net: $7,800 × 0.30 = $2,340/month
The high-cost market problem: Even at $130,000 gross, the 30% net rule produces $2,340/month — well below the market rate for a one-bedroom. This is the defining housing affordability challenge in high-cost metros: standard affordability formulas produce numbers that are unachievable in the actual rental market.
Options for high-cost market renters:
- Accept a higher rent-to-income ratio (35–40% of net) and reduce other spending
- Add a roommate to split costs (two people each earning $130,000 can comfortably afford a $4,000 two-bedroom)
- Live further from the city center with transit access
- Negotiate remote work to access a lower cost-of-living market while maintaining a higher-market salary
Example 4: Calculating Required Income for a Target Rent
Scenario: An apartment costs $1,950/month. What annual income is needed to afford it comfortably?
Using each formula in reverse:
30% Rule (gross):
Required Monthly Income = $1,950 ÷ 0.30 = $6,500/month
Required Annual Income = $6,500 × 12 = $78,000/year
40× Rule:
Required Annual Income = $1,950 × 40 = $78,000/year
25% of Net Income (assuming ~22% effective tax rate):
Required Net Monthly = $1,950 ÷ 0.25 = $7,800/month
Required Gross Monthly = $7,800 ÷ 0.78 = $10,000/month
Required Annual Gross = $120,000/year
The gap between the gross-income formula ($78,000) and the net-income formula ($120,000) illustrates why using net income produces a more conservative — and more realistic — affordability estimate.
Additional Housing Costs Beyond Rent
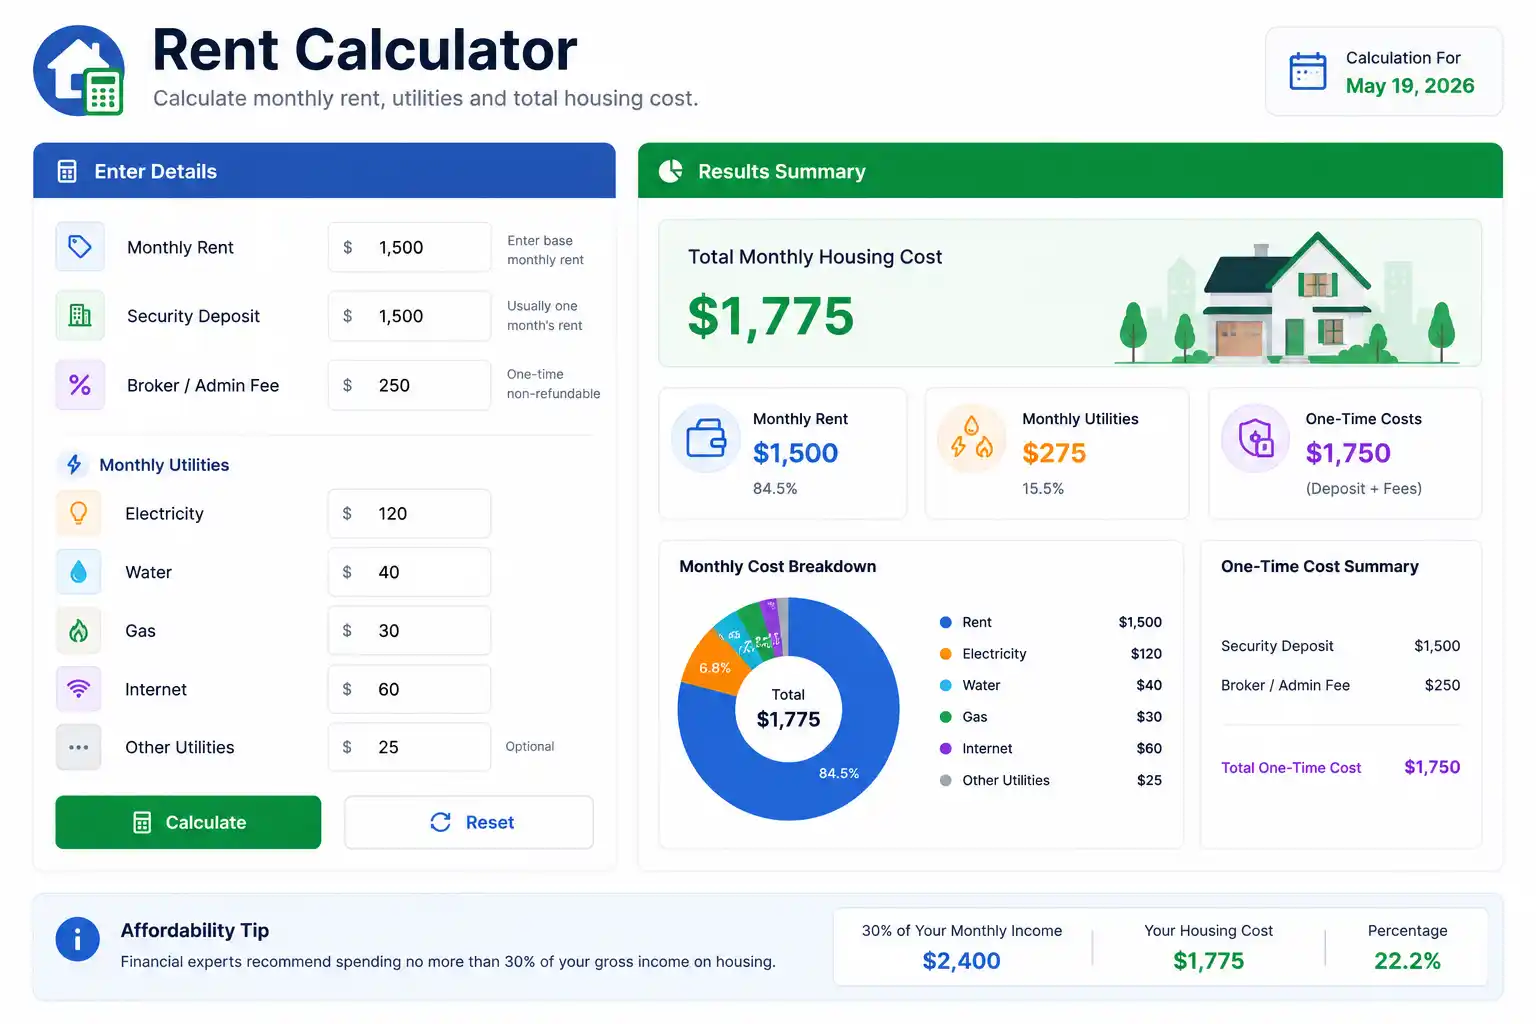
A rent calculator that considers only the monthly rent payment is incomplete. The true cost of renting includes several additional expenses that can add 15–30% to the nominal rent figure.
Utilities
Unless the lease specifies “utilities included,” renters pay separately for electricity, gas, water/sewer, trash, and internet. Average utility costs vary significantly by climate, unit size, and energy efficiency, but national averages provide a useful baseline:
| Utility | Average Monthly Cost |
|---|---|
| Electricity | $100–$180 |
| Gas / Heating | $50–$150 (seasonal) |
| Water / Sewer | $30–$70 |
| Internet | $50–$100 |
| Total Utilities | $230–$500/month |
For a $1,500/month apartment with $350/month in utilities, the true monthly housing cost is $1,850 — 23% higher than the rent alone.
Renters Insurance
Renters insurance protects personal belongings against theft, fire, and certain liability claims. Cost: $15–$30/month for most renters. Many landlords require it. Always include it in housing cost calculations.
Parking
In urban areas, parking is frequently not included in rent. Monthly parking costs range from $50–$400/month in major metros. This is one of the most commonly overlooked housing cost components.
Pet Fees
Renters with pets often face:
- Non-refundable pet fees: $200–$500 per pet (one-time)
- Monthly pet rent: $25–$75/month per pet
- Higher security deposits
Move-In Costs
Moving into a new rental typically requires:
- First month’s rent
- Last month’s rent (in many markets)
- Security deposit (1–2 months’ rent)
- Moving costs ($500–$3,000 depending on distance and volume)
Total move-in cash required for a $1,800/month apartment with standard terms:
First month's rent:    $1,800
Last month's rent:     $1,800
Security deposit:      $1,800
Moving costs:         +$1,500
Total cash needed:    $6,900
A rent calculator that shows only the monthly payment without flagging the move-in cash requirement can leave renters unprepared for one of the largest one-time cash outlays in everyday financial life.
The Rent vs. Buy Calculation
For renters considering homeownership, the rent calculator naturally extends into a rent vs. buy comparison — one of the most consequential and most frequently oversimplified financial decisions.
The Price-to-Rent Ratio
The price-to-rent ratio compares the cost of buying versus renting an equivalent property:
Price-to-Rent Ratio = Home Purchase Price ÷ Annual Rent
Interpretation:
- Ratio below 15: Buying is likely more financially advantageous
- Ratio 15–20: Roughly neutral — other factors (mobility, down payment, market conditions) drive the decision
- Ratio above 20: Renting is likely more financially advantageous
Example:
- Comparable home purchase price: $420,000
- Annual rent for equivalent unit: $24,000 ($2,000/month)
- Price-to-rent ratio: $420,000 ÷ $24,000 = 17.5
At 17.5, the decision is close enough that non-financial factors — career mobility, local market trends, personal preference — should weigh heavily.
The True Cost of Buying (for comparison)
A complete rent vs. buy comparison adds ownership costs beyond the mortgage:
| Ownership Cost | Annual Estimate |
|---|---|
| Mortgage payment (P&I) | $24,000 |
| Property taxes (1.2%) | $5,040 |
| Homeowners insurance | $1,500 |
| HOA fees (if applicable) | $2,400 |
| Maintenance (1% of value) | $4,200 |
| Total Annual Cost | $37,140 |
vs. renting the equivalent for $24,000/year — a $13,140 annual premium for ownership, before accounting for equity building, tax deductions (where applicable), and appreciation.
Rent-to-Income Ratios by City
The 30% affordability rule applies nationally, but its feasibility varies dramatically by market. The following table illustrates the income required to afford a median one-bedroom apartment in selected U.S. cities at the 30% gross income threshold:
| City | Median 1BR Rent | Income Required (30% Rule) | Annual Income Required |
|---|---|---|---|
| New York, NY | $3,500 | $11,667/month | $140,000 |
| San Francisco, CA | $3,200 | $10,667/month | $128,000 |
| Boston, MA | $2,900 | $9,667/month | $116,000 |
| Miami, FL | $2,600 | $8,667/month | $104,000 |
| Los Angeles, CA | $2,500 | $8,333/month | $100,000 |
| Seattle, WA | $2,200 | $7,333/month | $88,000 |
| Chicago, IL | $1,900 | $6,333/month | $76,000 |
| Austin, TX | $1,750 | $5,833/month | $70,000 |
| Phoenix, AZ | $1,500 | $5,000/month | $60,000 |
| Columbus, OH | $1,200 | $4,000/month | $48,000 |
| Memphis, TN | $950 | $3,167/month | $38,000 |
Figures are approximate market estimates as of mid-2026 and vary by neighborhood and unit specifics.
The national median household income of approximately $80,000 (2026) allows comfortable renting in Austin, Phoenix, Columbus, and Memphis — but falls short of the 30% threshold in New York, San Francisco, Boston, Miami, or Los Angeles.
How Landlords Use Rent Calculators
From the landlord’s perspective, a rent calculator serves to set competitive rental prices and qualify tenants financially. Most property managers apply three key qualification criteria:
Income verification: Annual income ≥ 40× monthly rent (the 40× rule).
Credit score: Minimum 620–650 for most conventional rentals; 700+ for competitive markets or luxury units.
Debt-to-income ratio: Total monthly debt obligations (including proposed rent) should not exceed 40–45% of gross monthly income.
Setting Rental Price
Landlords use market-based pricing tools — Zillow Rental Manager, Rentometer, and local MLS data — alongside cost-based calculations to set rent:
Minimum Viable Rent = Monthly Mortgage Payment + Property Taxes/12 + Insurance/12 + Maintenance Reserve/12 + Vacancy Reserve + Profit Margin
Example for a rental property:
| Cost Component | Monthly Amount |
|---|---|
| Mortgage (P&I) | $1,650 |
| Property taxes | $350 |
| Insurance | $120 |
| Maintenance reserve (1% of value/12) | $250 |
| Vacancy reserve (5% of rent) | $120 |
| Property management (8%) | $192 |
| Minimum Viable Rent | $2,682 |
If market comps support $2,800/month, the landlord prices at market. If comps support only $2,400/month, the property has negative cash flow and the investment economics need reassessment.
Building a Rent Calculator in Excel
A functional rent affordability calculator can be built in Excel in minutes:
Cell B1: Annual Gross Income
Cell B2: =B1/12                    [Monthly Gross Income]
Cell B3: =B2*0.30                  [30% Rule Max Rent]
Cell B4: =B1/40                    [40x Rule Max Rent]

Cell B6: Tax Rate (enter as decimal, e.g., 0.22)
Cell B7: =B2*(1-B6)               [Net Monthly Income]
Cell B8: =B7*0.25                  [25% of Net Rule]
Cell B9: =B7*0.30                  [30% of Net Rule]

Cell B11: Target Rent (enter actual rent being considered)
Cell B12: =B11/B2                  [Rent as % of Gross Income]
Cell B13: =B11/B7                  [Rent as % of Net Income]
Cell B14: =IF(B13<=0.30,"Affordable","Review Budget") [Affordability Flag]
Adding a dashboard with conditional formatting (green for affordable, yellow for borderline, red for overstretched) creates a one-page tool for evaluating any rental option against multiple affordability benchmarks simultaneously.
Frequently Asked Questions
How much rent can I afford?
The most commonly used guideline is the 30% rule: rent should not exceed 30% of your gross monthly income. A more conservative and financially rigorous approach uses 25–30% of your net (after-tax) income. The residual income method — subtracting all other expenses from net income — is the most accurate approach for your specific financial situation.
What is the 30% rule for rent?
The 30% rule states that housing costs should not exceed 30% of gross monthly income. It originated in U.S. housing policy in the 1980s and is the standard used by most landlords, financial advisors, and housing assistance programs to define “affordable” rent.
What is the 40x rule for renting?
The 40× rule requires that annual gross income be at least 40 times the monthly rent. For a $2,000/month apartment, you would need $80,000 in annual gross income. It is the landlord’s equivalent of the 30% rule and the most common tenant income qualification standard used by property managers.
How much should I make to afford $1,500 rent?
Under the 30% gross income rule: $1,500 ÷ 0.30 = $5,000/month gross, or $60,000/year. Under the 40× rule: $1,500 × 40 = $60,000/year. Under the 25% net income rule (assuming ~22% effective tax rate): approximately $92,000/year gross.
How much should I make to afford $2,000 rent?
Under the 30% rule: $80,000/year gross. Under the 40× rule: $80,000/year. Under the 25% net income rule: approximately $123,000/year gross.
Is the 30% rule still realistic?
In many high-cost cities, the 30% rule is unachievable for median earners — the income required to rent at 30% in cities like New York or San Francisco significantly exceeds median household income. In those markets, renters typically spend 35–50% of gross income on rent. Financial experts increasingly recommend using net income rather than gross income as the base, and prioritizing total financial health (savings rate, debt levels) over adhering rigidly to the 30% figure.
What other costs should I factor into rent affordability?
Beyond the rent payment itself, budget for utilities ($230–$500/month), renters insurance ($15–$30/month), parking (up to $400/month in urban markets), and pet fees if applicable. Move-in costs — typically first month, last month, and security deposit — require 3–4 months of rent in upfront cash.
How do I calculate rent as a percentage of income?
Divide monthly rent by monthly gross income and multiply by 100. For example: $1,800 rent ÷ $5,500 gross monthly income × 100 = 32.7%. Compare to the 30% guideline to assess affordability.
Conclusion
A rent calculator translates the abstract concept of “affordable housing” into the specific dollar figure that either fits or strains your budget. The 30% gross income rule provides a quick, widely understood benchmark. The 40× landlord rule confirms what property managers will accept. The net income approach gives a more honest picture of what you can actually afford after taxes. And the residual income method — subtracting every real expense from your real take-home pay — gives the most accurate answer of all.
No single formula tells the whole story. The best rent decision uses all of them together: start with the 30% rule as an initial filter, verify against net income, run the residual income math for your actual situation, and then add the full cost of housing — utilities, insurance, parking, and the upfront cash requirement — before signing a lease.
Your rent is not just a monthly payment. It is the foundation on which every other financial goal either stands or struggles. Get it right, and the rest of your budget has room to work.
Related Topics
- House Affordability Calculator: Formula, Examples, and How It Works
- Date Calculator: Formula, Examples, and How It Works
- Income Tax Basics Explained: Brackets, Deductions, and Real-World Examples
- Time Clock Estimator: Formula, Examples, and How It Works
- Time to Decimal Calculator: Formula, Examples, and How It Works