


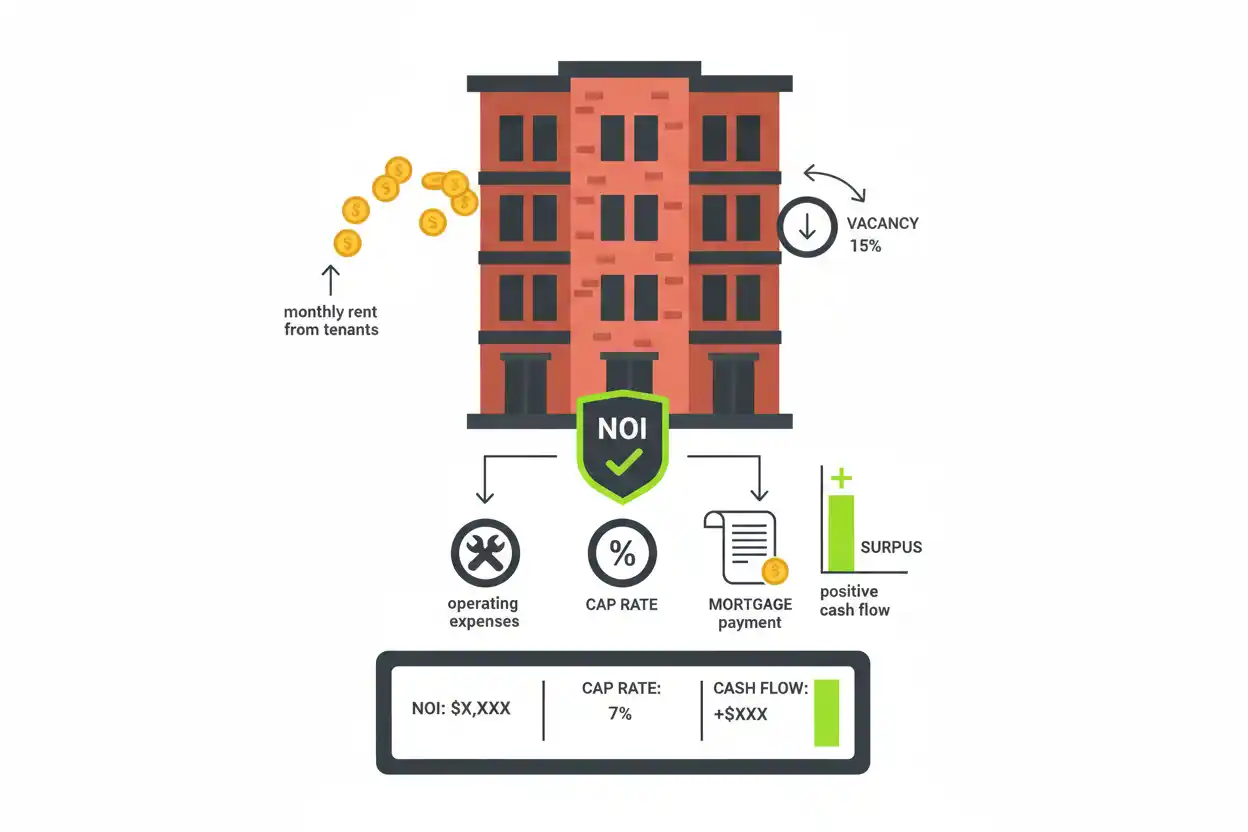
Real estate deal math converts a property’s purchase price, rent, operating costs, financing, and cash invested into comparable performance measures.
For a rental property, no single number tells the whole story.
Cap rate measures net operating income relative to property value before financing. Cash-on-cash return examines annual cash flow relative to equity invested. Debt service coverage ratio compares property income with financing payments. Loan-to-value shows how much of the property is financed with debt.
A useful analysis keeps these measurements separate rather than mixing them into one percentage.
Real Estate Deal Example
Consider a hypothetical rental property with:
- purchase price = $300,000;
- down payment = 25%;
- loan amount = $225,000;
- nominal mortgage rate = 6.5%;
- amortization term = 30 years;
- monthly market rent = $3,000;
- vacancy allowance = 5%;
- annual operating expenses = $10,000;
- additional initial cash for closing and improvements = $15,000.
This example is designed to demonstrate the formulas. Actual property costs, financing terms, taxes, insurance, maintenance, and transaction expenses vary widely.
Purchase Price and Down Payment
First calculate the down payment.
Down Payment = Purchase Price × Down Payment Percentage
Down Payment = $300,000 × 25%
Down Payment = $75,000
Loan amount:
Loan Amount = $300,000 − $75,000
Loan Amount = $225,000
Loan-to-Value Ratio
Loan-to-value, or LTV, is:
LTV = Loan Amount ÷ Property Value × 100
LTV = $225,000 ÷ $300,000 × 100
LTV = 75%
The financing equals 75% of the property’s purchase value in this example.
Mortgage Payment Formula
For a fixed-rate fully amortizing loan:
Payment = Principal × r ÷ [1 − (1 + r)^−n]
Where:
- Principal = $225,000;
- r = monthly interest rate;
- n = monthly payments.
Monthly rate:
r = 6.5% ÷ 12
r = 0.065 ÷ 12
r ≈ 0.00541667
Number of payments:
n = 30 × 12
n = 360
Monthly principal-and-interest payment:
Payment ≈ $1,422.15
Annual debt service:
$1,422.15 × 12 ≈ $17,065.84
Gross Potential Rent
Gross potential rent assumes full occupancy at the stated rent.
Gross Potential Rent = Monthly Rent × 12
Gross Potential Rent = $3,000 × 12
Gross Potential Rent = $36,000
This is not yet realistic effective income because vacancy has not been considered.
Vacancy Allowance
At a 5% vacancy assumption:
Vacancy Allowance = $36,000 × 5%
Vacancy Allowance = $1,800
Effective rental income:
$36,000 − $1,800 = $34,200
The property is modeled as generating $34,200 after the vacancy allowance but before operating expenses.
Net Operating Income
A simplified NOI calculation is:
NOI = Effective Operating Income − Operating Expenses
Using:
- effective rental income = $34,200;
- operating expenses = $10,000.
Then:
NOI = $34,200 − $10,000
NOI = $24,200
Net operating income is $24,200 per year.
For this basic underwriting calculation, debt service is kept out of NOI so property operations can be evaluated separately from financing.
Cap Rate
Capitalization rate is:
Cap Rate = NOI ÷ Property Value × 100
Cap Rate = $24,200 ÷ $300,000 × 100
Cap Rate ≈ 8.07%
The property’s modeled cap rate is approximately 8.07%.
Why Mortgage Payments Are Not Subtracted Before Cap Rate
Cap rate is intended to describe property operating income relative to property value independently of the particular financing structure.
Two buyers could purchase the same property:
- one with cash;
- one with a large mortgage.
The building’s NOI does not change merely because the buyers use different financing.
Cash flow to equity does change.
That is why financing is introduced after NOI for metrics such as cash-on-cash return.
Annual Cash Flow After Debt Service
Using:
NOI = $24,200
and:
Annual Debt Service ≈ $17,065.84
Calculate:
Cash Flow Before Other Owner-Level Items = $24,200 − $17,065.84
≈ $7,134.16
The property generates approximately $7,134.16 of modeled annual cash flow after the mortgage payments under these simplified assumptions.
Total Initial Cash Invested
Down payment:
$75,000
Additional initial cash:
$15,000
Total:
Initial Cash Invested = $90,000
This example combines the assumed upfront cash amounts for simplicity.
Actual acquisition cash can include many property-specific components.
Cash-on-Cash Return
Cash-on-Cash Return = Annual Cash Flow ÷ Initial Cash Invested × 100
Cash-on-Cash Return = $7,134.16 ÷ $90,000 × 100
Cash-on-Cash Return ≈ 7.93%
The modeled cash-on-cash return is approximately 7.93%.
Cap Rate vs Cash-on-Cash Return
The cap rate was:
8.07%
Cash-on-cash return was:
7.93%
These happen to be relatively close in this example, but they measure different things.
Cap rate: property-level operating yield before financing.
Cash-on-cash return: cash flow to the equity invested after modeled debt service.
Changing the loan terms can alter cash-on-cash return without changing the property’s NOI or purchase-price cap rate.
Debt Service Coverage Ratio
DSCR is:
DSCR = NOI ÷ Annual Debt Service
Using:
DSCR = $24,200 ÷ $17,065.84
DSCR ≈ 1.42
A DSCR of approximately 1.42 means modeled NOI is about 1.42 times annual principal-and-interest debt service.
A higher ratio provides more income cushion relative to debt payments, all else equal.
Gross Rent Multiplier
A simplified gross rent multiplier is:
GRM = Property Price ÷ Gross Annual Rent
Using:
GRM = $300,000 ÷ $36,000
GRM ≈ 8.33
GRM is quick to calculate but ignores operating expenses, vacancy, and financing.
It is therefore a screening metric rather than a complete profitability calculation.
Operating Expense Ratio
Using effective income:
Operating Expense Ratio = Operating Expenses ÷ Effective Operating Income
$10,000 ÷ $34,200 × 100
≈ 29.24%
Approximately 29.24% of the modeled effective rental income is consumed by the operating expenses included in the example.
Which expenses belong in the calculation should be defined consistently.
Break-Even Occupancy
A simplified break-even occupancy calculation can ask what percentage of gross potential rent is needed to cover operating expenses plus debt service.
Break-Even Occupancy = (Operating Expenses + Debt Service) ÷ Gross Potential Rent
Using:
($10,000 + $17,065.84) ÷ $36,000
≈ 75.18%
Under these simplified assumptions, approximately 75.18% of gross potential rent is required to cover those modeled costs.
This calculation should not be mistaken for a complete property-risk analysis.
Rent Increase Scenario
Suppose monthly rent rises from $3,000 to $3,150 while other assumptions remain unchanged.
Increase:
$150 ÷ $3,000 × 100
= 5%
New annual potential rent:
$3,150 × 12 = $37,800
At the same 5% vacancy assumption:
Effective Rent = $37,800 × 95%
= $35,910
If operating expenses remain $10,000:
New NOI = $25,910
Cap rate on the original $300,000 price:
$25,910 ÷ $300,000 ≈ 8.64%
A relatively small rent change can materially affect NOI and return metrics.
Expense Increase Scenario
Now suppose rent remains $3,000 monthly but operating expenses rise from $10,000 to $13,000.
Effective rental income:
$34,200
New NOI:
$34,200 − $13,000 = $21,200
Cap rate:
$21,200 ÷ $300,000
≈ 7.07%
Cash flow after the same debt service:
$21,200 − $17,065.84
≈ $4,134.16
Cash-on-cash return:
$4,134.16 ÷ $90,000
≈ 4.59%
Operating-cost assumptions matter substantially.
Vacancy Sensitivity
Suppose vacancy rises from 5% to 10%.
Gross potential rent:
$36,000
Vacancy:
$36,000 × 10% = $3,600
Effective rent:
$32,400
NOI:
$32,400 − $10,000 = $22,400
Cash flow:
$22,400 − $17,065.84
≈ $5,334.16
A deal that appears strong under full occupancy can look very different after realistic vacancy assumptions.
Financing Sensitivity
A higher interest rate increases debt service.
That can reduce:
- annual cash flow;
- cash-on-cash return;
- DSCR.
Yet cap rate remains based on the property’s NOI and market value.
This separation is important: a financing change is not the same thing as an operating-performance change.
Real Estate Deal Math vs Rent Affordability
The renter-side rent affordability calculation asks whether housing costs fit within a household budget.
Real estate deal math asks whether a property investment’s income, expenses, financing, and purchase price produce acceptable economics.
The same monthly rent can therefore be analyzed from two completely different perspectives.
Present Value of Rental Cash Flows
A property produces cash flows across time.
Present value discounts future cash flows into today’s dollars.
If rental cash flows were level and finite, the present value of annuity formula could provide a simplified valuation component.
Real properties typically require a more detailed model because:
- rents change;
- expenses change;
- vacancy changes;
- financing amortizes;
- a future sale may occur.
Real Return on Property Investment
Nominal property returns do not show purchasing-power growth.
Real return adjusts nominal performance for inflation.
For example, if a hypothetical total property return is 9% while inflation is 3%:
Real Return = 1.09 ÷ 1.03 − 1
Real Return ≈ 5.83%
The 9% nominal result corresponds to approximately 5.83% real growth under those assumptions.
Cash Flow Is Not the Same as Profit
Mortgage principal repayment reduces debt but is not treated the same as ordinary operating expense in property-level NOI.
Likewise, property appreciation can increase wealth without producing immediate cash flow.
A complete investment analysis can therefore distinguish:
- NOI;
- debt service;
- cash flow;
- principal reduction;
- appreciation;
- transaction costs;
- taxes where relevant.
No single metric captures all of them.
Property Appreciation
Suppose a $300,000 property increases 4%.
New Value = $300,000 × 1.04
New Value = $312,000
Nominal increase:
$12,000
That increase is not the same as $12,000 of cash flow.
It remains an unrealized market-value change unless the economic value is realized through a sale, refinance, or another transaction.
Equity From Principal Reduction
Suppose part of the annual mortgage payment reduces principal.
That repayment decreases the loan balance and increases owner equity, assuming property value is unchanged.
Therefore, evaluating only annual cash flow can understate one component of wealth accumulation.
However, principal reduction is not free return—the investor funded it through mortgage payments.
Purchase Price Matters
Even a strong rental property can become a weak investment if the purchase price is too high relative to income.
Suppose the same $24,200 NOI property costs $400,000 instead of $300,000.
Cap rate becomes:
$24,200 ÷ $400,000
= 6.05%
The property’s operating performance is unchanged, but the price paid reduces the implied yield.
Deal Math Should Use Consistent Definitions
Before comparing two properties, define:
- whether rent is gross or effective;
- what operating expenses include;
- whether reserves are included;
- whether financing is excluded from NOI;
- how upfront cash is calculated;
- whether returns are before or after taxes.
Comparing inconsistent metrics can make one deal appear better merely because the formulas were built differently.
Quick Real Estate Formula Summary
Gross Potential Rent = Monthly Rent × 12
Effective Rental Income = Gross Potential Rent − Vacancy Loss
NOI = Effective Operating Income − Operating Expenses
Cap Rate = NOI ÷ Property Value
LTV = Loan ÷ Property Value
Cash Flow = NOI − Debt Service
Cash-on-Cash Return = Cash Flow ÷ Cash Invested
DSCR = NOI ÷ Debt Service
These formulas form a practical property-analysis toolkit within broader quick finance math calculations.
Common Real Estate Deal Math Mistakes
One mistake is calculating cap rate after subtracting mortgage payments.
Another is using gross rent as though vacancy and expenses did not exist.
Investors can also underestimate acquisition cash, overestimate rent, or ignore major maintenance needs.
A further mistake is treating appreciation as guaranteed because property values rose historically.
Frequently Asked Questions
What is real estate deal math?
It is the set of calculations used to evaluate property income, expenses, financing, equity, and potential returns.
What is NOI?
NOI = Effective Operating Income − Operating Expenses
for the property-level operating calculation.
What is cap rate?
Cap Rate = NOI ÷ Property Value × 100
Does cap rate include mortgage payments?
The core cap-rate calculation evaluates NOI relative to property value before financing.
What is cash-on-cash return?
Cash-on-Cash Return = Annual Cash Flow ÷ Cash Invested × 100
What is LTV?
LTV = Loan Amount ÷ Property Value × 100
What is DSCR?
DSCR = NOI ÷ Annual Debt Service
Why include vacancy?
Because gross potential rent assumes full collection, which may overstate actual rental income.
Is cash flow the same as total return?
No. Total economic return can also include principal reduction, appreciation, and other factors.
Does a higher cap rate always mean a better property?
No. A higher cap rate can accompany greater operating, location, tenant, or property risk.
Should I use gross rent or effective rent?
Effective rent after a reasonable vacancy or collection assumption generally provides a more realistic starting point for underwriting than assuming every unit is occupied and every payment is collected.
Why calculate several property metrics?
Each metric isolates a different part of the deal, helping property analysis fit into a broader Savings & Investing framework without relying on one misleading percentage.




