Statistics & Probability
-

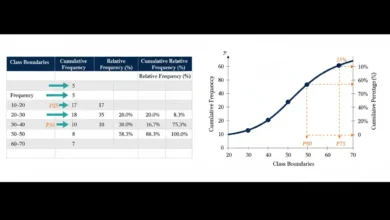
Cumulative Frequency: Definition, Formula & Example
Cumulative frequency is the running total of frequencies in an ordered data set, showing how many observations fall at or…
Read More » -
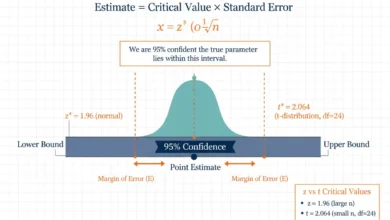
Confidence Interval: Definition, Formula & Example
A confidence interval is a range of plausible values for an unknown population parameter constructed from sample data using a…
Read More » -
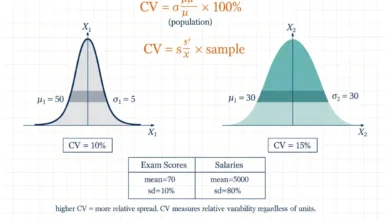
Coefficient Of Variation: Definition, Formula & Example
The coefficient of variation is a dimensionless measure of relative variability that compares a standard deviation with the corresponding arithmetic…
Read More » -
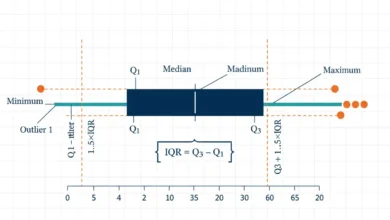
Box Plot: Definition, Formula & Example
A box plot is a compact statistical graph used to summarize the center, spread, and overall distribution of numerical data…
Read More » -
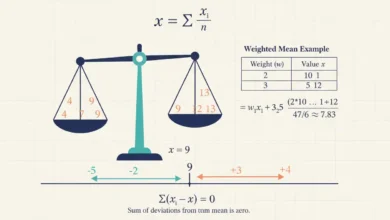
Arithmetic Mean: Definition, Formula & Example
The arithmetic mean is a measure of central tendency found by adding numerical values and dividing their total by the…
Read More » -
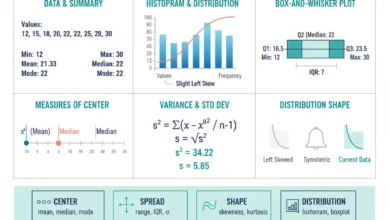
Descriptive Statistics: Complete Guide, Formulas & Examples
Descriptive statistics are methods used to organize, summarize, and present observed data so that its main characteristics can be understood…
Read More » -
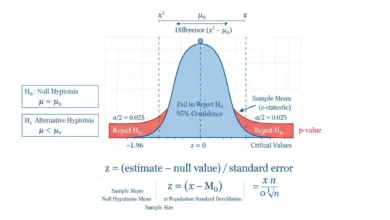
z-Test: Definition, Formula & Example
A z-test is a statistical hypothesis test that measures how far an observed sample estimate lies from a value specified…
Read More » -
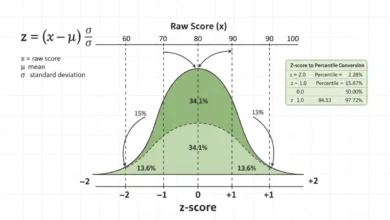
Z-Score: Definition, Formula & Example
A z-score is a standardized value that measures how far an observation lies from a distribution’s mean in units of…
Read More » -
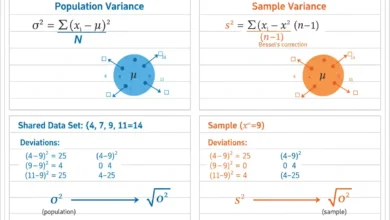
Variance: Population vs Sample
Variance measures how widely numerical values are dispersed around their arithmetic mean by averaging squared deviations from that mean, and…
Read More » -
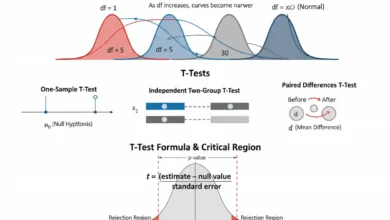
t-Test: Definition, Formula & Example
A t-test is a statistical hypothesis test used to evaluate whether a mean, a difference between means, or a mean…
Read More »