


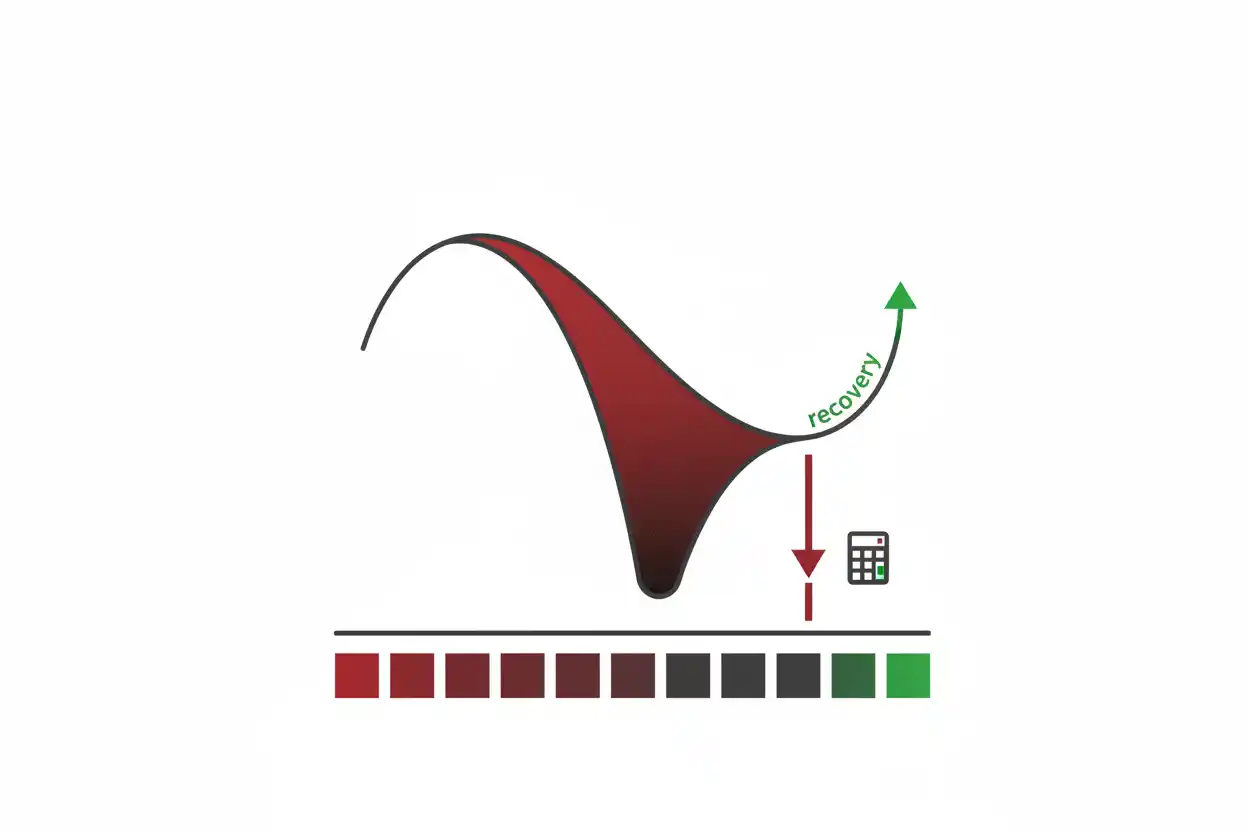
Maximum drawdown measures the largest percentage decline from a portfolio or investment’s previous peak to a subsequent trough during a selected period.
If a portfolio reaches $120,000 and then falls to $78,000 before establishing a new high, the drawdown is 35%.
Maximum drawdown is useful because average return alone can hide how severe an investor’s losses became along the way.
A portfolio can ultimately finish with a positive return while still experiencing a deep drawdown during the measurement period.
What Is Maximum Drawdown?
A drawdown begins when an investment falls below a previous peak.
It continues until either:
- the investment reaches its lowest point for that decline; and
- eventually recovers to the previous peak.
Maximum drawdown, often abbreviated MDD, identifies the deepest such peak-to-trough decline in the selected history.
It answers:
What was the largest percentage loss experienced from a previous high before recovery?
Maximum Drawdown Formula
The formula is:
Drawdown = (Trough Value − Peak Value) ÷ Peak Value × 100
Maximum drawdown is the most negative drawdown observed during the measurement period.
Some presentations report MDD as a positive loss magnitude instead.
For example, a calculated drawdown of −35% may be described as a 35% maximum drawdown.
Maximum Drawdown Example
Suppose a portfolio reaches:
Peak = $120,000
It later declines to:
Trough = $78,000
Calculate the dollar decline:
$78,000 − $120,000 = −$42,000
Now divide by the peak:
Drawdown = −$42,000 ÷ $120,000
Drawdown = −0.35
Convert to a percentage:
Drawdown = −35%
The portfolio experienced a 35% drawdown.
Dollar Loss vs Drawdown Percentage
The dollar loss was:
$42,000
The drawdown percentage was:
35%
The percentage is useful because it allows portfolios of different sizes to be compared.
For example, a $10,000 portfolio falling 35% loses:
$10,000 × 35% = $3,500
A $1 million portfolio falling 35% loses:
$1,000,000 × 35% = $350,000
The dollar consequences differ dramatically, but the percentage drawdown is the same.
How to Find Maximum Drawdown From a Series
Suppose a portfolio has these values:
| Period | Portfolio Value |
|---|---|
| 1 | $100,000 |
| 2 | $110,000 |
| 3 | $120,000 |
| 4 | $105,000 |
| 5 | $90,000 |
| 6 | $78,000 |
| 7 | $95,000 |
| 8 | $118,000 |
| 9 | $125,000 |
The running peak through period 3 is $120,000.
At period 4:
Drawdown = ($105,000 − $120,000) ÷ $120,000
= −12.5%
At period 5:
($90,000 − $120,000) ÷ $120,000 = −25%
At period 6:
($78,000 − $120,000) ÷ $120,000 = −35%
That is the deepest decline.
The investment does not establish a new peak until period 9 reaches $125,000.
Maximum drawdown for the series is therefore 35%.
Running Peak Formula
For each period:
Running Peak = Highest Portfolio Value Observed So Far
Then:
Current Drawdown = Current Value ÷ Running Peak − 1
At $90,000 with a running peak of $120,000:
Current Drawdown = $90,000 ÷ $120,000 − 1
Current Drawdown = −25%
Maximum drawdown is the smallest—or most negative—current-drawdown value in the series.
Recovery From a 35% Drawdown
A 35% decline does not require a 35% gain to recover.
Using the example:
Peak:
$120,000
Trough:
$78,000
Required dollar recovery:
$120,000 − $78,000 = $42,000
But that gain is measured from the smaller $78,000 base.
Required Recovery = $42,000 ÷ $78,000
Required Recovery ≈ 53.85%
The portfolio needs approximately a 53.85% gain to recover from a 35% drawdown.
Drawdown and Recovery Are Asymmetric
Some common examples illustrate the relationship:
| Loss | Gain Needed to Recover |
|---|---|
| 10% | 11.11% |
| 20% | 25% |
| 25% | 33.33% |
| 40% | 66.67% |
| 50% | 100% |
The deeper the loss, the more sharply the required recovery rate increases.
Maximum Drawdown vs Volatility
Volatility measures how widely returns fluctuate.
Maximum drawdown measures the worst historical peak-to-trough loss.
Two portfolios can have similar volatility but different maximum drawdowns because their return sequences differ.
Likewise, a portfolio with occasional large daily movements could avoid a prolonged deep decline, while another with less dramatic day-to-day movements could experience a long cumulative fall.
Both measures can therefore provide useful but different risk information.
Maximum Drawdown vs Return
Suppose an investment begins at $100, rises to $150, falls to $90, and eventually finishes at $130.
Beginning-to-ending return:
($130 − $100) ÷ $100 = 30%
The investment finishes with a positive 30% return.
But drawdown from $150 to $90 was:
($90 − $150) ÷ $150
= −40%
A final positive return therefore does not imply the investment avoided substantial losses along the way.
Maximum Drawdown and Lump-Sum Investing
An investor using lump-sum investing immediately exposes the full invested amount to subsequent drawdowns.
If a large investment is made just before a severe market decline, the dollar drawdown can be substantial.
That does not prove phased investing always performs better. It simply illustrates why entry timing can affect the drawdown experienced by a particular investor.
Maximum Drawdown and Lump Sum vs SIP
The lump sum vs SIP comparison changes the timing at which capital becomes exposed to market declines.
During a falling market, a phased investor may have some planned capital still outside the investment.
However, once fully invested, the portfolio remains subject to future drawdowns.
A contribution schedule changes exposure timing; it does not eliminate drawdown risk.
Maximum Drawdown and Modified Duration
For fixed-income portfolios, modified duration helps estimate price sensitivity to yield movements.
Maximum drawdown instead measures what the portfolio actually lost from peak to trough over the selected history.
A bond portfolio can experience a substantial drawdown when interest rates, credit spreads, or other conditions move adversely.
Duration helps explain one possible driver; drawdown measures the resulting loss path.
Maximum Drawdown and Money-Weighted Return
Money-weighted return incorporates the timing and size of investor cash flows.
Maximum drawdown generally focuses on portfolio-value or return history.
Large deposits or withdrawals can therefore complicate a naive drawdown calculation.
For investment-manager analysis, drawdowns are often measured using a return series or unitized portfolio value that removes the mechanical effect of external cash flows.
Maximum Drawdown Inside an IRA
An IRA does not prevent investment losses.
If an IRA contains volatile assets, the account can experience significant drawdowns.
The tax structure of the IRA and the market risk of the holdings are different characteristics.
Investors nearing withdrawals may care particularly about drawdown because a severe decline can coincide with a period when assets need to be sold.
Current Drawdown vs Maximum Drawdown
Suppose a portfolio previously peaked at $100,000, fell to $70,000, recovered to $110,000, and is now worth $99,000.
Historical maximum drawdown:
($70,000 − $100,000) ÷ $100,000 = −30%
Current drawdown uses the newer $110,000 peak:
($99,000 − $110,000) ÷ $110,000
= −10%
Therefore:
- current drawdown = 10%;
- historical maximum drawdown = 30%.
They answer different questions.
Drawdown Duration
Drawdown depth does not tell you how long the investment remained below its prior peak.
A 30% decline that recovers in six months and a 30% decline that takes five years to recover have the same maximum drawdown percentage.
But the investor experience is very different.
A complete drawdown analysis can therefore consider both:
- depth;
- recovery time.
New Peaks Reset the Drawdown Reference
Suppose an investment rises from $100 to $120, declines to $110, then climbs to $130.
Once $130 becomes the new high, subsequent drawdown calculations use $130 as the running peak.
If the investment later falls to $104:
Drawdown = ($104 − $130) ÷ $130
Drawdown = −20%
The older $120 peak is no longer the relevant high-water mark.
Contributions Can Distort Drawdown
Suppose an account is worth $50,000 and the investor deposits another $50,000.
The account value jumps to $100,000 even though there was no investment return.
A later decline to $80,000 could misleadingly appear to be a 20% drawdown from the $100,000 account value.
For performance analysis, external contributions should be separated from investment returns.
Withdrawals Can Also Distort Drawdown
Suppose a $100,000 account distributes $20,000 to its owner and is therefore worth $80,000 afterward.
That is not automatically a 20% investment loss.
Part of the decline in account value came from money deliberately removed.
Drawdown calculations need a return series that treats investor cash flows correctly.
Maximum Drawdown Is Historical
Maximum drawdown tells you the worst loss observed in the selected data.
It does not tell you the worst loss that could happen in the future.
If a portfolio’s historical maximum drawdown is 20%, a future drawdown could be:
- smaller;
- similar;
- substantially larger.
Historical risk measurements are descriptive rather than guaranteed limits.
Measurement Period Matters
A portfolio can have:
Five-Year MDD = 15%
and:
Twenty-Year MDD = 45%
if the longer period includes a severe market decline excluded from the five-year window.
Comparisons should therefore use consistent dates and methodologies.
Common Maximum Drawdown Mistakes
One mistake is using beginning value instead of the actual prior peak.
Another is treating withdrawals as market losses.
Investors may also assume a 40% decline requires only a 40% recovery.
Finally, historical maximum drawdown should not be interpreted as the maximum possible future loss.
Frequently Asked Questions
What is maximum drawdown?
Maximum drawdown is the largest peak-to-trough percentage decline observed during a selected period.
What is the maximum drawdown formula?
Drawdown = (Trough − Peak) ÷ Peak × 100
Maximum drawdown is the deepest drawdown in the data.
What does a 30% maximum drawdown mean?
It means the investment fell 30% from a previous peak to a subsequent trough before establishing a new peak.
Is maximum drawdown the same as loss from the starting value?
No. The calculation uses a previous peak, which may be higher than the starting value.
How much must an investment gain after a 50% drawdown?
It must gain 100% from the reduced value to return to the previous peak.
Is maximum drawdown the same as volatility?
No. Volatility measures return dispersion; maximum drawdown measures the worst observed cumulative decline from a peak.
Can a profitable investment have a large maximum drawdown?
Yes. An investment can finish above its starting value after experiencing a severe decline during the period.
Does maximum drawdown include withdrawals?
A proper performance drawdown should avoid treating external withdrawals as investment losses.
Does maximum drawdown predict the worst future loss?
No. It describes historical data only.
What is current drawdown?
Current drawdown measures how far the present value remains below the most recent running peak.
Does a new high reset the drawdown calculation?
Yes. A new peak becomes the reference level for subsequent drawdowns.
Why is maximum drawdown useful?
It adds a practical measure of downside experience to return analysis within a broader Savings & Investing framework.




