


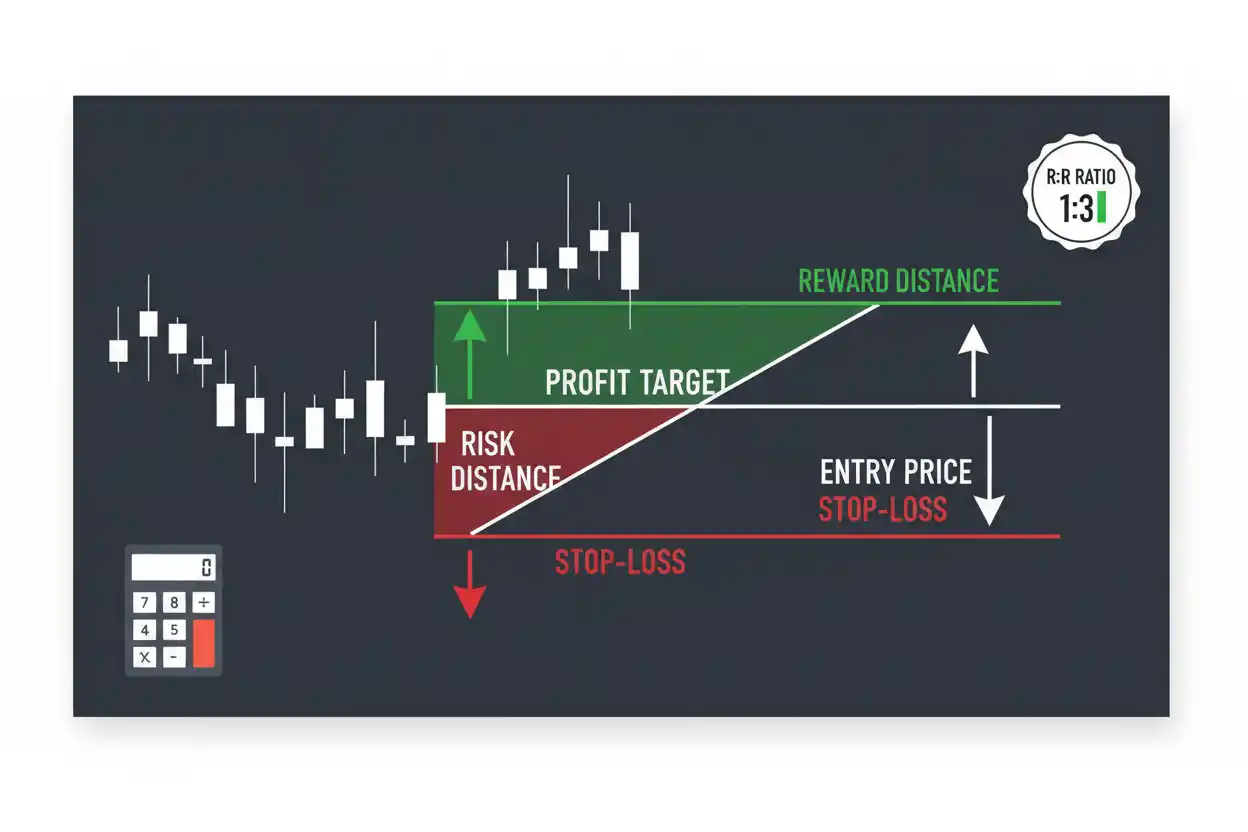
The risk-reward ratio compares the amount a trader is prepared to lose on a trade with the potential profit if the target is reached.
Suppose a trader buys at $100, sets a stop at $96, and sets a target at $112.
Potential risk is $4 per share.
Potential reward is $12 per share.
The trade therefore has a 1:3 risk-reward ratio—one unit of potential loss for three units of potential gain.
The ratio helps structure trades, but it does not tell you how likely the target or stop is to be reached.
What Is the Risk-Reward Ratio?
A risk-reward ratio expresses:
Potential Loss : Potential Gain
For example:
1 : 2
means the planned upside is twice the planned downside.
Different traders and platforms sometimes reverse the convention and report reward-to-risk instead.
To avoid confusion, always state which form is being used.
This article uses:
Risk : Reward
Risk Formula for a Long Trade
For a long position:
Risk per Unit = Entry Price − Stop Price
Suppose:
- entry = $100;
- stop = $96.
Then:
Risk = $100 − $96
Risk = $4 per share
Reward Formula for a Long Trade
Reward per Unit = Target Price − Entry Price
Using:
- target = $112;
- entry = $100.
Then:
Reward = $112 − $100
Reward = $12 per share
Risk-Reward Ratio Formula
Using the risk:reward convention:
Risk-Reward Ratio = Risk ÷ Reward
Numerically:
$4 ÷ $12 = 0.3333
That is commonly expressed as:
1 : 3
because the potential reward is three times the potential loss.
Reward-to-Risk Ratio
If the convention is reversed:
Reward-to-Risk = Reward ÷ Risk
Using the same trade:
$12 ÷ $4 = 3
The reward-to-risk ratio is:
3.0
This is economically the same trade.
Only the way the ratio is written changes.
Why Ratio Convention Matters
Suppose one trader says:
Risk-Reward = 1:3
and another platform displays:
Reward/Risk = 3.0
They describe the same setup.
But if someone simply says:
Ratio = 3
without defining the convention, the meaning can be ambiguous.
Always identify whether the numerator is risk or reward.
Short Trade Example
Suppose a trader sells short at:
$80
Stop:
$84
Target:
$68
For a short position:
Risk = Stop − Entry
Risk = $84 − $80
Risk = $4
Reward:
Reward = Entry − Target
Reward = $80 − $68
Reward = $12
Risk-reward ratio:
$4 : $12
= 1 : 3
The direction of subtraction changes for a short trade, but the economic logic is the same.
Dollar Risk Based on Position Size
The per-share ratio does not tell you the total amount at risk.
Suppose:
- risk per share = $4;
- shares = 100.
Then:
Total Trade Risk = $4 × 100
Total Trade Risk = $400
Potential profit:
$12 × 100 = $1,200
The 1:3 relationship remains unchanged.
Position Size From Maximum Dollar Risk
Suppose the trader is willing to risk no more than:
$500
Risk per share:
$4
Maximum position size:
Position Size = Maximum Dollar Risk ÷ Risk per Share
Position Size = $500 ÷ $4
Position Size = 125 shares
At 125 shares:
Potential loss:
125 × $4 = $500
Potential reward:
125 × $12 = $1,500
Account Risk Percentage
Suppose:
- trading account = $50,000;
- maximum trade risk = $500.
Account risk:
$500 ÷ $50,000 × 100
= 1%
A 1% account-risk limit and a 1:3 trade setup answer different questions.
1% describes how much account capital is at risk.
1:3 describes the relationship between potential loss and potential gain.
Break-Even Win Rate
Ignoring fees, slippage, taxes, and other complications, the break-even win rate can be estimated as:
Break-Even Win Rate = Risk ÷ (Risk + Reward)
For a 1:3 trade:
Break-Even Win Rate = 1 ÷ (1 + 3)
= 25%
A strategy with exactly one unit of loss for three units of gain needs to win more than 25% of trades to have positive expectancy under these simplified assumptions.
Break-Even Rate for 1:2
For:
Risk : Reward = 1 : 2
Break-even:
1 ÷ (1 + 2)
= 33.33%
For 1:1:
1 ÷ 2 = 50%
Larger reward relative to risk lowers the theoretical break-even win rate.
Win Rate Alone Is Not Enough
Suppose Strategy A wins:
70% of trades
but earns $1 when right and loses $3 when wrong.
Expected value per trade:
0.70 × $1 − 0.30 × $3
$0.70 − $0.90
= −$0.20
Despite a 70% win rate, expectancy is negative.
The size of wins and losses matters alongside win frequency.
Expected Value Formula
A simplified trading expectancy formula is:
Expected Value = Win Probability × Average Win − Loss Probability × Average Loss
Suppose:
- win rate = 40%;
- average win = $300;
- loss rate = 60%;
- average loss = $100.
Then:
EV = 0.40 × $300 − 0.60 × $100
EV = $120 − $60
EV = $60 per trade
The positive expectancy exists despite winning fewer than half of the trades.
Planned Risk vs Actual Loss
A stop at $96 does not guarantee an exact $4 loss from a $100 entry.
Real execution can differ because of:
- price gaps;
- slippage;
- low liquidity;
- order type;
- fast markets;
- trading costs.
The ratio is therefore a planned trade structure, not a guaranteed realized result.
Transaction Costs Matter
Suppose the expected reward is $200 and expected loss is $100.
Ignoring costs:
Risk : Reward = 1 : 2
If round-trip trading costs average $20:
Effective reward:
$200 − $20 = $180
Effective loss:
$100 + $20 = $120
Effective relationship:
$120 : $180
= 1 : 1.5
Costs can materially weaken small-target strategies.
Risk-Reward Ratio vs Risk-Adjusted Return
Risk-adjusted return evaluates investment performance relative to measured risk such as volatility or downside deviation.
Risk-reward ratio evaluates a trade setup before or during a trade.
A Sharpe ratio of 0.8 and a planned risk-reward ratio of 1:3 have no direct numerical relationship.
Risk-Reward Ratio and Retirement Withdrawals
The retirement withdrawals problem is fundamentally different.
Retirement planning asks how a diversified pool of capital can support decades of spending.
A 1:3 risk-reward rule for individual trades cannot establish a sustainable retirement withdrawal strategy.
Applying trading metrics to long-horizon retirement cash flow can create misleading conclusions.
Risk-Reward Ratio and Retirement Savings
Retirement savings generally rely on long-term portfolio growth, contributions, diversification, and compounding.
A trader may still hold long-term retirement investments separately from a trading account.
The risk framework appropriate to one should not automatically be imposed on the other.
Risk-Reward Ratio and Roth IRA
A Roth IRA is a retirement account structure.
Holding speculative trades inside a tax-advantaged account does not eliminate trading losses.
An unfavorable trade can permanently reduce retirement capital even if the account itself has favorable tax treatment.
Rule of 69 and Trading
The Rule of 69 estimates doubling time under continuous compounding assumptions.
It does not estimate the probability that a trade target will be reached.
Compounding shortcuts and trade risk-reward calculations solve different problems.
Stop Placement Should Come Before Position Size
A common disciplined sequence is:
- identify the trade thesis;
- determine where the thesis would be invalidated;
- place the planned stop around that logic;
- calculate risk per unit;
- calculate position size.
Choosing an arbitrary tight stop solely to manufacture an attractive ratio can result in frequent stop-outs.
Target Placement Should Also Have a Basis
Likewise, a distant target can create an impressive ratio mathematically.
Suppose:
- risk = $2;
- target reward = $20.
The ratio is:
1 : 10
But if the $20 target has little realistic probability of being reached, the ratio alone is not useful.
Probability and market structure matter.
A Good Ratio Does Not Mean a Good Trade
A trade with a 1:5 ratio can still have negative expectancy if the success probability is extremely low.
Conversely, a strategy with a modest 1:1 ratio can be profitable with a sufficiently high win rate and controlled costs.
Risk-reward ratio is one input in a trading system—not a complete strategy.
Risk-Reward and Portfolio Risk
Even if each trade individually limits risk to 1% of account value, several highly correlated positions can create a much larger portfolio-level exposure.
For example, five trades tied to the same market factor may all lose simultaneously.
Position-by-position risk controls should therefore be supplemented with portfolio-level analysis.
Reward Can Change During the Trade
If a trader moves:
- stop;
- profit target;
- position size;
after entering, the original risk-reward ratio changes.
Performance evaluation should therefore distinguish:
- planned ratio;
- realized average win/loss ratio.
A strategy’s real results come from executed trades, not initial chart annotations.
Common Risk-Reward Ratio Mistakes
One mistake is failing to define whether the ratio is risk:reward or reward:risk.
Another is ignoring transaction costs and slippage.
Traders can also choose unrealistic targets merely to create attractive ratios.
A further mistake is focusing on ratio while ignoring win probability and total portfolio exposure.
Frequently Asked Questions
What is a risk-reward ratio?
It compares the potential loss on a trade with its potential gain.
How is a 1:3 risk-reward ratio interpreted?
For every $1 of planned risk, the trade has $3 of planned potential reward.
What is the formula for a long trade’s risk?
Risk = Entry Price − Stop Price
What is the reward formula?
Reward = Target Price − Entry Price
for a long position.
What is reward-to-risk?
Reward-to-Risk = Potential Reward ÷ Potential Risk
A 1:3 risk-reward setup has a reward-to-risk ratio of 3.
What is the break-even win rate for 1:3?
Ignoring costs:
1 ÷ 4 = 25%
Does a high risk-reward ratio guarantee profit?
No. The target may have a low probability of being reached.
Does a stop guarantee my maximum loss?
No. Gaps and slippage can cause actual losses to exceed planned risk.
Should position size be based on risk?
A common risk-control method is:
Position Size = Maximum Dollar Risk ÷ Risk per Unit
Is risk-reward ratio the same as Sharpe ratio?
No. Sharpe is a portfolio-performance metric; risk-reward describes a trade setup.
Can a low win-rate strategy make money?
Potentially, if average wins are sufficiently larger than average losses and costs are controlled.
Why use a risk-reward ratio?
It helps define potential downside and upside before committing capital within the broader Savings & Investing framework.




