


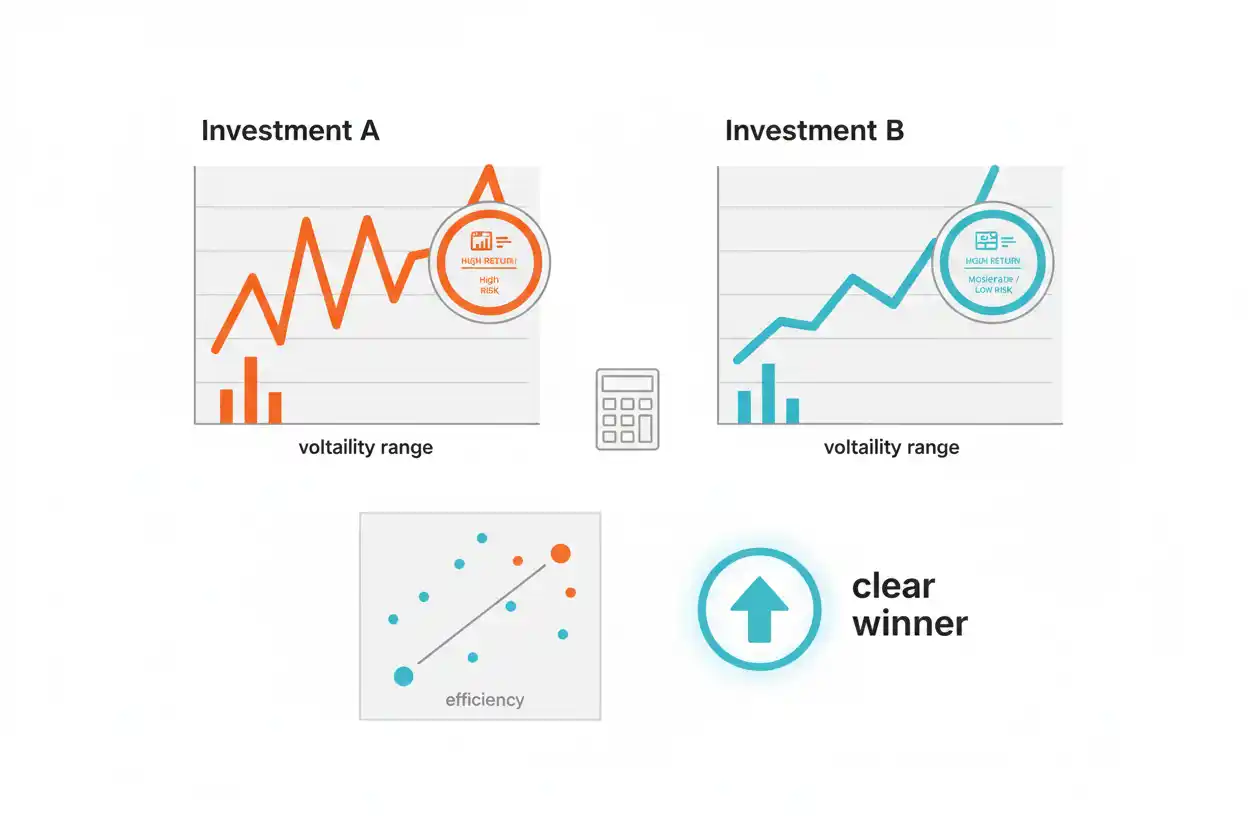
Risk-adjusted return evaluates investment performance relative to the amount or type of risk taken to produce that performance.
A 12% return is not automatically superior to an 8% return if achieving 12% required dramatically more volatility or downside exposure.
For example, a portfolio returning 10% with 12% volatility and a 4% risk-free rate has a Sharpe ratio of 0.50. Another portfolio returning only 8% but with 6% volatility produces a Sharpe ratio of approximately 0.67.
Under that specific metric, the lower-return portfolio delivered more excess return per unit of measured volatility.
What Is Risk-Adjusted Return?
Risk-adjusted return is not one universal formula.
It is a category of measurements that relate investment performance to risk.
Common approaches include:
- Sharpe ratio;
- Sortino ratio;
- Treynor ratio;
- Jensen’s alpha;
- other risk-normalized measures.
The correct metric depends on which type of risk matters for the analysis.
Why Raw Return Can Be Misleading
Suppose:
Investment A
Return = 12%
Investment B
Return = 9%
At first glance, A appears better.
But suppose:
- A volatility = 25%;
- B volatility = 8%.
The higher-return investment required much more measured variability.
Risk-adjusted analysis helps put those returns on a more comparable basis.
Sharpe Ratio Formula
One widely used risk-adjusted return measure is the Sharpe ratio:
Sharpe Ratio = (Portfolio Return − Risk-Free Rate) ÷ Portfolio Volatility
Where:
- Portfolio Return = return being evaluated;
- Risk-Free Rate = reference low-risk return for the same general period;
- Portfolio Volatility = standard deviation of returns.
The numerator measures excess return.
The denominator measures volatility.
Sharpe Ratio Example
Suppose Portfolio A has:
- return = 10%;
- risk-free rate = 4%;
- volatility = 12%.
Excess return:
10% − 4% = 6%
Then:
Sharpe Ratio = 6% ÷ 12%
Sharpe Ratio = 0.50
Portfolio A produced 0.50 units of excess return per unit of measured volatility.
Compare a Second Portfolio
Portfolio B has:
- return = 8%;
- risk-free rate = 4%;
- volatility = 6%.
Excess return:
8% − 4% = 4%
Sharpe ratio:
4% ÷ 6%
≈ 0.67
Portfolio B has a lower raw return but a higher Sharpe ratio.
Under the volatility-based Sharpe framework, Portfolio B has the stronger risk-adjusted result.
Why a Higher Sharpe Ratio Is Generally Preferred
All else equal:
More Excess Return + Less Volatility = Higher Sharpe Ratio
A higher ratio means the portfolio generated more return above the reference rate per unit of volatility.
However, the ratio should not be interpreted as a universal quality score.
It inherits limitations from:
- the return data;
- volatility measurement;
- chosen time period;
- risk-free rate;
- return distribution.
Negative Sharpe Ratio
Suppose:
- portfolio return = 2%;
- risk-free rate = 4%;
- volatility = 10%.
Then:
Sharpe Ratio = (2% − 4%) ÷ 10%
Sharpe Ratio = −0.20
A negative Sharpe ratio indicates the portfolio underperformed the selected risk-free reference during the measurement period.
Sharpe Ratio With Negative Investment Return
Suppose:
- portfolio return = −6%;
- risk-free rate = 3%;
- volatility = 15%.
Excess return:
−6% − 3% = −9%
Sharpe:
−9% ÷ 15%
= −0.60
The investment delivered a negative excess return while taking substantial volatility.
Sortino Ratio
The Sortino ratio modifies the idea by focusing on downside risk rather than total volatility.
Sortino Ratio = (Portfolio Return − Target or Minimum Acceptable Return) ÷ Downside Deviation
Some versions use a risk-free rate in the numerator; others use a stated target return.
The methodology should therefore be identified before comparing Sortino ratios.
Sortino Example
Suppose:
- portfolio return = 10%;
- minimum acceptable return = 4%;
- downside deviation = 8%.
Then:
Sortino Ratio = (10% − 4%) ÷ 8%
Sortino Ratio = 0.75
The portfolio produces 0.75 units of excess return per unit of measured downside deviation.
Sharpe vs Sortino
Sharpe treats both upside and downside volatility as risk.
Sortino focuses more specifically on unfavorable volatility below a threshold.
An investment with irregular large positive gains can have high total volatility even though investors may not view those positive surprises as harmful.
Sortino can be useful when downside behavior is the main concern.
Risk-Adjusted Return and Retirement Withdrawals
For retirement withdrawals, raw return alone may be insufficient.
A retirement portfolio with a high average return but severe early losses can struggle because withdrawals remove assets during periods of weakness.
A more stable return path can sometimes be more useful than a higher but extremely volatile average return.
Risk-adjusted analysis therefore complements retirement sustainability calculations.
Risk-Adjusted Return and Retirement Savings
During retirement savings, investors often focus on long-term growth.
But two strategies capable of producing similar ending returns can expose the saver to very different levels of drawdown and volatility.
Evaluating risk-adjusted performance can help distinguish:
Return achieved
from:
Risk required to achieve it
Risk-Adjusted Return vs Risk-Reward Ratio
The risk-reward ratio compares the potential loss and potential gain of a defined trade.
Risk-adjusted return evaluates realized or expected performance relative to measured portfolio risk.
For example:
- risk-reward ratio might be 1:3 on a trade setup;
- Sharpe ratio might be 0.70 for a portfolio’s historical performance.
They should not be used interchangeably.
Risk-Adjusted Return and Roth IRA
A Roth IRA is an account structure, not an investment strategy.
A Roth IRA can hold investments with:
- high volatility;
- low volatility;
- strong or weak risk-adjusted returns.
Tax treatment does not eliminate investment risk.
The risk-adjusted performance comes from what is held inside the account.
Risk-Adjusted Return and Replacement Ratio
A retirement replacement ratio helps define the retirement-income target.
Risk-adjusted return helps evaluate how efficiently the portfolio attempts to generate the growth needed to support that target.
A retirement plan should not chase the highest historical return without considering the losses and volatility that could occur while funding withdrawals.
Treynor Ratio
The Treynor ratio uses beta instead of total volatility:
Treynor Ratio = (Portfolio Return − Risk-Free Rate) ÷ Beta
This metric focuses on systematic market risk.
Suppose:
- return = 11%;
- risk-free rate = 4%;
- beta = 1.4.
Then:
Treynor Ratio = 7% ÷ 1.4
= 5%
Its numerical scale differs from the Sharpe ratio, so values from different metrics should not be compared directly.
Jensen’s Alpha
Jensen’s alpha compares actual return with a model-implied expected return.
A simplified CAPM-based form is:
Alpha = Portfolio Return − [Risk-Free Rate + Beta × (Market Return − Risk-Free Rate)]
Suppose:
- portfolio return = 12%;
- risk-free rate = 4%;
- beta = 1.0;
- market return = 10%.
Expected return under CAPM:
4% + 1 × (10% − 4%) = 10%
Alpha:
12% − 10% = 2%
The portfolio exceeded the model’s predicted return by 2 percentage points in this example.
Same Return, Different Risk
Suppose:
- Portfolio X return = 9%;
- Portfolio Y return = 9%.
But:
- X volatility = 8%;
- Y volatility = 18%.
With a 3% risk-free rate:
X Sharpe:
(9% − 3%) ÷ 8% = 0.75
Y Sharpe:
(9% − 3%) ÷ 18% ≈ 0.33
Both earned the same raw return, but X generated it with substantially less measured volatility.
Same Risk, Different Return
Now suppose both portfolios have 10% volatility.
Portfolio X return:
7%
Portfolio Y return:
11%
Risk-free rate:
3%
Sharpe X:
(7% − 3%) ÷ 10% = 0.40
Sharpe Y:
(11% − 3%) ÷ 10% = 0.80
Portfolio Y delivered more excess return for the same volatility.
Time Period Matters
A portfolio can have:
- strong three-year Sharpe ratio;
- weak 10-year Sharpe ratio.
Risk-adjusted metrics depend on the historical period selected.
A favorable measurement window should not be treated as permanent evidence of superior performance.
Frequency Matters
Calculating volatility from:
- daily returns;
- monthly returns;
- annual returns;
can produce different estimates.
When annualizing risk-adjusted metrics, return and volatility frequencies need to be handled consistently.
Comparisons should use the same methodology.
Risk-Free Rate Matters
Suppose portfolio return remains 8%.
If the risk-free rate is 1%:
Excess Return = 7%
If it rises to 5%:
Excess Return = 3%
The portfolio’s Sharpe ratio falls even though the portfolio return itself is unchanged.
Opportunity cost matters.
Volatility Is Not Every Form of Risk
A low-volatility investment can still face:
- credit risk;
- liquidity risk;
- inflation risk;
- fraud risk;
- concentration;
- valuation risk.
Sharpe ratio cannot capture every possible risk merely because standard deviation appears in its denominator.
Non-Normal Returns
Risk-adjusted metrics based on standard deviation can be less informative for investments whose returns contain:
- extreme tail events;
- skewness;
- illiquidity;
- infrequent pricing.
An apparently smooth historical return series can understate economic risk if market prices are not updated frequently.
Leverage Can Distort Comparisons
Leverage can increase both return and volatility.
Suppose borrowing doubles the exposure of a portfolio.
Raw returns may become larger, but losses can also magnify.
Risk-adjusted metrics help evaluate whether the additional return actually compensates for the additional measured risk.
A Higher Ratio Is Not a Guarantee
A portfolio with the best historical Sharpe ratio can still perform poorly next year.
Risk-adjusted metrics describe a measurement period or forecast assumptions.
They do not establish a guaranteed ranking of future investment outcomes.
Common Risk-Adjusted Return Mistakes
One mistake is comparing raw returns without considering risk.
Another is assuming all volatility is harmful.
People may also compare Sharpe ratios calculated using different time periods or different risk-free rates.
A further mistake is interpreting a strong historical risk-adjusted return as a guarantee of future performance.
Frequently Asked Questions
What is risk-adjusted return?
It evaluates investment performance relative to the risk taken to produce that performance.
Is there one universal risk-adjusted return formula?
No. Sharpe, Sortino, Treynor, alpha, and other measures use different definitions of risk.
What is the Sharpe ratio formula?
Sharpe Ratio = (Portfolio Return − Risk-Free Rate) ÷ Portfolio Volatility
What does a higher Sharpe ratio mean?
It generally indicates more excess return per unit of measured volatility.
Can the Sharpe ratio be negative?
Yes, when portfolio return is below the selected risk-free rate.
What is the Sortino ratio?
It measures excess return relative to downside deviation rather than total volatility.
Is risk-adjusted return the same as risk-reward ratio?
No. Risk-reward compares potential trade loss with potential gain; risk-adjusted return compares performance with measured investment risk.
Does a high return automatically mean good risk-adjusted performance?
No. Very high volatility can make the risk-adjusted result relatively weak.
Does a Roth IRA have its own risk-adjusted return?
No. The return depends on the investments held inside the account.
Can risk-adjusted return predict the future?
No. Historical ratios do not guarantee future results.
Why does the risk-free rate matter?
It represents the return available without assuming the same level of investment risk and therefore sets the excess-return benchmark.
Why use risk-adjusted return?
It adds essential context to raw performance when evaluating investments within the broader Savings & Investing framework.




