


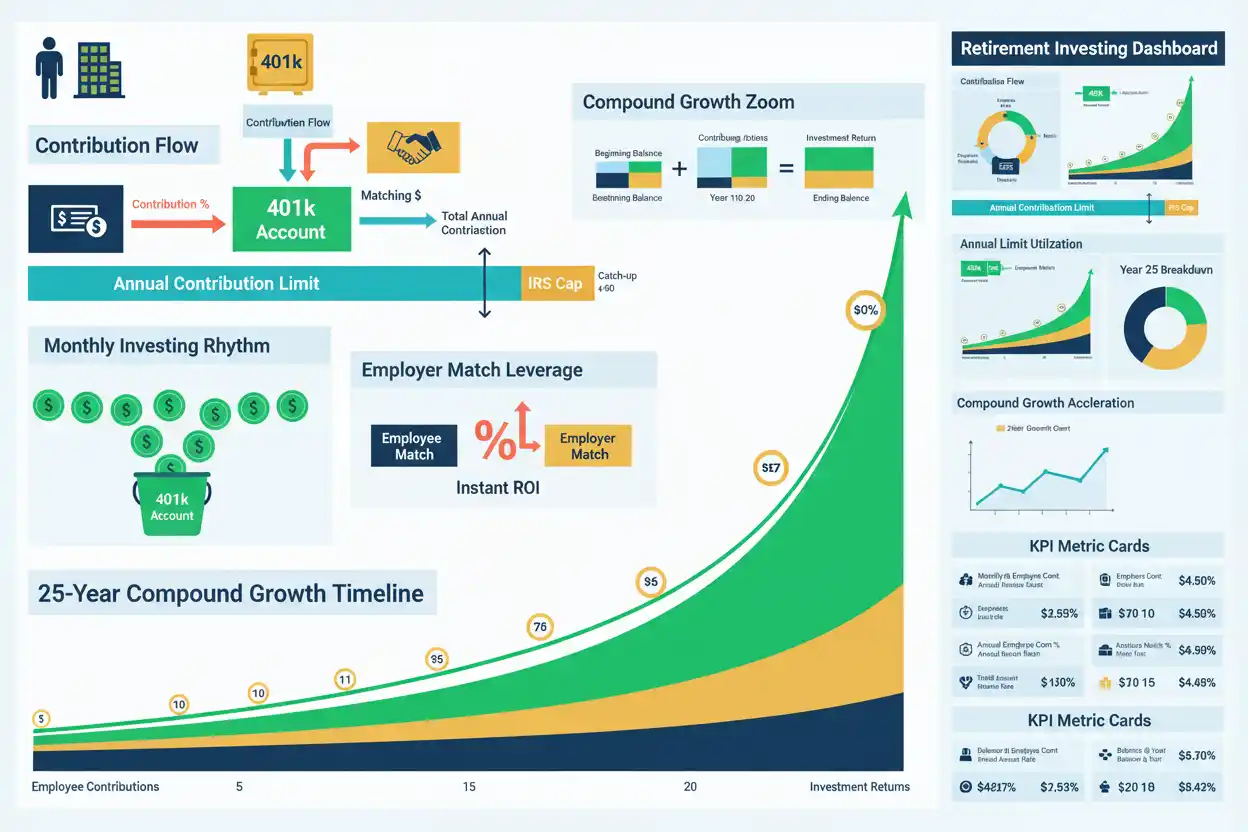
401(k) growth comes from three main sources:
employee contributions, employer contributions when the plan provides them, and investment returns on money already accumulated in the account.
A useful simplified formula is:
Annual 401(k) Addition = Employee Contribution + Employer Contribution
Growth then compounds on the accumulated balance:
Ending Balance = Beginning Balance × (1 + Return) + Contributions
For equal periodic contributions, the future-value formula becomes:
FV = PV(1 + r)ⁿ + C × [((1 + r)ⁿ − 1) ÷ r]
The exact result depends on contribution timing, investment returns, fees, and plan rules.
2026 401(k) Contribution Limit
For 2026, the IRS increased the standard employee elective-deferral limit for most traditional and safe-harbor 401(k) plans to:
$24,500
The ordinary age-50-and-older catch-up limit is:
$8,000
and employees who are age 60, 61, 62, or 63 during 2026 can have a higher catch-up limit of:
$11,250
when the applicable plan permits catch-up contributions.
That means a qualifying participant age 50+ under the ordinary catch-up rule can potentially defer:
$24,500 + $8,000
$32,500
while an eligible age-60-to-63 participant can potentially reach:
$24,500 + $11,250
$35,750.
Overall 2026 Defined-Contribution Limit
The employee elective-deferral limit is not the same as the overall annual-additions limit.
The IRS states that total annual additions—including applicable employee deferrals, employer matching contributions, employer nonelective contributions, and certain forfeiture allocations—generally cannot exceed the lesser of 100% of compensation or:
$72,000 for 2026
before eligible catch-up contributions.
Therefore:
Employee Deferral Limit ≠ Total 401(k) Account Contribution Limit
Employer Match Formula
Employer matching formulas vary by plan.
For a simple plan offering a 100% match on employee contributions up to 5% of salary:
Maximum Employer Match = Eligible Salary × 5%
Suppose:
Eligible salary = $100,000
Maximum match:
$100,000 × 5%
$5,000
If the employee contributes at least $5,000 under that hypothetical formula, the employer contributes another $5,000.
Actual matching formulas and vesting rules come from the employer plan.
401(k) Contribution Example
Suppose:
Salary = $100,000
Employee contribution rate = 10%
Employee contribution:
$100,000 × 10%
$10,000 per Year
Employer matches 100% of the first 5%:
Employer Match = $5,000
Total annual amount invested:
$10,000 + $5,000
$15,000
The match increases annual investing by:
50% Relative to the Employee’s $10,000 Contribution
without requiring another $5,000 from the employee.
25-Year Growth With Employer Match
Assume for illustration:
Annual employee contribution = $10,000
Annual employer contribution = $5,000
Total = $15,000
Investment return = 7% annually
Contributions modeled monthly
Time = 25 years
Starting balance = $0
Monthly contribution:
$15,000 ÷ 12
$1,250
Using monthly compounding:
FV = C × [((1 + r)ⁿ − 1) ÷ r]
with:
monthly r = 7% ÷ 12
n = 25 × 12
Estimated value:
≈ $1,012,590
The 7% return is an assumption, not a promised 401(k) return.
Growth Without the Employer Match
If the employee contributes the same $10,000 annually but receives no employer match:
Monthly contribution:
$833.33
Estimated 25-year value at the same illustrative 7% return:
≈ $675,060
Difference:
$1,012,590 − $675,060
≈ $337,530
That difference represents the compounded effect of the hypothetical $5,000 annual employer match.
Why Employer Matching Matters
The employer’s $5,000 annual contribution itself compounds.
Over 25 years at the assumed return:
Future Value of Match Contributions ≈ $337,530
The total employer cash contributed was only:
$5,000 × 25
$125,000
The remaining modeled amount comes from compound growth.
This demonstrates why plan matching can be one of the most consequential inputs in a savings & investing plan.
401(k) Growth Is Not a Fixed Interest Rate
A 401(k) is an account structure, not one specific investment.
The investment return depends on what the account owns.
A portfolio holding:
stock funds, bond funds, target-date funds, or other available investments
can produce different results.
Therefore:
401(k) Account ≠ Guaranteed 7% Investment
The 7% used here is purely illustrative.
Compound Growth
The compound interest effect becomes more powerful as the account grows.
Suppose an account has:
$500,000
and earns an illustrative 7% in one year.
Investment gain:
$500,000 × 7%
$35,000
That annual gain exceeds the contribution made by many participants.
However, a negative market year can also reduce the account balance.
Annualized Return
The annualized return measures investment growth across multiple years.
Suppose a 401(k) grows from:
$100,000 to $160,000
over five years with no additional contributions for this simplified illustration.
Annualized Return = ($160,000 ÷ $100,000)^(1/5) − 1
≈ 9.86%
Once contributions and withdrawals occur, a more sophisticated return method can be needed to separate investment performance from cash flows.
Average Return vs Compounded Return
The average return can be misleading when returns vary.
Suppose:
Year 1 = +20%
Year 2 = −20%
Arithmetic average:
0%
But:
$100 × 1.20 × 0.80
$96
Actual cumulative result:
−4%
Investment growth follows compounded returns, not the simple arithmetic average.
Asset Allocation
The asset allocation chosen within the plan influences risk and expected return.
Investor.gov explains that asset allocation should reflect time horizon and risk tolerance.
A participant 35 years from retirement can reasonably evaluate risk differently from someone who plans to start withdrawals soon.
Investment Fees
401(k) plans and the investments held inside them can charge fees.
Investor.gov notes that retirement-plan expenses can be passed to participants in addition to expenses charged by underlying investments.
Even small annual differences can compound over decades.
Expense Ratio Example
Suppose two investment options produce the same gross return before fees:
Fund A expense ratio = 0.10%
Fund B expense ratio = 1.00%
Difference:
0.90 Percentage Points per Year
If everything else were identical, more of the gross return remains invested in the lower-cost fund.
The expense ratio page owns the direct calculation, while expense ratios examines long-term compounding effects.
401(k) and Amortization
The workbook maps amortization as a nearby financial concept, but its intent remains distinct.
Amortization generally describes allocating or reducing a financial balance across time.
401(k) growth focuses on contributions and investment accumulation.
The account normally grows through investing rather than through a debt amortization schedule.
401(k) and Annuities
Some retirement strategies can later involve annuities or other lifetime-income products.
The 401(k) accumulation phase asks:
How Much Can the Account Grow?
The annuity phase can ask:
How Can Capital Be Converted Into Future Payments?
These are different calculations.
Annuity Due Connection
An annuity due assumes contributions or payments occur at the beginning of each period.
That mathematical structure can approximate contribution timing differently from an ordinary end-of-period contribution model.
Because real payroll contributions occur throughout the year, monthly modeling is usually more realistic than assuming one annual contribution on December 31.
IRA vs 401(k)
An IRA is another retirement account with its own contribution and tax rules.
The IRS sets different annual contribution limits for IRAs and 401(k)s.
For 2026, the IRS lists the IRA contribution limit at $7,500, compared with the $24,500 standard elective-deferral limit for most 401(k)s.
The two account types can coexist when the taxpayer meets the relevant rules.
Maximum Contribution Example
Suppose an employee under age 50 contributes the full 2026 elective-deferral limit:
$24,500
and receives:
$6,000 Employer Match
Total account addition:
$30,500
The employee has reached the individual elective-deferral limit but remains below the general $72,000 annual-additions limit.
Employer contributions do not simply reduce the $24,500 employee elective-deferral limit.
Age-50 Catch-Up Example
A participant age 55 in 2026 can potentially make:
Standard deferral:
$24,500
Catch-up:
$8,000
Total employee deferral:
$32,500
if the plan permits and other rules are satisfied.
Age 60–63 Catch-Up Example
A qualifying participant age 60, 61, 62, or 63 in 2026 can have the higher catch-up limit:
$11,250
Potential employee contribution:
$24,500 + $11,250
$35,750.
This special limit is age-specific and should not be applied to every participant age 50 or older.
Contribution Timing Matters
Suppose you contribute:
$15,000
on January 1 instead of December 31.
The money has almost an additional year to participate in investment returns.
That can create significant differences over decades.
Payroll-based contributions spread throughout the year sit between those two extremes.
Increasing Contributions Over Time
Suppose salary rises and the employee increases contributions from:
$10,000 annually to $12,000.
Additional annual investment:
$2,000
Over 25 years at an illustrative 7% return with monthly contributions, that extra $2,000 per year alone could accumulate to approximately:
$135,012
Again, the return is hypothetical, but the contribution effect is mathematical.
Vesting Matters
Employer contributions can be subject to the plan’s vesting schedule.
An account statement can show employer contribution balances that are not yet fully vested.
Therefore, a growth projection should use the portion the participant reasonably expects to retain under the plan’s actual terms when employment changes are relevant.
Traditional vs Roth Contributions
Traditional and Roth 401(k) contributions can have different tax treatment.
Their investment-growth mathematics can be identical if invested in the same assets.
The tax timing differs.
This article keeps its scope on 401(k) growth, contributions, and matching, rather than turning into a full tax-treatment comparison.
Common 401(k) Growth Mistakes
One mistake is projecting one fixed return every year as though it were guaranteed.
Another is ignoring employer match.
Participants also confuse the individual employee-deferral limit with the overall annual-additions limit.
A fourth mistake is ignoring investment and plan fees.
Finally, account growth should be modeled using realistic contribution timing rather than assuming every contribution arrives at the beginning of the year.
Frequently Asked Questions
What makes a 401(k) grow?
Employee contributions, employer contributions where applicable, and investment returns.
What is the 2026 employee 401(k) contribution limit?
$24,500 for most traditional and safe-harbor 401(k) plans.
What is the 2026 age-50 catch-up limit?
$8,000 under the general catch-up rule.
What is the 2026 catch-up for ages 60 through 63?
$11,250.
What is the 2026 overall annual-additions limit?
Generally the lesser of 100% of compensation or:
$72,000
before applicable catch-up contributions.
Does employer matching count against my $24,500 employee limit?
Employer match is part of the broader annual-additions calculation rather than the employee elective-deferral limit itself.
Is employer matching guaranteed?
No. Match formulas depend on the employer’s plan.
What does a 100% match on the first 5% mean?
Under that hypothetical formula, an employee contributing at least 5% of eligible compensation receives an employer contribution equal to 5%.
How much can $15,000 per year grow to over 25 years at 7%?
Using monthly contributions and a constant hypothetical 7% return:
≈ $1.01 Million
Is 7% guaranteed?
No.
Do 401(k) fees matter?
Yes. Plan and investment expenses reduce the amount left to compound.
Is a 401(k) the same as an IRA?
No. They are separate retirement-account structures with different rules and contribution limits.
Final Takeaway
401(k) growth is driven by:
Contributions + Employer Match + Compounding
In the worked example:
Salary = $100,000
Employee contribution = 10% = $10,000
Hypothetical employer match = $5,000
Total annual contribution = $15,000
At an illustrative 7% return with monthly contributions for 25 years:
Estimated Balance ≈ $1,012,590
Without the $5,000 annual match:
Estimated Balance ≈ $675,060
Difference:
≈ $337,530
For 2026, the standard employee elective-deferral limit is $24,500, with separate catch-up and overall annual-additions limits.
The strongest long-term 401(k) plan therefore pays attention to contribution rate, employer matching formula, investment return, asset allocation, fees, contribution limits, vesting, and time available for compounding.




