


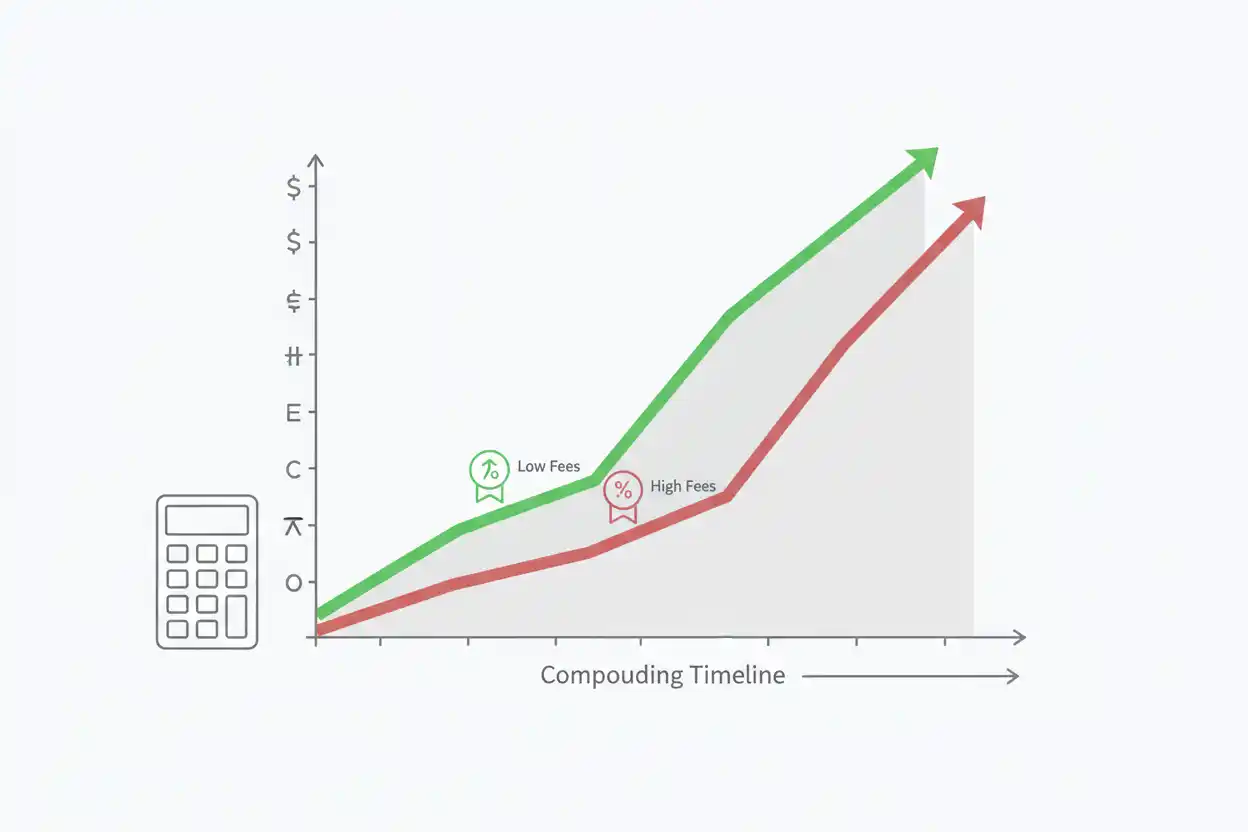
Expense ratios can look small when viewed as annual percentages, but their long-term impact can become substantial because investment costs interact with compounding.
A recurring fee affects wealth in two ways.
First, money leaves the investment through fund expenses.
Second, those dollars are no longer available to produce future investment growth.
Over a few months, the difference between a 0.10% and 1.00% expense ratio may seem modest. Over 20 or 30 years, the cumulative difference can become much larger.
Why Expense Ratios Compound Over Time
Suppose two investments produce the same hypothetical 7% annual gross return before fund expenses.
Fund A:
Expense Ratio = 0.10%
Simplified net return:
7.00% − 0.10% = 6.90%
Fund B:
Expense Ratio = 1.00%
Simplified net return:
7.00% − 1.00% = 6.00%
The difference is:
6.90% − 6.00% = 0.90 percentage points
That gap repeats each year and applies to an evolving account balance.
Long-Term Expense Ratio Formula
For a simplified comparison where gross returns and expense ratios remain constant:
Future Value After Fees = Starting Investment × (1 + Gross Return − Expense Ratio)^Years
This model isolates the compounding effect of recurring annual costs.
Actual fund returns and expenses do not occur as one annual subtraction in precisely this way, but the formula provides a useful illustration.
10-Year Expense Ratio Example
Suppose:
- starting investment = $100,000;
- gross return = 7%;
- Fund A expense ratio = 0.10%;
- Fund B expense ratio = 1.00%;
- no additional deposits or withdrawals.
Fund A
Simplified net return:
6.90%
Future value:
$100,000 × 1.069¹⁰
≈ $194,948
Fund B
Simplified net return:
6.00%
Future value:
$100,000 × 1.06¹⁰
≈ $179,085
Difference:
$194,948 − $179,085 ≈ $15,863
After 10 years, the lower-cost investment ends with roughly $15,863 more under these assumptions.
20-Year Impact
Continue the same assumptions.
Fund A at 6.90%
$100,000 × 1.069²⁰ ≈ $380,047
Fund B at 6.00%
$100,000 × 1.06²⁰ ≈ $320,714
Difference:
$380,047 − $320,714 ≈ $59,333
The gap grows from about $15,863 after 10 years to approximately $59,333 after 20 years.
30-Year Impact
Now extend the period to 30 years.
Fund A
$100,000 × 1.069³⁰ ≈ $740,910
Fund B
$100,000 × 1.06³⁰ ≈ $574,349
Difference:
$740,910 − $574,349 ≈ $166,561
The difference becomes approximately $166,561.
The annual fee gap was only 0.90 percentage points.
Compounding makes the long-term wealth difference much larger.
Why the Difference Accelerates
After the first year, higher fees reduce the balance slightly.
During the second year, that smaller balance produces less investment growth.
Then fees are again deducted from the resulting balance.
This creates a recurring interaction:
Higher Fees → Lower Balance → Less Future Growth → Increasing Wealth Gap
The process repeats every year.
Expense Ratio vs Expense Ratio Formula
The companion expense ratio page focuses on the definition and basic annual calculation for one fund.
For example:
Annual Cost ≈ Balance × Expense Ratio
This page focuses instead on what happens when those recurring costs remain in place for decades.
The distinction matters because annual dollar cost and long-term opportunity cost are not the same thing.
Comparing 0.05% and 0.25%
Even relatively small expense differences can matter with large balances.
Suppose:
- portfolio = $500,000;
- Fund A expense ratio = 0.05%;
- Fund B expense ratio = 0.25%.
Approximate first-year fund costs:
Fund A:
$500,000 × 0.0005 = $250
Fund B:
$500,000 × 0.0025 = $1,250
Difference:
$1,250 − $250 = $1,000
The first-year difference is about $1,000 at a constant balance.
Future differences depend on how the investments perform and how account values change.
Expense Ratios and Future Value
The mechanics are closely related to future value.
Future value asks what an amount could grow to under a compounding rate.
Expense ratios reduce the rate retained by the investor.
Suppose the pre-expense growth assumption is 8%.
With a 0.20% expense ratio:
Simplified Net Rate = 7.80%
With a 1.20% expense ratio:
Simplified Net Rate = 6.80%
A seemingly small difference in annual net growth can produce a large gap in future value over long periods.
Expense Ratios and Future Contributions
Many investors make recurring contributions.
Suppose someone contributes $500 per month for 30 years.
A higher expense ratio affects:
- the accumulated value of early contributions;
- the accumulated value of later contributions;
- reinvested gains;
- reinvested distributions.
Because early contributions remain invested longest, recurring fund costs can have a particularly large effect on those dollars.
The mathematics resembles the future value of annuity calculation.
Expense Ratios and FIRE
Expense control can matter for FIRE because financial independence plans often involve long accumulation and withdrawal periods.
Suppose two otherwise identical portfolios support the same spending goal.
A persistent annual cost difference reduces the net return available to compound during accumulation and can continue reducing returns after retirement.
This does not mean the lowest-cost portfolio is automatically optimal.
Risk, diversification, taxes, investment strategy, and portfolio construction still matter.
Expense Ratios and Emergency Funds
An emergency fund serves a liquidity purpose.
Long-term expense-ratio optimization applies primarily to invested capital.
Moving emergency cash into volatile funds simply to capture lower costs or higher expected returns can expose the household to losses when money is urgently needed.
Cost optimization should therefore happen after identifying what each pool of money is meant to accomplish.
Expense Ratios and Earnings Yield
An earnings yield describes underlying corporate earnings relative to stock prices.
A fund expense ratio describes the cost of holding a pooled investment product.
Even when a portfolio of companies has strong earnings, investors still experience whatever fund-level operating expenses apply.
The two percentages should therefore remain separate in analysis.
Expense Ratios With Negative Returns
Expenses matter even when investment returns are negative.
Suppose gross return is −10% and the expense ratio is 1%.
A simplified net result is:
−10% − 1% = −11%
The fee does not disappear because the market performed poorly.
This asymmetry is important: fund expenses are recurring costs, not performance fees that automatically vanish during losses.
Expense Ratios and Break-Even Performance
Suppose Fund A costs 0.10% and Fund B costs 0.80%.
If both portfolios are otherwise identical, Fund B needs approximately:
0.80% − 0.10% = 0.70 percentage points
of additional annual gross performance simply to offset its higher expense ratio in a simplified comparison.
If it does not generate that extra performance, its higher cost creates a performance disadvantage.
Expense Ratio Difference Formula
A useful starting comparison is:
Annual Expense Gap ≈ Portfolio Balance × (Higher Expense Ratio − Lower Expense Ratio)
Suppose:
- balance = $250,000;
- high expense = 0.80%;
- low expense = 0.20%.
Difference:
0.80% − 0.20% = 0.60%
Then:
Annual Expense Gap ≈ $250,000 × 0.006
Annual Expense Gap ≈ $1,500
This estimates the first-year difference at the stated balance.
It does not capture lost future growth.
The Opportunity Cost of Fees
Suppose $1,500 is lost to additional expenses this year.
If that $1,500 could otherwise have earned 6% for 20 years:
Future Value = $1,500 × 1.06²⁰
Future Value ≈ $4,811
A single year’s extra fee has a future opportunity cost larger than the fee itself.
When the expense difference repeats every year, that opportunity cost accumulates across many fee payments.
Expense Ratios and Inflation
Long-term investment outcomes also need to be interpreted after inflation.
If a portfolio earns 6% after fund expenses while inflation averages 3%, the rough real-growth relationship is lower than 6%.
Expense ratios reduce nominal returns before inflation further affects purchasing power.
That is one reason small recurring costs can matter for long-horizon goals.
Gross Return Assumptions Are Not Guaranteed
Long-term fee examples often use a fixed gross return to isolate the fee effect.
Real investment returns are not constant.
Markets can:
- rise;
- fall;
- remain flat;
- experience long periods of volatility.
The point of the model is not to forecast an exact ending balance.
It is to show that, when all else is equal, recurring costs reduce the amount available for compounding.
High Cost Does Not Automatically Mean Bad
Some higher-cost funds follow specialized strategies or provide exposures that cheaper alternatives do not.
The relevant question is not simply:
Which fund has the lowest expense ratio?
It is:
Does the investment provide enough value, exposure, or expected benefit to justify its additional cost?
That requires analysis beyond the fee percentage.
Low Cost Does Not Guarantee Better Performance
A low-cost fund can still perform poorly if its underlying investments perform poorly.
Likewise, a higher-cost strategy can outperform for a period.
Expense ratios are one of the few investment characteristics that are known with relatively high clarity compared with uncertain future returns, which is why they deserve attention.
But cost alone does not determine outcome.
Frequently Asked Questions
Why do expense ratios matter over long periods?
They reduce the balance available to compound, and the lost money also loses future growth potential.
How do you estimate future value after expenses?
A simplified formula is:
Future Value = Principal × (1 + Gross Return − Expense Ratio)^Years
Is a 1% expense ratio expensive over 30 years?
Its impact can be substantial because the cost repeats each year and reduces future compounding. The exact dollar effect depends on balance and investment returns.
Does a 0.10% difference matter?
It can, especially on large balances or over long periods.
Do fund fees matter when returns are negative?
Yes. Expenses still reduce fund assets even during periods of poor investment performance.
Is the lowest expense ratio always best?
No. Investment exposure, strategy, diversification, risk, taxes, and other costs still matter.
What is the difference between expense ratio and expense ratios?
The singular page focuses on calculating and interpreting one fund’s expense ratio. The plural topic focuses on comparing multiple fee levels and their long-term compounding impact.
How do expense ratios affect retirement planning?
They reduce net returns during accumulation and can continue affecting invested assets during retirement.
Can higher-cost funds outperform lower-cost funds?
Yes, but higher expenses create an additional hurdle that must be overcome through better gross performance or other benefits.
Do expense ratios include advisory fees?
Not necessarily. Advisory and account fees can be separate.
Why do early fees have a large long-term effect?
Money lost early has many years in which it would otherwise have been able to compound.
Where should expense ratios fit in investment decisions?
They should be evaluated alongside risk, diversification, asset allocation, taxes, and other factors within a broader Savings & Investing strategy.




