


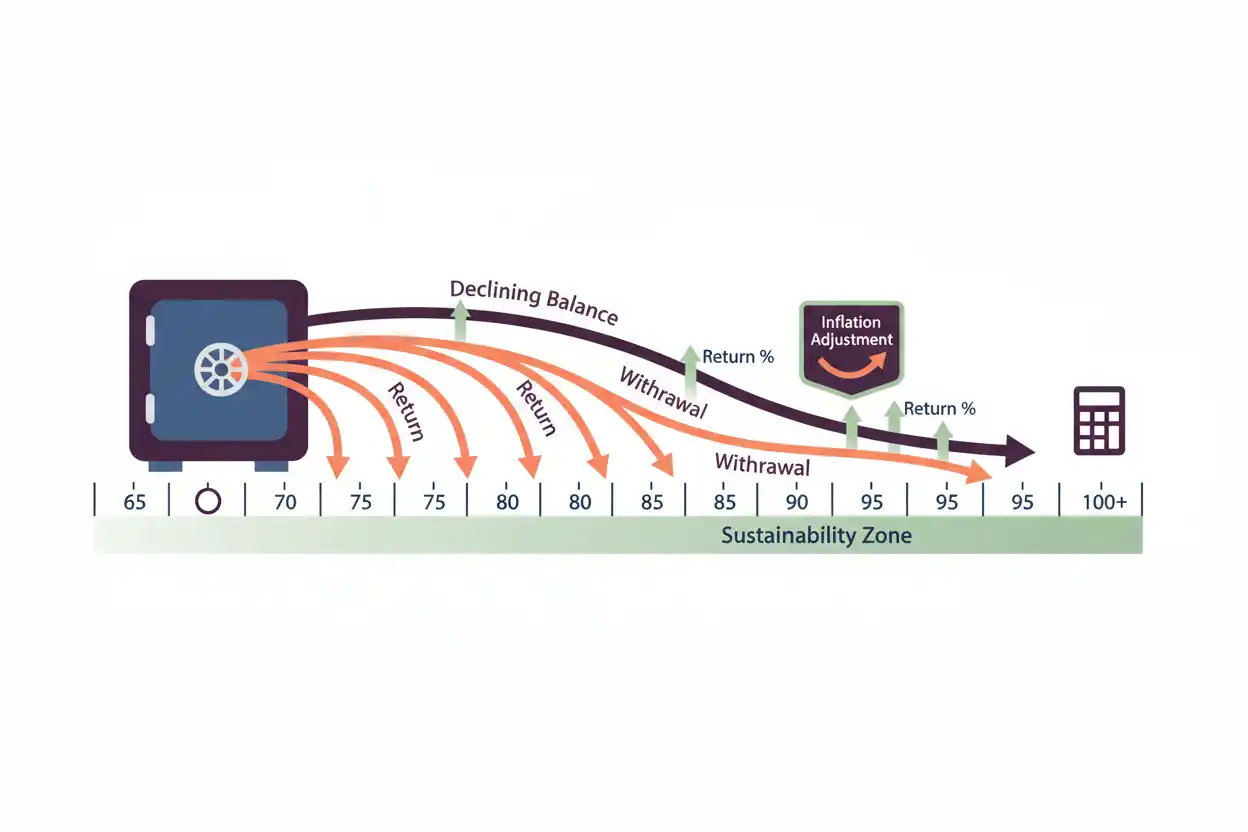
Retirement withdrawals determine how accumulated savings are converted into income after regular employment ends.
A $500,000 portfolio supporting $40,000 of annual withdrawals would last only 12.5 years if it earned no return and the withdrawal never changed.
If the same portfolio earned a constant 4% annual return while $40,000 was withdrawn at the end of each year, the mathematical lifespan increases to approximately 17.67 years.
Real retirement outcomes are less predictable because investment returns vary, inflation changes spending needs, taxes and fees reduce available wealth, and poor returns early in retirement can have a disproportionate effect.
What Are Retirement Withdrawals?
Retirement withdrawals are amounts removed from accumulated financial assets to pay retirement expenses.
They may come from:
- retirement accounts;
- taxable investment accounts;
- cash reserves;
- other accumulated savings.
The withdrawal amount should be analyzed together with pension income, other reliable income, spending needs, investment returns, inflation, and retirement duration.
A withdrawal plan is therefore a cash-flow strategy rather than simply a percentage chosen once.
Basic No-Growth Withdrawal Formula
If the portfolio earns no return and withdrawals remain constant:
Years Money Lasts = Starting Portfolio ÷ Annual Withdrawal
Suppose:
- starting portfolio = $500,000;
- annual withdrawal = $40,000.
Then:
Years = $500,000 ÷ $40,000
Years = 12.5
Without investment growth, the money lasts 12.5 years.
Monthly Version
If withdrawals are monthly:
Months Money Lasts = Starting Balance ÷ Monthly Withdrawal
For:
- balance = $500,000;
- monthly withdrawal = $4,000;
then:
$500,000 ÷ $4,000 = 125 months
Convert to years:
125 ÷ 12 ≈ 10.42 years
Again, this assumes zero investment return.
Retirement Withdrawals With Investment Growth
When the remaining portfolio earns a constant return and equal withdrawals occur at the end of each period, the balance can be modeled as:
Ending Balance After n Periods = PV(1 + r)^n − W × [((1 + r)^n − 1) ÷ r]
Where:
- PV = starting portfolio;
- r = return per period;
- W = withdrawal per period;
- n = number of periods.
This formula assumes a constant return and fixed withdrawal amount.
Example: $500,000 Portfolio at 4%
Suppose:
- portfolio = $500,000;
- annual withdrawal = $40,000;
- annual return = 4%;
- withdrawals occur at year-end.
After five years:
Balance = $500,000(1.04)^5 − $40,000 × [((1.04)^5 − 1) ÷ 0.04]
Balance ≈ $391,673.55
After 10 years:
Balance ≈ $259,877.86
After 15 years:
Balance ≈ $99,528.25
After 17 years:
Balance ≈ $26,049.75
The account is approaching depletion by year 18 under the constant-return assumptions.
Formula for How Long the Portfolio Lasts
When equal withdrawals exceed the interest generated by the starting portfolio, the number of periods can be estimated as:
n = −ln(1 − PV × r ÷ W) ÷ ln(1 + r)
Using:
- PV = $500,000;
- r = 4%;
- W = $40,000.
Then:
n = −ln(1 − ($500,000 × 0.04 ÷ $40,000)) ÷ ln(1.04)
n ≈ 17.67 years
The portfolio lasts approximately 17.67 years under the simplified model.
How Return Changes Longevity
Consider the same:
- $500,000 starting portfolio;
- $40,000 annual withdrawal.
At 0% return:
12.5 years
At 3%:
≈ 15.90 years
At 4%:
≈ 17.67 years
At 5%:
≈ 20.10 years
At 6%:
≈ 23.79 years
Higher returns extend the mathematical lifespan when every other assumption remains unchanged.
Actual investment returns do not occur as one stable percentage every year.
When Withdrawals Equal Portfolio Earnings
Suppose:
- portfolio = $500,000;
- return = 8%;
- withdrawal = $40,000.
Annual growth before withdrawal under a simplified constant-return model is:
$500,000 × 8% = $40,000
If the portfolio earns exactly 8% every year and $40,000 is withdrawn after that return is earned, the nominal starting balance can theoretically remain at $500,000 indefinitely.
That is a mathematical special case, not a realistic guarantee of perpetual retirement income.
Why Average Return Is Not Enough
Suppose two retirement portfolios both average 6% across several years.
Portfolio A earns strong returns early.
Portfolio B experiences large losses early and strong gains later.
Even if their average returns eventually match, the retiree withdrawing money every year can have very different ending balances.
This is called sequence-of-returns risk.
Sequence Risk Example
Suppose a $500,000 portfolio loses 20% before a $40,000 withdrawal.
After the loss:
$500,000 × 0.80 = $400,000
After withdrawal:
$400,000 − $40,000 = $360,000
The portfolio must now recover from a much smaller base.
If instead the portfolio gained 20% first:
$500,000 × 1.20 = $600,000
After the same withdrawal:
$600,000 − $40,000 = $560,000
The order of returns matters because withdrawals make losses and gains path-dependent.
Retirement Withdrawals and Retirement Savings
Retirement savings focuses on building the portfolio before retirement.
Retirement withdrawals reverse the cash-flow direction.
During accumulation:
Contributions → Portfolio
During retirement:
Portfolio → Spending
A strong retirement plan should model both stages rather than projecting a large final balance without determining how the money will actually support spending.
Retirement Withdrawals and Income Gap
The retirement income gap helps determine how much must come from savings.
Suppose:
- target retirement income = $70,000;
- pension and other income = $45,000.
Gap:
$70,000 − $45,000 = $25,000
If portfolio withdrawals only need to supply $25,000 rather than the full $70,000, retirement assets can last substantially longer.
Retirement Withdrawals and Replacement Ratio
A retirement replacement ratio can estimate target retirement income relative to pre-retirement income.
Suppose:
- working income = $100,000;
- target replacement ratio = 70%.
Target retirement income:
$100,000 × 70% = $70,000
If reliable retirement income covers $45,000, the remaining $25,000 can become the portfolio withdrawal target.
Inflation-Adjusted Withdrawals
A retiree may want withdrawals to rise with inflation.
Suppose the first annual withdrawal is:
$40,000
and inflation is 3%.
Year 2 withdrawal:
$40,000 × 1.03 = $41,200
Year 3:
$41,200 × 1.03 = $42,436
After 10 annual increases:
$40,000 × 1.03¹⁰ ≈ $53,756.66
Inflation-adjusted spending causes withdrawals to rise over time and can shorten portfolio longevity relative to a fixed nominal withdrawal.
Fixed Withdrawals vs Inflation-Adjusted Withdrawals
A fixed $40,000 annual withdrawal becomes easier for the portfolio to support if nominal investment values and income rise over time.
But its purchasing power declines during inflation.
An inflation-adjusted withdrawal attempts to preserve spending power but puts increasing demands on the portfolio.
The tradeoff is:
Fixed nominal withdrawal: easier mathematically for the portfolio, weaker purchasing-power protection.
Inflation-adjusted withdrawal: stronger purchasing-power target, higher long-term portfolio demand.
Percentage-Based Withdrawals
Another approach is withdrawing a percentage of the current portfolio each year.
Suppose:
Withdrawal Rate = 4% of Current Balance
At $500,000:
Withdrawal = $20,000
If the portfolio later falls to $400,000:
Withdrawal = $16,000
This approach naturally reduces the chance of completely depleting the portfolio because withdrawals fall with asset values.
However, retirement income becomes less predictable.
Fixed-Dollar vs Percentage Withdrawals
A fixed-dollar strategy prioritizes predictable spending.
A percentage-of-balance strategy prioritizes flexibility.
Neither is universally superior.
The appropriate method depends on:
- essential spending;
- guaranteed income;
- portfolio size;
- risk tolerance;
- desired legacy;
- retirement duration.
Risk-Adjusted Return and Withdrawals
A high average return does not necessarily produce a strong retirement experience if achieving it requires severe volatility.
Risk-adjusted return compares performance with the risk used to produce that performance.
For a retiree making ongoing withdrawals, avoiding destructive losses can matter alongside maximizing average return.
Risk-Reward Ratio vs Retirement Planning
The risk-reward ratio is primarily a trading decision tool comparing potential loss with potential gain on a defined trade.
It is not a retirement-withdrawal formula.
Retirement planning requires portfolio-level analysis across decades rather than one trade’s stop-loss and target.
The two concepts should remain separate.
Required Withdrawals vs Planned Withdrawals
Some retirement accounts can be subject to legally required distributions.
Those minimum distributions do not necessarily match the retiree’s preferred withdrawal strategy.
For example:
- planned spending withdrawal = $25,000;
- required account distribution = $30,000.
The retiree may be required to distribute $30,000 even if only $25,000 is needed for spending.
Unused distributed funds do not necessarily need to be consumed.
Taxes and Retirement Withdrawals
A gross withdrawal is not always equal to spendable cash.
Suppose:
Gross Withdrawal = $50,000
and $8,000 is ultimately required for taxes.
Net cash:
$50,000 − $8,000 = $42,000
If the spending target is $50,000 after tax, the gross withdrawal may need to be larger.
Tax treatment depends on account type and individual circumstances.
Fees Also Affect Longevity
Suppose a portfolio earns:
6% before investment costs
but ongoing costs reduce net return to:
5.25%
A retirement model using the full 6% while ignoring fees will overstate how long money may last.
Withdrawal calculations should use assumptions consistent with the return the investor actually expects to retain.
Large One-Time Withdrawals
Suppose a retiree with $500,000 withdraws an extra $50,000 for a major expense.
New portfolio:
$500,000 − $50,000 = $450,000
If annual spending withdrawals remain unchanged, the withdrawal rate on the remaining portfolio increases.
Before:
$40,000 ÷ $500,000 = 8%
After:
$40,000 ÷ $450,000 ≈ 8.89%
One-time expenses can therefore materially alter retirement sustainability.
Reducing Withdrawals After a Market Decline
Flexible spending can help preserve assets after poor investment years.
Suppose planned withdrawal is $40,000 but is reduced to $35,000 after a severe decline.
Difference:
$5,000
That $5,000 remains invested and may participate in future recovery.
The practical ability to reduce spending depends on how much of the retirement budget is discretionary.
Essential vs Discretionary Spending
A useful retirement budget can separate:
Essential spending: housing, food, healthcare, insurance, basic transportation.
Discretionary spending: travel, gifts, entertainment, optional purchases.
When markets are weak, discretionary spending may provide more flexibility than essential expenses.
This can make a withdrawal strategy more resilient.
Longevity Risk
A withdrawal plan must account for uncertainty about retirement duration.
A strategy designed to last exactly 20 years can fail if retirement lasts 30 years.
Conversely, withdrawing too conservatively can leave more unspent wealth than intended.
There is no single retirement horizon that fits everyone.
Common Retirement Withdrawal Mistakes
One mistake is dividing savings by annual spending and ignoring investment returns entirely.
The opposite mistake is assuming one constant high investment return will occur every year.
People can also ignore inflation, taxes, fees, or sequence risk.
A further mistake is using a trading risk-reward rule as though it were a retirement sustainability model.
Frequently Asked Questions
How do I calculate how long retirement money lasts with no growth?
Years = Starting Portfolio ÷ Annual Withdrawal
How long does $500,000 last at $40,000 per year with no return?
$500,000 ÷ $40,000 = 12.5 years
How long does it last at a constant 4% return?
Approximately 17.67 years with $40,000 end-of-year withdrawals under the simplified constant-return model.
Why does investment return extend portfolio life?
The remaining balance generates growth that helps offset withdrawals.
Does average return determine retirement success?
No. The sequence in which gains and losses occur can materially change results.
What is sequence-of-returns risk?
It is the risk that poor returns occur early while withdrawals are simultaneously reducing portfolio assets.
Should withdrawals rise with inflation?
That depends on the spending objective. Inflation-adjusted withdrawals preserve more purchasing power but place larger future demands on the portfolio.
Is a fixed percentage withdrawal safer than a fixed dollar amount?
It reduces withdrawals when the portfolio declines but makes retirement income less predictable.
Should taxes be included?
Yes. Gross account withdrawals and net spendable income can differ materially.
Can I withdraw more after strong market years?
A flexible strategy may do so, but increasing spending can permanently raise the portfolio’s future burden.
Does a required retirement-account distribution tell me what I should spend?
No. Mandatory distributions and sustainable spending are separate concepts.
Why model retirement withdrawals?
They determine whether accumulated assets can support the income gap for the desired retirement horizon within the broader Savings & Investing plan.




