


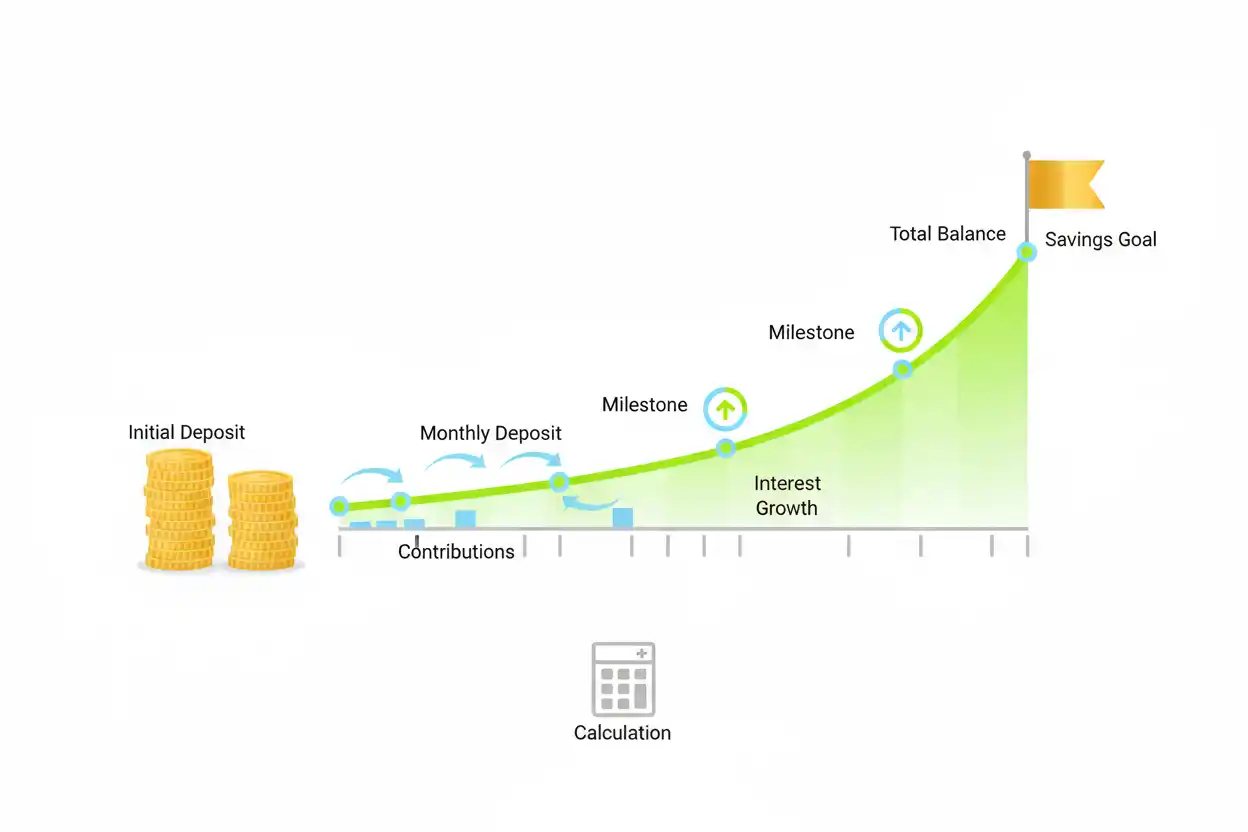
Savings growth comes from three main components: the amount already saved, new deposits, and the return or interest earned over time.
Suppose you begin with $10,000, deposit $500 at the end of every month, and earn a hypothetical 5% nominal annual rate compounded monthly for 10 years.
The original $10,000 grows to approximately $16,470.09.
The recurring deposits grow to approximately $77,641.14.
Together, the savings balance reaches approximately $94,111.23.
Understanding those components makes it easier to see whether progress depends primarily on saving more, earning a higher rate, or allowing more time for compounding.
What Is Savings Growth?
Savings growth is the increase in a savings or investment balance through:
- starting capital;
- additional deposits;
- earned interest or returns;
- compounding.
A simplified relationship is:
Ending Savings = Starting Savings + Deposits + Growth − Withdrawals
When the rate and deposits are regular, future-value formulas can model the balance more precisely.
Growth of an Existing Balance
For a lump sum:
Future Value = Present Balance × (1 + r)^n
Where:
- r = rate per compounding period;
- n = number of compounding periods.
Suppose:
- balance = $10,000;
- nominal annual rate = 5%;
- monthly compounding;
- time = 10 years.
Monthly rate:
r = 0.05 ÷ 12
≈ 0.00416667
Periods:
n = 10 × 12
n = 120
Then:
FV = $10,000 × (1 + 0.05 ÷ 12)^120
FV ≈ $16,470.09
Growth of Monthly Deposits
If $500 is added at the end of every month:
FV of Deposits = PMT × [((1 + r)^n − 1) ÷ r]
Insert:
FV = $500 × [((1 + 0.05 ÷ 12)^120 − 1) ÷ (0.05 ÷ 12)]
FV ≈ $77,641.14
Total monthly deposits were:
$500 × 120 = $60,000
Growth associated with those deposits:
$77,641.14 − $60,000
≈ $17,641.14
Combined Savings Growth
Add the two components:
Existing Balance FV = $16,470.09
Deposit FV = $77,641.14
Therefore:
Total Savings ≈ $94,111.23
Total cash contributed:
$10,000 + $60,000 = $70,000
Modeled growth:
$94,111.23 − $70,000
≈ $24,111.23
Why Deposits Matter So Much
Suppose the initial $10,000 were left alone for the same 10 years at 5%.
Ending value:
≈ $16,470
With the $500 monthly deposits:
≈ $94,111
Difference:
≈ $77,641
The contribution schedule has a much larger impact than the original balance in this example.
This is common during the early stages of saving.
Savings Rate and Savings Growth
Your savings rate determines how much of available income is regularly directed toward saving.
Suppose someone takes home $6,000 monthly.
At a 10% savings rate:
Monthly Savings = $600
At 20%:
= $1,200
At 30%:
= $1,800
A higher savings rate increases the recurring cash flow feeding the growth formula.
Annual Deposit Example
Suppose:
- annual contribution = $6,000;
- annual return = 5%;
- time = 10 years;
- deposits occur at year-end.
FV = $6,000 × [(1.05)^10 − 1] ÷ 0.05
FV ≈ $75,467.36
Total contributions:
$6,000 × 10 = $60,000
Growth:
$75,467.36 − $60,000
≈ $15,467.36
Beginning-of-Period Deposits
If deposits occur at the beginning of each period, each deposit receives one additional compounding period.
For monthly contributions:
Beginning-of-Period FV = End-of-Period FV × (1 + Monthly Rate)
Using the $500 monthly example:
FV ≈ $77,641.14 × 1.00416667
≈ $77,964.64
Difference:
≈ $323.50
Earlier deposits create more growth.
How the Interest Rate Changes Savings Growth
Suppose $10,000 is invested for 10 years with no additional deposits.
At 3%:
$10,000 × 1.03¹⁰ ≈ $13,439.16
At 5%:
≈ $16,288.95 if compounded annually
At 7%:
$10,000 × 1.07¹⁰ ≈ $19,671.51
Higher returns create greater growth, but seeking higher returns can also involve greater uncertainty.
Savings planning should not assume that a desired rate will automatically be achieved.
How Time Changes Savings Growth
Suppose $10,000 compounds annually at 5%.
After 5 years:
$10,000 × 1.05⁵ ≈ $12,762.82
After 10 years:
≈ $16,288.95
After 20 years:
≈ $26,532.98
After 30 years:
≈ $43,219.42
Compounding has more time to build on prior growth as the horizon increases.
Rule of 72 and Savings Growth
The Rule of 72 gives quick intuition about doubling time.
At 6%:
72 ÷ 6 = 12 years
That estimate applies to an existing amount growing at a fixed rate.
Savings growth often involves recurring deposits, so the complete ending balance should still be calculated with cash-flow formulas.
Rule of 69 and Savings Growth
The Rule of 69 estimates doubling time under continuous compounding.
It is useful for understanding compounding mathematically, but ordinary bank accounts and investment portfolios may use different crediting or valuation conventions.
The specific rate convention should match the savings calculation.
Savings Growth and Safe Withdrawal Rate
Accumulation eventually becomes spending for many retirement savers.
A larger balance can support a given dollar withdrawal at a lower safe withdrawal rate.
For example:
A $30,000 first-year withdrawal from $500,000 equals:
6%
The same $30,000 from $1 million equals:
3%
Growing savings before retirement can therefore reduce the withdrawal burden later.
Savings Growth and Sequence of Returns Risk
During accumulation, sequence of returns risk behaves differently than during retirement.
When a saver is still making contributions, market declines can allow new deposits to purchase assets at lower prices.
Once withdrawals begin, the same decline can be more damaging because money is leaving the portfolio.
Savings growth should therefore be analyzed differently in accumulation and withdrawal phases.
Savings Growth With Changing Rates
Suppose annual returns are:
- 8%;
- −4%;
- 10%;
- 5%.
For an existing $10,000 balance:
Ending Value = $10,000 × 1.08 × 0.96 × 1.10 × 1.05
≈ $11,975.04
A constant-rate formula should not be used as though the account actually earned one identical percentage each year.
Simple Interest vs Compound Growth
Savings accounts or financial arrangements using simple interest do not earn interest on prior interest in the same way.
At 5% simple interest on $10,000 for 10 years:
Interest = $10,000 × 5% × 10
= $5,000
Ending amount:
$15,000
At 5% annual compound growth:
$10,000 × 1.05¹⁰
≈ $16,288.95
Compounding creates approximately $1,288.95 more growth in this example.
Withdrawals Reduce Future Growth
Suppose $5,000 is removed from savings that could otherwise remain invested at 5% for 10 years.
Future value of that $5,000:
$5,000 × 1.05¹⁰
≈ $8,144.47
The immediate withdrawal is $5,000, but its potential long-term opportunity cost is larger.
Increasing Deposits Over Time
Suppose contributions start at $500 monthly but rise as income increases.
The standard equal-payment annuity formula no longer precisely describes the entire schedule.
Instead, the deposits can be modeled:
- year by year;
- month by month;
- as a growing annuity where appropriate.
Using realistic contribution growth can improve long-term projections.
Missing Deposits
If planned contributions are skipped, actual savings growth will be lower than a model assuming perfect consistency.
Suppose $500 monthly is planned but four deposits are missed:
Missed Contributions = $500 × 4
= $2,000
The eventual impact exceeds $2,000 because the missed deposits also lose future growth.
Savings Growth and Inflation
A balance can grow while purchasing power grows more slowly.
Suppose nominal savings growth is 5% while inflation is 3%.
Exact real growth:
1.05 ÷ 1.03 − 1
≈ 1.94%
The account is growing 5% in nominal terms but only about 1.94% in purchasing-power terms.
Rate Assumptions Should Match Risk
A guaranteed deposit rate and an expected market return are not equivalent assumptions.
A savings projection using a higher expected investment return should acknowledge that actual values can fluctuate.
Increasing a spreadsheet’s assumed return from 4% to 10% makes the projected ending balance larger, but it does not make the higher rate more achievable.
Common Savings Growth Mistakes
One mistake is adding contributions to the initial balance and pretending every dollar was invested from the beginning.
Another is mixing annual rates with monthly periods.
People may also ignore contribution timing, inflation, fees, or withdrawals.
A further mistake is assuming a desired return instead of using a realistic rate consistent with the asset being modeled.
Frequently Asked Questions
What determines savings growth?
Starting balance, recurring deposits, rate of return or interest, time, withdrawals, and costs all affect the result.
What is the lump-sum growth formula?
FV = PV × (1 + r)^n
How do I calculate growth of regular deposits?
For equal end-of-period deposits:
FV = PMT × [((1 + r)^n − 1) ÷ r]
How much does $500 per month grow to at 5% for 10 years?
Approximately $77,641 for end-of-month deposits under a 5% nominal annual rate compounded monthly.
Does depositing at the beginning of each month help?
Yes. Each deposit receives one additional period of growth.
Is savings growth the same as savings rate?
No. Savings rate measures how much income is saved; savings growth measures how the accumulated balance changes.
Why does time matter?
Earlier money receives more compounding periods.
Does a higher rate always mean a better savings choice?
Not necessarily. Higher expected returns can involve greater investment risk.
Does Rule of 72 calculate recurring savings?
No. It estimates doubling time for an existing amount at a fixed rate.
How do withdrawals affect savings growth?
They reduce current assets and remove the future growth those assets could otherwise generate.
Should savings projections include inflation?
Yes when purchasing power matters.
Why model savings growth?
It connects today’s deposit behavior with future financial goals within the broader Savings & Investing plan.




