


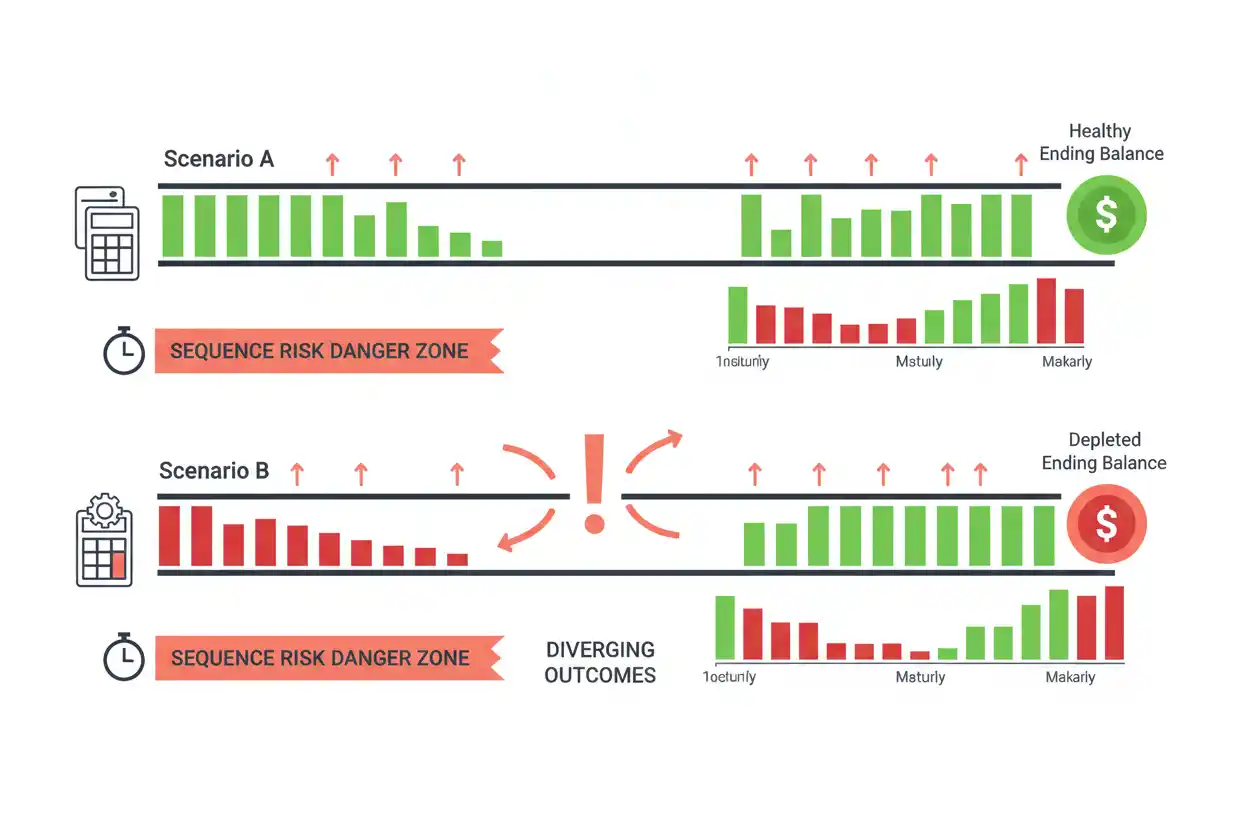
Sequence of returns risk is the risk that the order of investment gains and losses changes a portfolio’s outcome when money is being added or withdrawn.
If there are no cash flows, a set of annual percentage returns produces the same final value regardless of order because multiplication is commutative.
Once withdrawals begin, that is no longer true.
For example, two $500,000 retirement portfolios can experience exactly the same six annual returns in opposite order. With no withdrawals, both finish at approximately $474,012. With $40,000 withdrawn after each year’s return, one finishes at approximately $285,523 while the other finishes at only $177,703.
The returns are identical. The sequence is different.
What Is Sequence of Returns Risk?
Sequence of returns risk describes the interaction between:
- investment returns;
- cash-flow timing.
It is especially important during retirement because the investor is regularly removing money.
When a portfolio suffers losses early in retirement, withdrawals remove additional assets from a reduced balance.
Fewer assets remain available to participate in a later recovery.
Why Order Does Not Matter Without Cash Flows
Consider a $500,000 portfolio with these annual returns:
- +20%;
- +10%;
- +5%;
- −5%;
- −10%;
- −20%.
Without deposits or withdrawals:
Ending Value = $500,000 × 1.20 × 1.10 × 1.05 × 0.95 × 0.90 × 0.80
Ending Value = $474,012
Now reverse the returns:
- −20%;
- −10%;
- −5%;
- +5%;
- +10%;
- +20%.
The multiplication contains the same factors:
$500,000 × 0.80 × 0.90 × 0.95 × 1.05 × 1.10 × 1.20
= $474,012
The final value is identical.
Add $40,000 Annual Withdrawals
Now suppose $40,000 is withdrawn at the end of each year.
The portfolio update becomes:
Ending Balanceₜ = Beginning Balanceₜ × (1 + Returnₜ) − Withdrawalₜ
The subtraction after each return changes the amount of capital exposed to later returns.
That makes sequence matter.
Scenario A: Positive Returns First
Start with:
$500,000
Year 1: +20%
Before withdrawal:
$500,000 × 1.20 = $600,000
After $40,000 withdrawal:
$560,000
Year 2: +10%
$560,000 × 1.10 − $40,000
= $576,000
Year 3: +5%
$576,000 × 1.05 − $40,000
= $564,800
Year 4: −5%
$564,800 × 0.95 − $40,000
= $496,560
Year 5: −10%
$496,560 × 0.90 − $40,000
= $406,904
Year 6: −20%
$406,904 × 0.80 − $40,000
= $285,523.20
Ending portfolio:
$285,523.20
Scenario B: Negative Returns First
Use the same returns in reverse order.
Start:
$500,000
Year 1: −20%
$500,000 × 0.80 − $40,000
= $360,000
Year 2: −10%
$360,000 × 0.90 − $40,000
= $284,000
Year 3: −5%
$284,000 × 0.95 − $40,000
= $229,800
Year 4: +5%
$229,800 × 1.05 − $40,000
= $201,290
Year 5: +10%
$201,290 × 1.10 − $40,000
= $181,419
Year 6: +20%
$181,419 × 1.20 − $40,000
= $177,702.80
Ending portfolio:
$177,702.80
Compare the Outcomes
Scenario A ending balance:
$285,523.20
Scenario B ending balance:
$177,702.80
Difference:
$285,523.20 − $177,702.80
= $107,820.40
Both retirees received:
$40,000 × 6 = $240,000
of withdrawals.
Both portfolios experienced exactly the same set of investment returns.
Yet the order of those returns created a $107,820.40 difference in ending wealth.
Why the Early Losses Hurt More
In Scenario B, the first 20% loss reduced $500,000 to $400,000.
Then the retiree withdrew $40,000:
$400,000 − $40,000 = $360,000
The next year’s −10% return therefore affected a much smaller base.
By the time the strong positive returns arrived, substantially less capital remained.
The later 20% gain applied to only $181,419 before the final withdrawal—not the original $500,000.
The Formula Behind Sequence Risk
For a portfolio with withdrawals:
Bₜ = Bₜ₋₁(1 + rₜ) − Wₜ
Where:
- Bₜ = ending balance;
- rₜ = period return;
- Wₜ = withdrawal.
Because a subtraction occurs after each return, rearranging the sequence of rₜ values changes later balances.
That is the mathematical core of sequence of returns risk.
Sequence Risk and Safe Withdrawal Rate
A safe withdrawal rate tries to account for the possibility that retirement returns will not arrive in a favorable order.
A withdrawal percentage that appears sustainable using one smooth average return can fail after severe early losses.
This is why retirement planning should not use:
Average Return − Withdrawal Rate
as though the difference automatically predicts portfolio growth.
Sequence Risk and Savings Growth
During savings growth, cash flows usually move into the portfolio.
That changes the effect of a poor sequence.
A market decline early in the accumulation period can allow future contributions to purchase assets at lower prices.
For someone withdrawing money, the same decline can be harmful because assets are being sold or distributed from a depressed portfolio.
Sequence Risk and Savings Rate
A strong savings rate during accumulation can reduce dependence on investment performance alone.
Suppose a saver continues contributing substantially during market declines.
Those contributions increase the number of assets purchased at lower prices.
By contrast, a retiree has no equivalent stream of new savings unless employment or other income continues.
Accumulation Sequence Example
Suppose a young saver has a relatively small portfolio but contributes $20,000 annually.
A 20% decline can be uncomfortable, but future $20,000 contributions are being invested after prices have fallen.
If the market later recovers, those newly purchased assets can participate in the rebound.
Sequence risk therefore tends to become more dangerous near and after the point when cash flows switch from positive contributions to withdrawals.
Sequence Risk Around Retirement Date
The years immediately before and after retirement can be particularly important.
Suppose someone retires immediately before a severe market decline.
The household begins withdrawals at the same time asset values fall.
Another person with the same long-term average return but retiring several years earlier or later can experience a materially different financial outcome.
Sequence Risk and Simple Interest
Simple interest calculations do not capture sequence risk because the growth is based on the original principal rather than volatile market returns applied through time.
Sequence of returns risk is primarily relevant when values fluctuate and cash flows occur during the sequence.
A fixed contractual interest calculation has a different risk structure.
Sequence Risk and Sharpe Ratio
The Sharpe ratio evaluates excess return relative to volatility.
A portfolio with a stronger Sharpe ratio may have historically delivered more return per unit of volatility.
However, Sharpe ratio still does not directly show whether severe losses occur during the first years of a particular retiree’s withdrawal period.
Risk-adjusted performance and sequence risk provide different information.
Average Return Can Hide Sequence Risk
Suppose a retirement projection assumes:
Average Annual Return = 6%
and:
Withdrawal Rate = 4%
It may be tempting to conclude:
Portfolio Net Growth ≈ 2%
But real returns might arrive as:
- −25%;
- +18%;
- +12%;
- −5%;
- +15%;
- +21%.
The timing of withdrawals within that path changes the final result.
Average return alone does not capture it.
Arithmetic Average vs Compound Return
Returns of +20% and −20% have an arithmetic average of:
(+20% − 20%) ÷ 2 = 0%
But $100 experiences:
$100 × 1.20 = $120
then:
$120 × 0.80 = $96
Compound result:
−4%
Even before withdrawals are introduced, arithmetic average can misrepresent actual compound wealth growth.
Cash Reserves and Sequence Risk
One possible retirement-planning technique is holding enough liquid assets to cover some near-term spending without selling volatile assets after a severe market decline.
For example, if annual portfolio-supported spending is $30,000, a dedicated liquid reserve can provide temporary flexibility.
However, holding more cash can also reduce long-term expected return.
The appropriate balance depends on the broader portfolio and income plan.
Flexible Spending
A retiree may also reduce discretionary withdrawals after poor market performance.
Suppose the planned annual withdrawal is:
$50,000
After a severe decline, discretionary spending is reduced by $8,000:
Revised Withdrawal = $42,000
The $8,000 retained in the portfolio can remain available for future recovery.
Flexible spending does not eliminate sequence risk, but it can reduce the damage.
Reliable Income Can Reduce Exposure
Suppose:
- retirement spending = $70,000;
- pension and other reliable income = $50,000.
Portfolio withdrawal need:
$20,000
A retiree whose portfolio funds only $20,000 of spending is less exposed to withdrawal-driven sequence risk than someone relying on the portfolio for the full $70,000, all else equal.
Lower Initial Withdrawal Burden
Suppose two retirees each have $1 million.
Retiree A withdraws:
$30,000 = 3%
Retiree B withdraws:
$60,000 = 6%
A severe early decline creates more pressure on Retiree B because a larger share of the reduced portfolio must continue funding spending.
Withdrawal rate and sequence risk therefore interact.
Bond and Stock Sequences
Diversification can reduce reliance on a single return source.
However, multiple asset classes can sometimes decline together.
Sequence-risk planning should not assume that one asset will always rise whenever another falls.
Historical correlations can change during stressed markets.
Inflation Can Compound the Problem
Suppose the portfolio declines while inflation raises spending needs.
A retiree may face:
Lower Portfolio Value + Higher Required Withdrawal
at the same time.
This combination can increase the effective withdrawal rate quickly.
Sequence risk should therefore be evaluated alongside inflation, not only nominal market returns.
Fees Increase the Withdrawal Burden
Investment expenses reduce the returns retained by the portfolio.
If gross return is 6% but net return is 5%, the lower net figure should be used when evaluating sequence outcomes.
Ignoring recurring costs can make a retirement simulation appear more resilient than the actual portfolio.
Sequence Risk Is Not Fully Diversifiable
Diversification can reduce some volatility, but no portfolio can guarantee that major losses will not occur near retirement.
Sequence risk can be managed rather than eliminated.
Possible planning levers include:
- lower initial withdrawals;
- flexible spending;
- income floors;
- cash reserves;
- suitable asset allocation;
- delaying retirement;
- continuing partial income.
Sequence Risk After Portfolio Recovery
If a retiree survives the early vulnerable period with a strong remaining portfolio, sequence risk can become less acute relative to the original plan.
However, a later severe decline can still matter.
The risk does not disappear; its severity changes with:
- remaining assets;
- withdrawal burden;
- age;
- other income;
- spending flexibility.
Common Sequence of Returns Risk Mistakes
One mistake is assuming the same average return always produces the same retirement outcome.
Another is modeling withdrawals using a smooth annual rate every year.
People can also ignore inflation or assume diversification eliminates severe drawdowns.
A further mistake is applying accumulation-period intuition to retirement, even though contributions and withdrawals create opposite cash-flow effects.
Frequently Asked Questions
What is sequence of returns risk?
It is the risk that the order of investment gains and losses materially changes outcomes when cash flows occur.
Why does return order not matter without withdrawals?
Without cash flows, the same multiplicative return factors produce the same ending value regardless of order.
Why does order matter with withdrawals?
Each withdrawal changes the amount of capital exposed to later returns.
Is sequence risk most important in retirement?
It is especially important around and during retirement because withdrawals are regularly leaving the portfolio.
Can two portfolios with the same average return have different outcomes?
Yes, especially when contributions or withdrawals occur during the return sequence.
Why are early retirement losses dangerous?
Withdrawals taken after losses leave less capital available for future recovery.
Is sequence risk the same as volatility?
No. Volatility measures variability; sequence risk concerns the timing of that variability relative to cash flows.
Can cash reserves help?
They can provide flexibility to avoid selling some volatile assets during poor markets, although holding cash has its own opportunity cost.
Can flexible spending help?
Potentially. Temporarily reducing discretionary withdrawals after poor returns can preserve more capital.
Does a lower withdrawal rate reduce sequence risk?
Generally, it reduces the pressure placed on the portfolio, although it cannot eliminate market risk.
Does sequence risk matter while saving?
Yes, but the effect differs because recurring contributions can benefit from lower prices during market declines.
Why model sequence risk?
It reveals a major limitation of smooth average-return retirement projections within the broader Savings & Investing framework.




