


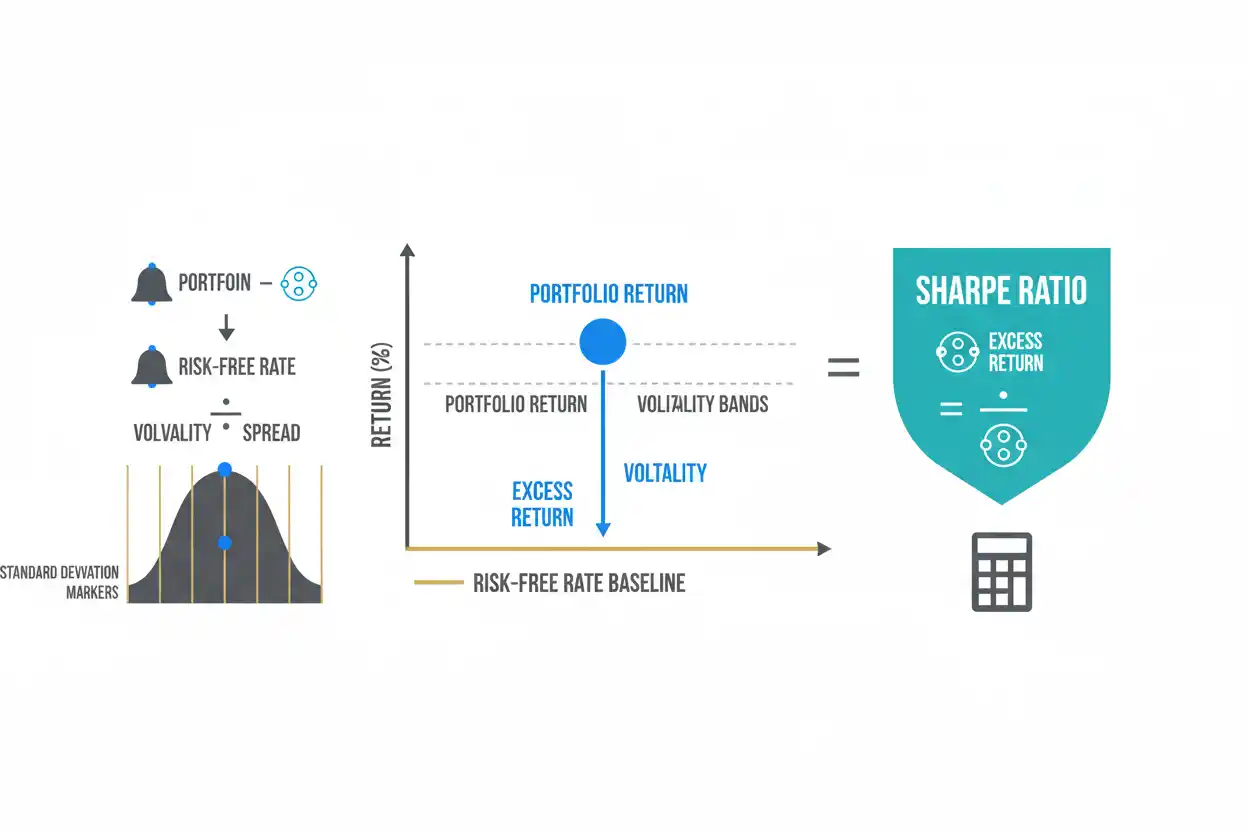
The Sharpe ratio measures how much excess investment return a portfolio generated relative to its volatility.
A portfolio earning 10% with a 4% risk-free rate and 12% standard deviation has a Sharpe ratio of 0.50.
Another portfolio earning only 8% but with 6% volatility produces a Sharpe ratio of approximately 0.67 under the same 4% risk-free assumption.
The second portfolio earned less in absolute terms, but it generated more excess return per unit of measured volatility.
What Is the Sharpe Ratio?
The Sharpe ratio compares three variables:
- portfolio return;
- risk-free rate;
- volatility.
Its purpose is to answer:
How much return above the risk-free benchmark did the investment produce for each unit of total return variability?
The formula uses standard deviation as the risk measure.
That means both positive and negative deviations contribute to measured volatility.
Sharpe Ratio Formula
Sharpe Ratio = (Portfolio Return − Risk-Free Rate) ÷ Standard Deviation of Portfolio Returns
Using symbols:
Sharpe Ratio = (Rₚ − Rf) ÷ σₚ
Where:
- Rₚ = portfolio return;
- Rf = risk-free rate;
- σₚ = portfolio return standard deviation.
The return, risk-free rate, and volatility should use consistent periods.
Sharpe Ratio Example
Suppose:
- portfolio return = 10%;
- risk-free rate = 4%;
- portfolio volatility = 12%.
First calculate excess return:
Excess Return = 10% − 4%
Excess Return = 6%
Then:
Sharpe Ratio = 6% ÷ 12%
Sharpe Ratio = 0.50
The portfolio generated 0.50 units of excess return for each unit of measured volatility.
Compare Two Portfolios
Now compare:
Portfolio A
- return = 10%;
- volatility = 12%;
- risk-free rate = 4%.
Sharpe A = (10% − 4%) ÷ 12%
Sharpe A = 0.50
Portfolio B
- return = 8%;
- volatility = 6%;
- risk-free rate = 4%.
Sharpe B = (8% − 4%) ÷ 6%
Sharpe B ≈ 0.67
Portfolio B has the higher Sharpe ratio despite earning a lower raw return.
Under this metric, B used volatility more efficiently.
Why Excess Return Is Used
Suppose an investment earns:
7%
while a low-risk reference return is:
5%
The investor received only:
7% − 5% = 2%
of additional return for accepting the investment’s volatility.
Sharpe ratio evaluates that incremental return, not the entire 7%.
If relatively low-risk alternatives already provide substantial returns, a risky portfolio needs to earn more to maintain the same Sharpe ratio.
What Does a Higher Sharpe Ratio Mean?
All else equal:
Higher Sharpe Ratio = More Excess Return per Unit of Volatility
A portfolio can raise its Sharpe ratio by:
- earning a higher return;
- reducing volatility;
- some combination of both.
However, there is no universal Sharpe threshold that makes an investment automatically attractive.
The appropriate interpretation depends on the asset class, period, methodology, and comparison set.
Negative Sharpe Ratio
Suppose:
- portfolio return = 2%;
- risk-free rate = 4%;
- volatility = 10%.
Then:
Sharpe Ratio = (2% − 4%) ÷ 10%
Sharpe Ratio = −0.20
The portfolio underperformed the selected risk-free benchmark.
A negative result should be interpreted carefully because ranking negative Sharpe ratios can sometimes produce unintuitive conclusions.
Zero Sharpe Ratio
If:
Portfolio Return = Risk-Free Rate
then:
Excess Return = 0
and:
Sharpe Ratio = 0
The investment generated no additional return relative to the benchmark for the volatility assumed.
Sharpe Ratio and Standard Deviation
The denominator is the standard deviation of returns.
Suppose two portfolios have identical 8% returns.
Portfolio X volatility:
5%
Portfolio Y volatility:
15%
With a 3% risk-free rate:
X:
(8% − 3%) ÷ 5% = 1.00
Y:
(8% − 3%) ÷ 15% ≈ 0.33
The same raw return produces very different Sharpe ratios because measured volatility differs.
Standard Deviation Includes Upside Volatility
A major feature—and limitation—of Sharpe ratio is that standard deviation treats unusually strong positive returns as variability too.
Suppose an investment has occasional large positive jumps.
Those gains raise standard deviation even though investors may not consider unexpectedly high gains harmful.
This is one reason Sortino ratio exists as a separate downside-focused measure.
Sharpe Ratio vs Sortino Ratio
Sharpe ratio:
Excess Return ÷ Total Volatility
Sortino ratio:
Excess Return ÷ Downside Deviation
Sharpe penalizes both upside and downside dispersion.
Sortino focuses on unfavorable outcomes relative to a target.
Neither is automatically superior. They answer slightly different questions.
Sharpe Ratio and Sequence of Returns Risk
Sequence of returns risk concerns the order in which returns occur when cash flows are entering or leaving a portfolio.
A portfolio can have an attractive long-term Sharpe ratio yet still experience severe losses early in a retiree’s withdrawal period.
Sharpe ratio summarizes risk-adjusted performance.
Sequence risk evaluates how the timing of that performance interacts with cash flows.
Sharpe Ratio and Savings Growth
Savings growth depends on contributions, investment returns, and time.
A higher Sharpe ratio does not necessarily produce a higher ending savings balance.
For example:
- Portfolio A may have higher raw return but lower Sharpe;
- Portfolio B may have lower return but higher Sharpe.
If no withdrawals occur, the higher-return portfolio can still finish with more money despite weaker risk-adjusted efficiency.
Sharpe Ratio and Savings Rate
Your savings rate controls how much income is contributed toward financial assets.
Sharpe ratio evaluates the investment strategy after money has been invested.
These are separate drivers of wealth.
A household can improve long-term savings without taking additional investment risk simply by increasing contributions.
Sharpe Ratio and Simple Interest
Simple interest describes a contractual interest calculation based on original principal.
Sharpe ratio is generally relevant to variable investment returns.
A fixed simple-interest arrangement with no return variability does not fit the standard portfolio-volatility framework in the same way as a market investment.
Sharpe Ratio and Sinking Funds
A sinking fund is normally built for a defined future expense.
Because the money may be needed at a known date, capital preservation and liquidity can matter more than maximizing Sharpe ratio.
The right investment metric depends on the goal.
A strong risk-adjusted historical return does not make a volatile investment appropriate for money needed next month.
Monthly Sharpe Ratio
Suppose monthly data show:
- average monthly portfolio return = 0.8%;
- monthly risk-free rate = 0.2%;
- monthly volatility = 2%.
Monthly excess return:
0.8% − 0.2% = 0.6%
Monthly Sharpe:
0.6% ÷ 2%
= 0.30
If observations are independent and the methodology supports standard annualization:
Annualized Sharpe ≈ Monthly Sharpe × √12
≈ 0.30 × 3.464
≈ 1.04
Annualization assumptions should be used carefully when returns have autocorrelation or other nonstandard behavior.
Daily Sharpe Annualization
A commonly used annualization structure for daily return data is:
Annualized Sharpe ≈ Daily Sharpe × √Trading Periods per Year
The exact number of periods should match the dataset and methodology.
Do not annualize the numerator one way and the denominator another.
Consistency is essential.
Arithmetic vs Geometric Returns
Sharpe ratio is commonly calculated from arithmetic average periodic returns rather than CAGR.
That distinction matters.
Suppose annual returns vary widely.
The arithmetic average return and compound annual growth rate can differ substantially.
A Sharpe ratio calculated using one methodology should not be compared blindly with another calculated using different return conventions.
Risk-Free Rate Should Match the Period
If portfolio returns are monthly, the risk-free rate used in the numerator should also represent a comparable monthly period.
Using:
Annual Portfolio Return − Monthly Risk-Free Rate
would mix incompatible periods.
The same principle applies to currencies and nominal versus real returns.
Gross vs Net Sharpe Ratio
Suppose a portfolio earns:
8% gross
but fees reduce investor return to:
7% net
If volatility remains 10% and the risk-free rate is 3%:
Gross Sharpe:
(8% − 3%) ÷ 10% = 0.50
Net Sharpe:
(7% − 3%) ÷ 10% = 0.40
Costs reduce the investor’s actual risk-adjusted result.
Time Period Can Change the Ratio
Suppose a fund experienced:
- strong returns from 2018–2021;
- weak returns afterward.
Its Sharpe ratio over the strong period may differ sharply from its full-period ratio.
When comparing investments, use comparable:
- starting dates;
- ending dates;
- data frequency;
- risk-free assumptions.
Otherwise, the comparison may be misleading.
Sharpe Ratio Does Not Measure Maximum Loss
A portfolio can have a respectable Sharpe ratio and still experience a severe drawdown.
Sharpe ratio evaluates average excess return relative to standard deviation.
It does not directly show:
- worst loss;
- maximum drawdown;
- recovery time;
- tail risk.
Those require separate measures.
Non-Normal Returns
Sharpe ratio is easiest to interpret when volatility is reasonably informative about the return distribution.
Some investments can have:
- skewed returns;
- fat tails;
- infrequent pricing;
- hidden liquidity risk.
In these cases, standard deviation may understate economically important downside risks.
Sharpe Ratio Can Be Manipulated by Smoothing
Assets priced infrequently can appear less volatile simply because their reported values do not change every day.
Lower measured volatility mechanically increases the Sharpe ratio if return stays unchanged.
An apparently excellent Sharpe ratio should therefore be evaluated alongside the underlying valuation and liquidity process.
Common Sharpe Ratio Mistakes
One mistake is using total return instead of excess return in the numerator.
Another is mixing annual return with monthly volatility.
People also compare ratios calculated over different periods without checking methodology.
A further mistake is assuming a high Sharpe ratio guarantees future performance or prevents large losses.
Frequently Asked Questions
What is the Sharpe ratio?
It measures excess investment return per unit of total return volatility.
What is the formula?
Sharpe Ratio = (Portfolio Return − Risk-Free Rate) ÷ Portfolio Volatility
What does a Sharpe ratio of 0.5 mean?
The investment produced 0.5 units of excess return for each unit of measured volatility.
Is a higher Sharpe ratio better?
All else equal, a higher ratio indicates stronger historical or modeled risk-adjusted performance.
Can Sharpe ratio be negative?
Yes, when portfolio return is below the risk-free rate.
Does Sharpe ratio measure downside risk only?
No. It uses total standard deviation, including upside variability.
What is the difference between Sharpe and Sortino ratios?
Sharpe uses total volatility; Sortino uses downside deviation.
Does Sharpe ratio measure maximum drawdown?
No.
Should the risk-free rate use the same period as portfolio returns?
Yes.
Can fees change the Sharpe ratio?
Yes. Net-of-fee return can produce a lower ratio than gross return.
Does a high Sharpe ratio guarantee future success?
No. It describes historical data or model assumptions.
Why use Sharpe ratio?
It helps compare return with volatility when evaluating investments within a broader Savings & Investing strategy.




