


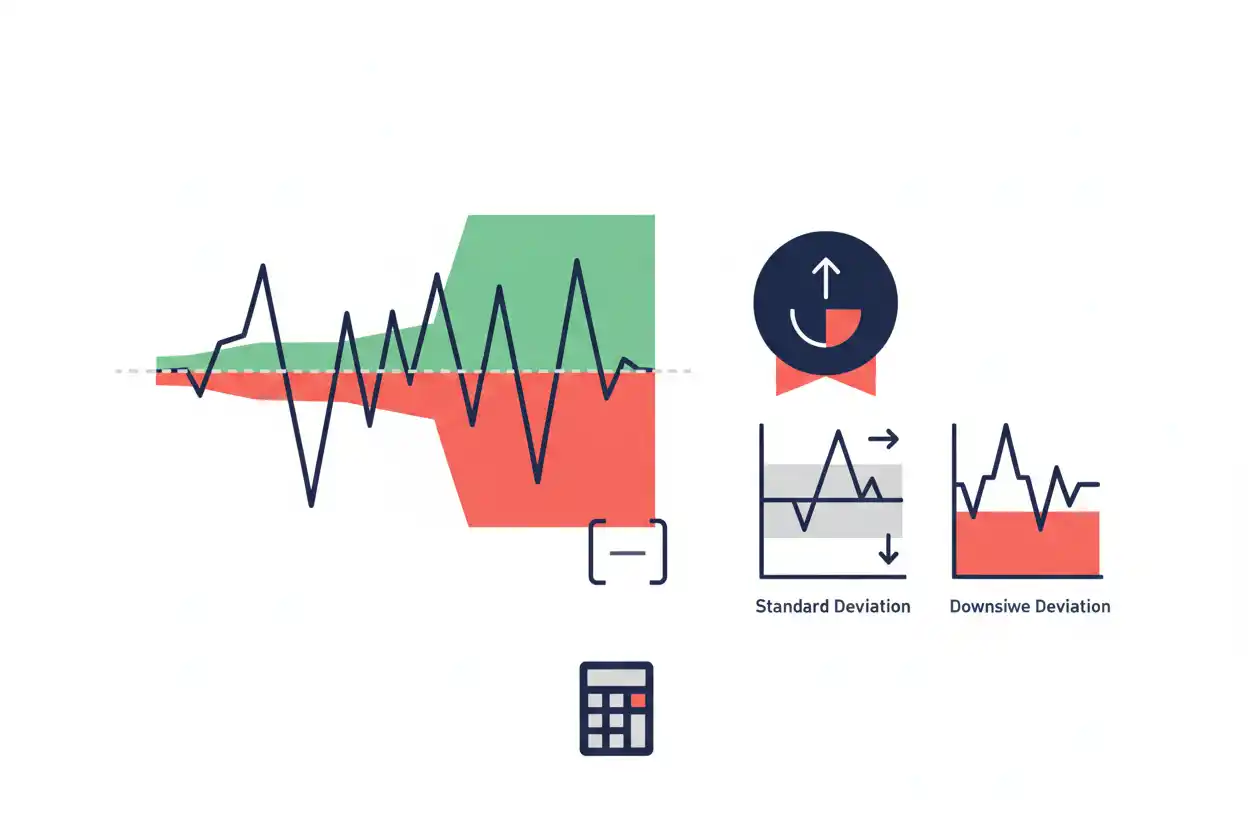
The Sortino ratio measures investment return relative to downside risk rather than total volatility.
Suppose a portfolio earns 10%, the minimum acceptable return is 3%, and downside deviation is 8%.
Its Sortino ratio is:
(10% − 3%) ÷ 8% = 0.875
A second portfolio earning 9% with the same 3% target but only 5% downside deviation has a Sortino ratio of 1.20.
The second portfolio produced less raw return but more excess return per unit of measured downside deviation.
What Is the Sortino Ratio?
The Sortino ratio is a downside-risk-adjusted performance measure.
It asks:
How much return above a target did an investment produce relative to unfavorable variability below that target?
Unlike Sharpe ratio, Sortino does not automatically penalize strong upside volatility in the denominator.
That can make it useful when investors care primarily about harmful downside outcomes.
Sortino Ratio Formula
A common formula is:
Sortino Ratio = (Portfolio Return − Minimum Acceptable Return) ÷ Downside Deviation
Using symbols:
Sortino = (Rₚ − MAR) ÷ DD
Where:
- Rₚ = portfolio return;
- MAR = minimum acceptable return or target return;
- DD = downside deviation.
Some implementations use a risk-free rate instead of a separately chosen target.
The methodology should therefore be stated when comparing ratios from different sources.
Sortino Ratio Example
Suppose:
- portfolio return = 10%;
- minimum acceptable return = 3%;
- downside deviation = 8%.
Excess return:
10% − 3% = 7%
Then:
Sortino Ratio = 7% ÷ 8%
Sortino Ratio = 0.875
The portfolio generated 0.875 units of return above the target for each unit of downside deviation.
Compare Two Portfolios
Portfolio A
- return = 10%;
- target = 3%;
- downside deviation = 8%.
Sortino A = 7% ÷ 8%
= 0.875
Portfolio B
- return = 9%;
- target = 3%;
- downside deviation = 5%.
Sortino B = 6% ÷ 5%
= 1.20
Portfolio B earns less raw return but has the stronger Sortino ratio.
Under this downside-risk framework, B delivered more return above target per unit of unfavorable deviation.
What Is Downside Deviation?
Downside deviation measures how far returns fall below a chosen threshold.
A general form is:
Downside Deviation = √[Σ min(0, Rᵢ − T)² ÷ N]
Where:
- Rᵢ = observed return;
- T = target return;
- N = number of observations under the selected convention.
Calculation conventions vary.
Some implementations divide by all observations, while others use only downside observations or different target-return definitions.
Consistency matters when comparing ratios.
Simple Downside-Deviation Example
Suppose monthly returns relative to a 0% target are:
- +4%;
- −2%;
- +3%;
- −5%.
Only negative deviations contribute:
0%, −2%, 0%, −5%
Square them:
0² + (−2%)² + 0² + (−5%)²
Using decimal values:
0 + 0.0004 + 0 + 0.0025
= 0.0029
Divide by four observations:
0.0029 ÷ 4 = 0.000725
Square root:
√0.000725 ≈ 0.02693
Downside Deviation ≈ 2.69%
A different denominator convention would produce a different result, which is why methodology should be stated.
Why Positive Volatility Is Excluded
Suppose an investment usually earns 1% monthly but occasionally earns 10%.
Those large positive months increase standard deviation.
Sharpe ratio treats them as volatility.
Sortino ratio does not treat returns above the selected target as downside deviations.
That distinction can make Sortino especially informative for positively skewed return patterns.
Sortino Ratio vs Sharpe Ratio
Sharpe ratio uses:
Excess Return ÷ Total Standard Deviation
Sortino uses:
Excess Return ÷ Downside Deviation
The numerator can also differ depending on the chosen target.
The essential distinction is:
Sharpe: total volatility.
Sortino: downside-focused volatility.
Example Where Sharpe and Sortino Tell Different Stories
Suppose Portfolio X has frequent large positive surprises and modest losses.
Those upside jumps can increase total standard deviation and lower its Sharpe ratio.
Because Sortino ignores returns above the target when measuring downside deviation, its Sortino ratio can remain relatively strong.
This does not mean Sortino is always “more accurate.”
It simply reflects a different definition of risk.
Selecting the Minimum Acceptable Return
The target in the numerator and downside calculation can represent:
- 0%;
- risk-free rate;
- required return;
- investor-specific hurdle rate;
- another minimum acceptable periodic return.
Suppose:
Portfolio Return = 9%
With target 0% and downside deviation 6%:
Sortino = 9% ÷ 6% = 1.50
With target 4%:
Sortino = (9% − 4%) ÷ 6%
≈ 0.83
The target assumption can materially change the ratio.
Monthly Target Must Match Monthly Returns
Suppose return data are monthly.
If the annual target is 6%, using 6% directly as the monthly threshold would be inconsistent.
An appropriate monthly equivalent should be calculated based on the target’s rate convention.
Rate frequency must match return frequency.
Sortino Ratio and Standard Deviation of Returns
Standard deviation of returns considers the full distribution of return deviations.
Sortino narrows the denominator to unfavorable returns relative to a target.
This is why two portfolios with equal standard deviation can have different Sortino ratios if one has more downside variability.
Sortino Ratio and Stock-Bond Allocation
A stock-bond allocation can change both expected return and downside behavior.
Suppose adding bonds reduces the portfolio’s large negative months but also lowers average return.
Sortino ratio can help evaluate whether the reduction in downside deviation compensated for the lower return.
The allocation decision still needs to consider liquidity, time horizon, and other forms of risk.
Sortino Ratio and Social Security Benefits
Social Security benefits provide retirement income under statutory rules rather than market investment returns.
A claiming-age decision therefore should not be evaluated with Sortino ratio as though Social Security were a fluctuating investment portfolio.
However, additional predictable retirement income can reduce the amount that must be withdrawn from risky assets.
Sortino Ratio and Sinking Funds
A sinking fund usually has a specific target date.
Even an investment with an attractive historical Sortino ratio can be inappropriate if the sinking-fund money must be available soon.
Downside-risk-adjusted performance is useful, but it does not eliminate the possibility of loss near the spending date.
Sortino Ratio and Simple Interest
Simple interest applies a stated interest formula rather than evaluating a sequence of variable investment returns.
Sortino ratio is primarily useful when returns vary and downside observations can be measured.
The concepts therefore belong to different types of financial analysis.
Sortino Ratio and Sequence of Returns Risk
Sequence of returns risk focuses on when losses occur relative to contributions or withdrawals.
A strong historical Sortino ratio does not guarantee that future downside events will avoid the early years of retirement.
Sortino measures the magnitude and frequency of downside deviations in the selected data.
Sequence risk evaluates their timing relative to investor cash flows.
Negative Sortino Ratio
Suppose:
- portfolio return = 1%;
- target return = 3%;
- downside deviation = 5%.
Then:
Sortino = (1% − 3%) ÷ 5%
Sortino = −0.40
The portfolio failed to achieve the minimum acceptable return.
Zero Sortino Ratio
If:
Portfolio Return = Target Return
then:
Numerator = 0
and:
Sortino Ratio = 0
provided downside deviation is nonzero.
The portfolio exactly matched the target on the average return measure used.
What If There Is No Downside Deviation?
Suppose no observation falls below the target.
Then:
Downside Deviation = 0
The formula requires division by zero and the ordinary Sortino ratio becomes undefined or effectively unbounded depending on reporting convention.
This is a mathematical edge case rather than evidence that risk literally does not exist.
Sortino Ratio and Fees
Suppose:
- gross portfolio return = 9%;
- investment costs = 1%;
- net return = 8%;
- target = 3%;
- downside deviation = 6%.
Gross Sortino:
(9% − 3%) ÷ 6% = 1.00
Net Sortino:
(8% − 3%) ÷ 6% ≈ 0.83
Fees reduce investor return and can weaken risk-adjusted performance.
Different Time Periods
A fund’s five-year Sortino ratio can differ significantly from its 10-year ratio.
If the shorter period excludes a severe market decline, downside deviation can look much smaller.
Comparisons should therefore use consistent:
- dates;
- return frequency;
- target;
- fee treatment.
Sortino Ratio and Tail Risk
Downside deviation is more focused than standard deviation, but it still does not capture every risk.
An investment with rare catastrophic losses may look attractive until such an event occurs.
Additional analysis can include:
- maximum drawdown;
- expected shortfall;
- stress testing;
- liquidity risk.
No single ratio fully describes investment safety.
High Sortino Ratio Does Not Guarantee High Wealth
Suppose:
- Portfolio A earns 6% with a very high Sortino ratio;
- Portfolio B earns 10% with a lower Sortino ratio.
Portfolio B could still produce more long-term wealth if its higher return persists.
Sortino describes risk-adjusted efficiency—not ending portfolio size.
Common Sortino Ratio Mistakes
One mistake is assuming every Sortino calculation uses the same target and downside-deviation convention.
Another is mixing monthly returns with an annual target.
Investors may also conclude that upside volatility does not matter at all simply because Sortino excludes it from the denominator.
A further mistake is treating a high historical Sortino ratio as a guarantee against future losses.
Frequently Asked Questions
What is the Sortino ratio?
It measures return above a selected target relative to downside deviation.
What is the formula?
Sortino Ratio = (Portfolio Return − Minimum Acceptable Return) ÷ Downside Deviation
How is Sortino different from Sharpe?
Sharpe uses total volatility; Sortino focuses on downside deviation.
What is downside deviation?
It measures return shortfalls below a selected target.
What target should I use?
It can be zero, a risk-free rate, a required return, or another minimum acceptable rate, depending on the analysis.
Is a higher Sortino ratio better?
All else equal, a higher ratio means more return above the target per unit of measured downside deviation.
Can Sortino ratio be negative?
Yes, when portfolio return is below the target.
What happens if downside deviation is zero?
The ordinary ratio is undefined because its denominator is zero.
Does Sortino measure maximum drawdown?
No.
Does Sortino account for sequence of returns risk?
No. It does not directly measure when losses occur relative to withdrawals.
Can fees lower the Sortino ratio?
Yes, because they reduce net portfolio return.
Why use Sortino ratio?
It provides a downside-focused view of investment performance within the broader Savings & Investing analysis.




