


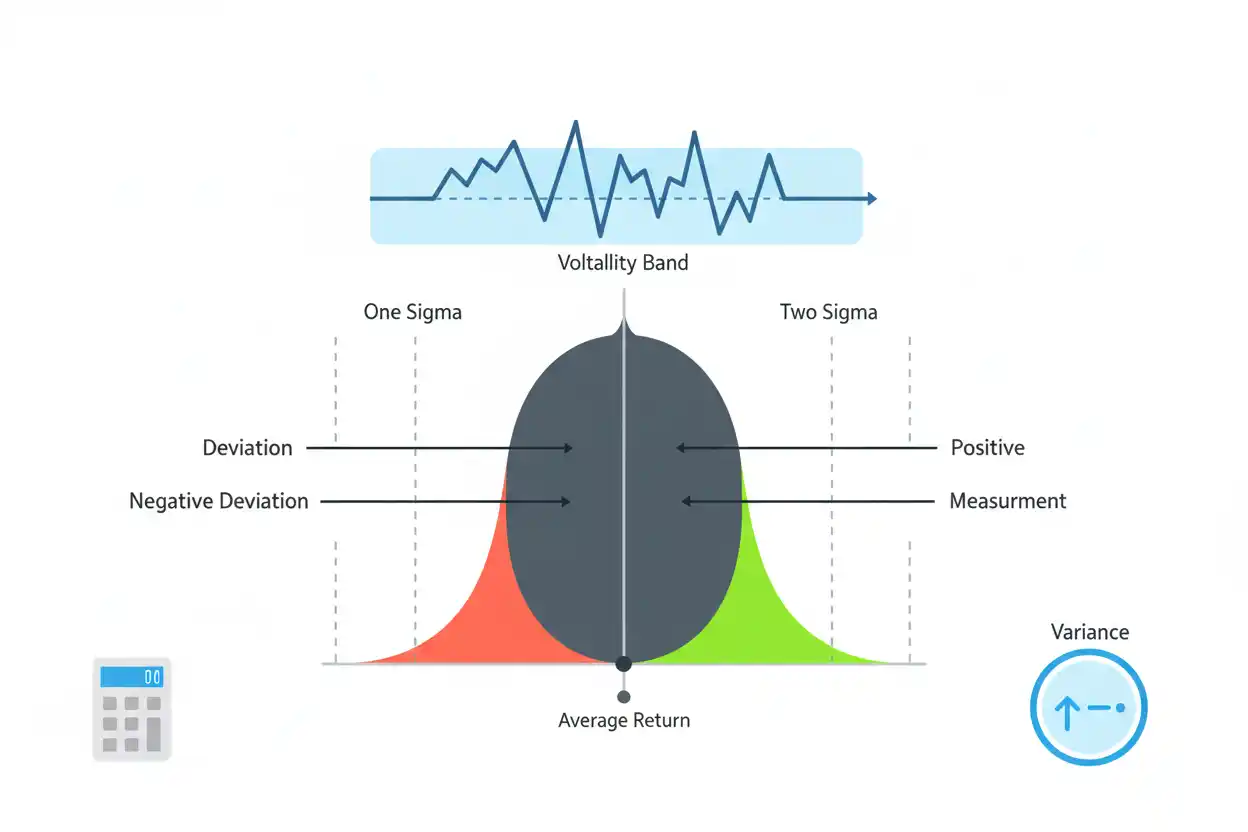
Standard deviation of returns measures how widely investment returns vary around their average.
If returns remain close to their average, standard deviation is relatively low. If returns swing far above and below the average, standard deviation is higher.
For example, consider annual returns of 8%, −4%, 12%, 6%, and −2%. Their average is 4%, while the population standard deviation is approximately 6.07%.
Standard deviation is widely used as a volatility measure, but it is not the same as maximum loss, downside risk, or the probability of losing money.
What Is Standard Deviation of Returns?
Standard deviation measures the dispersion of a return series.
Suppose two investments both average 6%.
Investment A produces:
5%, 6%, 7%, 6%, 6%
Investment B produces:
−10%, 18%, 2%, 15%, 5%
Their average returns might be similar, but Investment B varies much more dramatically.
Its standard deviation would therefore be higher.
Standard Deviation Formula
For a complete population of returns:
σ = √[Σ(Rᵢ − R̄)² ÷ N]
Where:
- σ = population standard deviation;
- Rᵢ = each observed return;
- R̄ = average return;
- N = number of observations.
For a sample:
s = √[Σ(Rᵢ − R̄)² ÷ (n − 1)]
The difference is the denominator.
Standard Deviation Example
Suppose annual returns are:
- 8%;
- −4%;
- 12%;
- 6%;
- −2%.
First calculate the arithmetic average:
Average Return = (8% − 4% + 12% + 6% − 2%) ÷ 5
Average Return = 20% ÷ 5
Average Return = 4%
Step 1: Calculate Each Deviation
Subtract the 4% average from each return.
| Return | Deviation From 4% |
|---|---|
| 8% | 4% |
| −4% | −8% |
| 12% | 8% |
| 6% | 2% |
| −2% | −6% |
Positive and negative deviations would cancel if simply added, so the deviations are squared.
Step 2: Square the Deviations
| Deviation | Squared Deviation |
|---|---|
| 4% | 0.0016 |
| −8% | 0.0064 |
| 8% | 0.0064 |
| 2% | 0.0004 |
| −6% | 0.0036 |
Sum:
0.0016 + 0.0064 + 0.0064 + 0.0004 + 0.0036 = 0.0184
Step 3: Calculate Variance
If these five returns represent the complete population being analyzed:
Variance = 0.0184 ÷ 5
Variance = 0.00368
Step 4: Take the Square Root
Standard Deviation = √0.00368
Standard Deviation ≈ 0.06066
Convert to a percentage:
Standard Deviation ≈ 6.07%
The return series has a population standard deviation of approximately 6.07%.
Sample Standard Deviation
If the five observations are treated as a sample from a larger return population, divide by:
n − 1 = 4
Then:
Sample Variance = 0.0184 ÷ 4
= 0.0046
Sample standard deviation:
√0.0046 ≈ 0.06782
≈ 6.78%
The sample standard deviation is therefore approximately 6.78%.
Population vs Sample Standard Deviation
Use the population version when the observations represent the entire dataset you intend to describe.
Use the sample version when those observations are being used to estimate variability in a larger underlying population.
Financial software can report either version depending on the function used.
That means two analysts can use the same returns and obtain slightly different standard deviations without either calculation necessarily being wrong.
What Does 6% Standard Deviation Mean?
A standard deviation of 6% means returns historically or mathematically varied around their average with a dispersion measured at six percentage points.
It does not mean:
- the investment cannot lose more than 6%;
- returns will always stay within ±6%;
- a 6% loss is the worst-case outcome.
Standard deviation is a dispersion statistic, not a loss ceiling.
Standard Deviation and Normal Distributions
If returns were perfectly normally distributed, approximately:
- 68% of observations would fall within one standard deviation of the mean;
- 95% within two;
- 99.7% within three.
Suppose:
- mean return = 8%;
- standard deviation = 10%.
One-standard-deviation range:
8% ± 10%
or approximately:
−2% to 18%
However, real investment returns do not always follow a normal distribution.
Extreme losses can occur more frequently than a simple normal model suggests.
Comparing Two Investments
Suppose:
Investment A
Average Return = 8%
Standard Deviation = 6%
Investment B
Average Return = 10%
Standard Deviation = 18%
Investment B has the higher average return but three times the volatility.
Which is preferable cannot be decided from standard deviation alone because return objectives and risk tolerance also matter.
Standard Deviation and Sharpe Ratio
The Sharpe ratio uses standard deviation directly:
Sharpe Ratio = (Portfolio Return − Risk-Free Rate) ÷ Standard Deviation
Suppose:
- return = 10%;
- risk-free rate = 4%;
- standard deviation = 12%.
Then:
Sharpe Ratio = 6% ÷ 12%
= 0.50
Standard deviation is therefore the risk denominator in one of the most widely used risk-adjusted performance metrics.
Standard Deviation vs Sortino Ratio
The Sortino ratio addresses one limitation of standard deviation.
Standard deviation treats both:
- unexpectedly high returns;
- unexpectedly low returns;
as volatility.
Sortino instead focuses on downside deviation.
An investment with frequent large positive surprises can therefore have relatively high standard deviation without having equally severe downside risk.
Annualizing Standard Deviation
If monthly returns are independent and measured consistently, monthly volatility is commonly annualized using:
Annualized Standard Deviation = Monthly Standard Deviation × √12
Suppose monthly standard deviation is:
2.5%
Then:
Annualized Standard Deviation = 2.5% × √12
≈ 2.5% × 3.464
≈ 8.66%
You do not multiply monthly standard deviation by 12.
Why Volatility Uses the Square Root of Time
Variance scales approximately with time under the standard independent-return assumption.
Because standard deviation is the square root of variance:
Annualized SD = Periodic SD × √Number of Periods
For weekly returns, an annualization might use approximately:
Weekly SD × √52
The assumptions should be checked when returns show autocorrelation or other nonstandard behavior.
Standard Deviation of a Two-Asset Portfolio
Portfolio volatility depends on:
- each asset’s volatility;
- portfolio weights;
- correlation.
A simplified two-asset formula is:
σₚ = √[w₁²σ₁² + w₂²σ₂² + 2w₁w₂σ₁σ₂ρ]
This is why a diversified portfolio’s standard deviation is not simply the weighted average of individual standard deviations.
Standard Deviation and Stock-Bond Allocation
A stock-bond allocation can change portfolio volatility substantially.
Suppose stocks have:
16% Standard Deviation
and bonds have:
6% Standard Deviation
A mixed portfolio may have volatility below 16%, particularly when stock and bond returns are not perfectly positively correlated.
The allocation therefore affects both expected return and variability.
Standard Deviation and Time Value of Money
Time value of money calculations often use one assumed rate such as 6% every year.
Standard deviation reminds us that actual market returns rarely arrive as a smooth 6%, 6%, 6%, 6% sequence.
A future-value calculation can be mathematically correct while still simplifying the uncertainty of real investment returns.
Standard Deviation and Sinking Funds
A sinking fund often has a fixed future spending date.
If money needed in one year is invested in an asset with high standard deviation, the balance may be substantially below the target when the expense arrives.
The time horizon therefore matters when deciding how much volatility a savings goal can tolerate.
Standard Deviation and Social Security Benefits
Social Security benefits are not market investment returns.
Their monthly payment rules should not be analyzed by simply assigning them stock-like return volatility.
Predictable retirement income can instead reduce the amount of spending that must be funded from portfolios whose returns have measurable standard deviation.
Standard Deviation and Drawdowns
A portfolio with 10% standard deviation can still experience a 30% drawdown.
Standard deviation describes the distribution of periodic returns.
Maximum drawdown measures the largest cumulative decline from a previous peak.
Those are different risk dimensions.
Standard Deviation and Sequence Risk
A retirement portfolio could have the same standard deviation over two different periods but very different withdrawal outcomes.
If severe negative returns occur early during retirement, the damage can be much greater than if the same negative returns occur later.
Standard deviation does not directly capture this ordering effect.
Rolling Standard Deviation
Volatility can change over time.
A rolling 12-month or 36-month standard deviation recalculates the metric across moving windows.
For example:
- Years 1–3 may show 8% volatility;
- Years 4–6 may show 20%.
One long-term standard deviation can hide these changes.
Historical vs Expected Standard Deviation
Historical standard deviation describes realized returns.
Expected standard deviation estimates future risk.
The second requires assumptions.
A historical volatility of 12% does not guarantee that future volatility will also be 12%.
Standard Deviation Does Not Measure Every Risk
Low-volatility assets can still have substantial:
- credit risk;
- liquidity risk;
- inflation risk;
- concentration risk;
- fraud risk.
Standard deviation should therefore be used alongside other measures rather than interpreted as a complete definition of investment safety.
Common Standard Deviation Mistakes
One mistake is forgetting to convert percentage returns consistently.
Another is confusing population and sample formulas.
People may also annualize monthly volatility by multiplying by 12 instead of √12.
A further mistake is treating standard deviation as a maximum possible loss.
Frequently Asked Questions
What is standard deviation of returns?
It measures how widely investment returns vary around their arithmetic average.
What is the population formula?
σ = √[Σ(Rᵢ − R̄)² ÷ N]
What is the sample formula?
s = √[Σ(Rᵢ − R̄)² ÷ (n − 1)]
Does higher standard deviation mean higher volatility?
Yes, all else equal.
Does standard deviation measure maximum loss?
No.
Why are deviations squared?
Squaring prevents positive and negative deviations from canceling and gives greater weight to larger deviations.
How do I annualize monthly standard deviation?
Annualized SD = Monthly SD × √12
under the standard assumptions.
Is standard deviation the same as downside deviation?
No. Standard deviation includes both positive and negative variation.
Why does Sharpe ratio use standard deviation?
It measures excess return relative to total volatility.
Can two investments have the same return but different standard deviations?
Yes.
Does historical standard deviation predict future volatility exactly?
No.
Why is standard deviation useful?
It provides a standardized measure of return variability for comparing investments and portfolios within broader Savings & Investing analysis.




