


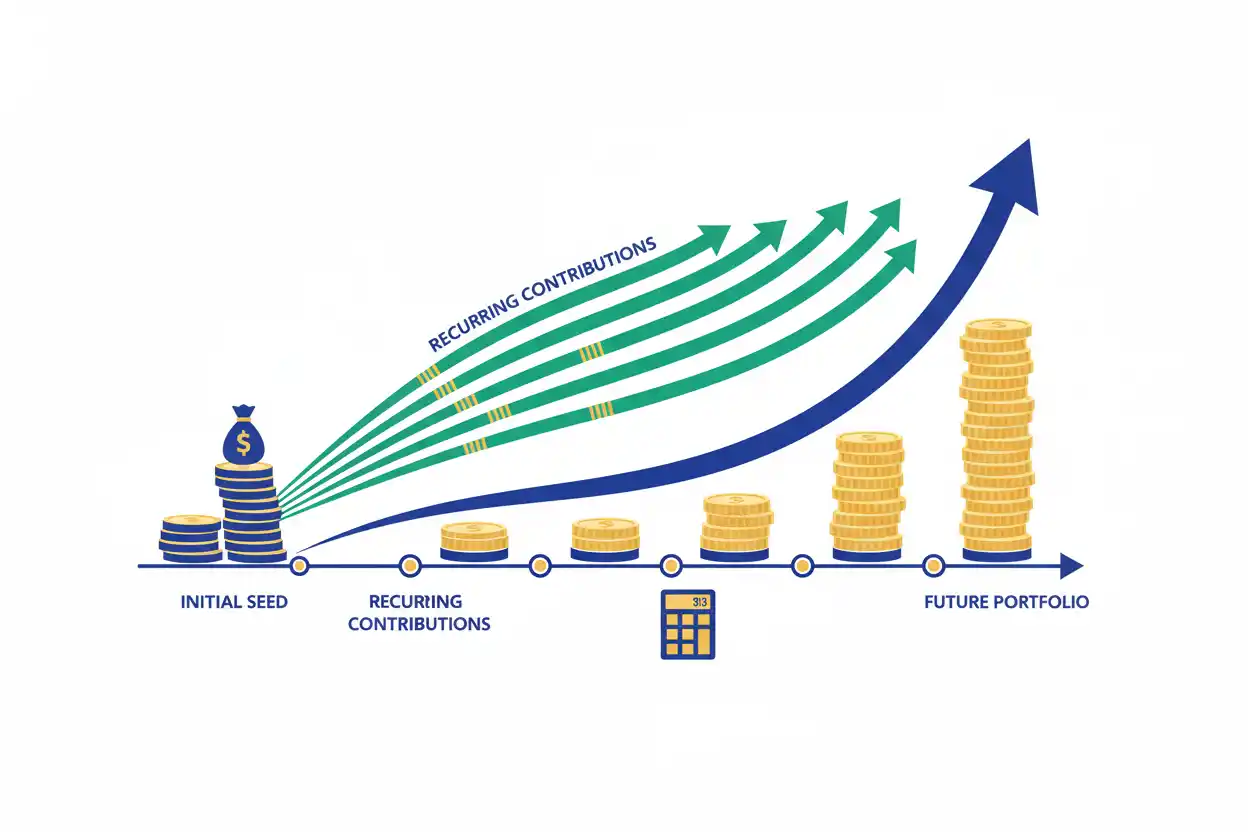
Investment growth comes from three main sources: the amount invested initially, additional contributions, and returns generated over time.
A portfolio can therefore grow even when investment performance is modest if contributions are substantial. Conversely, a portfolio can show strong percentage returns while still remaining small if little capital was invested.
Understanding investment growth means separating money contributed by the investor from growth produced by the investments themselves.
What Is Investment Growth?
Investment growth is the increase in portfolio value attributable to investment returns, contributions, or both.
A simplified relationship is:
Ending Portfolio = Starting Portfolio + Contributions + Investment Gains − Withdrawals
Investment gains can include:
- price appreciation;
- interest;
- dividends;
- other investment income.
For planning purposes, compound-growth formulas help estimate how those elements can interact over time.
Growth of a Lump Sum
For one starting investment with no additional contributions:
Future Value = Principal × (1 + Return)^Years
Suppose:
- initial investment = $50,000;
- annual return assumption = 6%;
- period = 10 years.
Then:
Future Value = $50,000 × 1.06¹⁰
Future Value ≈ $89,542.38
The $50,000 grows to approximately $89,542 under the constant-return assumption.
Growth above the original investment is:
$89,542.38 − $50,000 = $39,542.38
Investment Growth With Annual Contributions
Now suppose the investor also contributes $10,000 at the end of every year.
The future value of those contributions is:
FV of Contributions = PMT × [(1 + r)^n − 1] ÷ r
Insert:
FV = $10,000 × [(1.06)^10 − 1] ÷ 0.06
FV ≈ $131,807.95
The future value of the original $50,000 was:
$89,542.38
Combine them:
Total Future Portfolio ≈ $89,542.38 + $131,807.95
Total Future Portfolio ≈ $221,350.33
Under these assumptions, the portfolio grows to approximately $221,350.
Separate Contributions From Investment Growth
How much cash did the investor actually contribute?
Initial investment:
$50,000
Annual contributions:
$10,000 × 10 = $100,000
Total contributed:
$150,000
Ending portfolio:
$221,350.33
Therefore:
Investment Growth = $221,350.33 − $150,000
Investment Growth ≈ $71,350.33
Approximately $71,350 of the ending balance represents growth beyond contributed capital under the model.
Why Starting Earlier Matters
Suppose two people each invest $50,000 at 6%.
Investor A invests for 20 years:
$50,000 × 1.06²⁰ ≈ $160,356.77
Investor B invests for 10 years:
$50,000 × 1.06¹⁰ ≈ $89,542.38
The longer time horizon creates a large difference because gains themselves have more time to generate additional gains.
Investment Growth and Compounding
Compounding means returns build on previous returns.
If $10,000 gains 10%:
Year 1 = $11,000
If it gains another 10%:
Year 2 = $12,100
The second year’s gain is:
$12,100 − $11,000 = $1,100
rather than $1,000.
That extra $100 came from earning a return on the previous year’s $1,000 gain.
Monthly Contribution Example
Suppose an investor contributes:
- $500 per month;
- for 20 years;
- at a hypothetical 7% nominal annual return compounded monthly.
Monthly rate:
r = 0.07 ÷ 12
r ≈ 0.00583333
Number of periods:
n = 20 × 12 = 240
Using end-of-month contributions:
FV = $500 × [(1 + 0.07 ÷ 12)^240 − 1] ÷ (0.07 ÷ 12)
FV ≈ $260,463.33
Total contributions are:
$500 × 240 = $120,000
Estimated growth:
$260,463.33 − $120,000
≈ $140,463.33
More than half of the modeled ending value comes from investment growth under these assumptions.
Contributions at the Beginning of the Period
If contributions occur at the beginning rather than the end of each period, each deposit receives one extra compounding period.
Beginning-of-Period FV = End-of-Period FV × (1 + Periodic Rate)
This difference can become meaningful over long contribution schedules.
Investment Growth vs Future Value
Future value focuses on what one present amount becomes after compounding.
Investment growth is broader.
It can include:
- starting principal;
- recurring deposits;
- irregular contributions;
- distributions;
- withdrawals;
- changing returns.
Future value is one of the mathematical tools used to model investment growth.
Investment Growth and Future Value of Annuity
Recurring equal contributions can be modeled with future value of annuity.
That formula recognizes that each contribution is invested for a different length of time.
If $10,000 is contributed annually for 10 years, the final year’s deposit cannot reasonably be treated as though it had been invested for the entire decade.
The annuity calculation handles that timing difference.
Investment Growth and Holding Period Return
Holding period return measures investment performance over a defined interval.
Investment growth measures the resulting wealth accumulation more broadly.
Suppose a portfolio grows from $100,000 to $160,000, but $40,000 of that increase came from new contributions.
It would be misleading to say the investor earned a 60% return.
Growth and return are connected but not interchangeable.
Investment Growth and Inflation
A portfolio can grow nominally while making little progress in real purchasing power.
Inflation reduces the value of future dollars relative to current prices.
Suppose a portfolio earns 6% while inflation averages 3%.
Its real growth rate is closer to:
1.06 ÷ 1.03 − 1 ≈ 2.91%
rather than the full 6% nominal rate.
Long-term projections should therefore distinguish nominal portfolio growth from real purchasing-power growth.
Investment Growth Inside an IRA
An IRA is an account structure used for U.S. retirement saving.
Investment growth within the account still depends on the assets held.
An IRA itself does not create a specific return.
For example, cash, bonds, diversified funds, or other permitted investments can produce very different growth paths.
The account’s tax treatment and the underlying investment performance are separate variables.
Investment Growth: Lump Sum vs SIP
The lump sum vs SIP decision affects when capital enters the market.
A lump sum puts available money to work immediately.
A systematic investment plan spreads purchases across future dates.
If markets rise steadily, earlier investment receives more time to compound.
If prices fall after the initial date, phased contributions may buy more units at lower prices.
The best outcome depends on the actual future path of returns, which is unknown in advance.
Investment Growth With Variable Returns
Real investment returns rarely remain constant.
Suppose a portfolio experiences:
- +12%;
- −8%;
- +6%;
- +10%.
Beginning with $10,000:
Ending Value = $10,000 × 1.12 × 0.92 × 1.06 × 1.10
Ending Value ≈ $12,009.54
Total return:
$12,009.54 ÷ $10,000 − 1 ≈ 20.10%
A fixed average-return assumption would not necessarily reproduce the exact same result.
Why Large Losses Require Larger Recoveries
Suppose an investment falls 50%.
A $100 balance becomes:
$100 × 0.50 = $50
To return from $50 to $100:
Required Gain = ($100 − $50) ÷ $50
Required Gain = 100%
A 50% loss therefore requires a 100% subsequent gain to recover.
This asymmetric mathematics is crucial when evaluating long-term investment growth.
Contributions Can Matter More Early On
When a portfolio is small, contributions can dominate annual growth.
Suppose a $20,000 portfolio earns 8%:
Investment Gain = $1,600
If the investor contributes $10,000 during the year, the contribution is much larger than the investment gain.
Later, when the portfolio reaches $500,000, an 8% gain is:
$500,000 × 8% = $40,000
At that stage, market performance can have a much larger dollar impact than the same $10,000 annual contribution.
Withdrawals Reduce Future Growth
A withdrawal does more than reduce the balance today.
It also removes the future growth that money could have earned.
Suppose $20,000 is withdrawn from a portfolio and otherwise could have earned 6% for 15 years.
Lost Future Value = $20,000 × 1.06¹⁵
Lost Future Value ≈ $47,931.16
The immediate withdrawal is $20,000, but its long-term opportunity cost could be much larger under the assumed return.
Fees and Investment Growth
Recurring fees reduce the return available to compound.
Suppose:
- gross return = 7%;
- recurring cost = 1%.
A simplified net rate is:
7% − 1% = 6%
Over one year, the difference may look modest.
Over decades, the lost compounding can become substantial.
Investment-growth projections should therefore use realistic net assumptions rather than ignoring costs.
Taxes and Growth
Taxes can also reduce the amount available to remain invested, depending on account type and applicable tax treatment.
Tax-deferred or tax-advantaged account structures may change when taxes are paid, but they do not eliminate the fundamental importance of:
- investment return;
- time;
- contributions;
- withdrawals.
Investment projections should reflect the account structure being modeled.
Investment Growth Is Not Guaranteed
A future-value projection such as:
$100,000 × 1.07²⁰
is exact mathematically.
The uncertain part is whether the portfolio will actually earn 7% each year.
Market investments can experience prolonged declines, volatility, and losses.
Investment-growth models are therefore scenarios rather than promises.
Common Investment Growth Mistakes
One mistake is treating contributions as investment returns.
Another is assuming a fixed historical return will continue unchanged.
People can also ignore inflation, fees, taxes, or withdrawals.
Finally, focusing only on the ending balance can hide how much of that balance came from investor contributions rather than market growth.
Frequently Asked Questions
What causes investment growth?
Investment growth can come from price appreciation, interest, dividends, reinvestment, additional contributions, and compounding.
What is the basic lump-sum growth formula?
Future Value = Principal × (1 + Return)^Years
How do recurring contributions affect growth?
They add new capital over time, and earlier contributions generally have more time to compound.
How do I separate contributions from gains?
Investment Growth = Ending Portfolio − Total Net Contributions
when no other balance adjustments need to be considered.
Why does starting earlier matter?
Earlier money receives more compounding periods.
Does a higher contribution rate always beat higher returns?
Not necessarily, but contributions can be especially important when the portfolio is still small.
Does investment growth equal investment return?
No. Growth can include new contributions, while return measures investment performance.
How does inflation affect investment growth?
Inflation reduces the purchasing-power value of nominal portfolio growth.
Does an IRA guarantee growth?
No. An IRA is an account structure. Growth depends on the investments held within it.
Is lump-sum investing always better than recurring investing?
No. Outcomes depend on the future sequence of market prices and returns.
Can withdrawals have a larger long-term impact than their dollar amount?
Yes. Withdrawn money also loses its potential future compounding.
Why model investment growth?
It helps connect contributions, returns, time, and financial goals within a broader Savings & Investing plan.




