


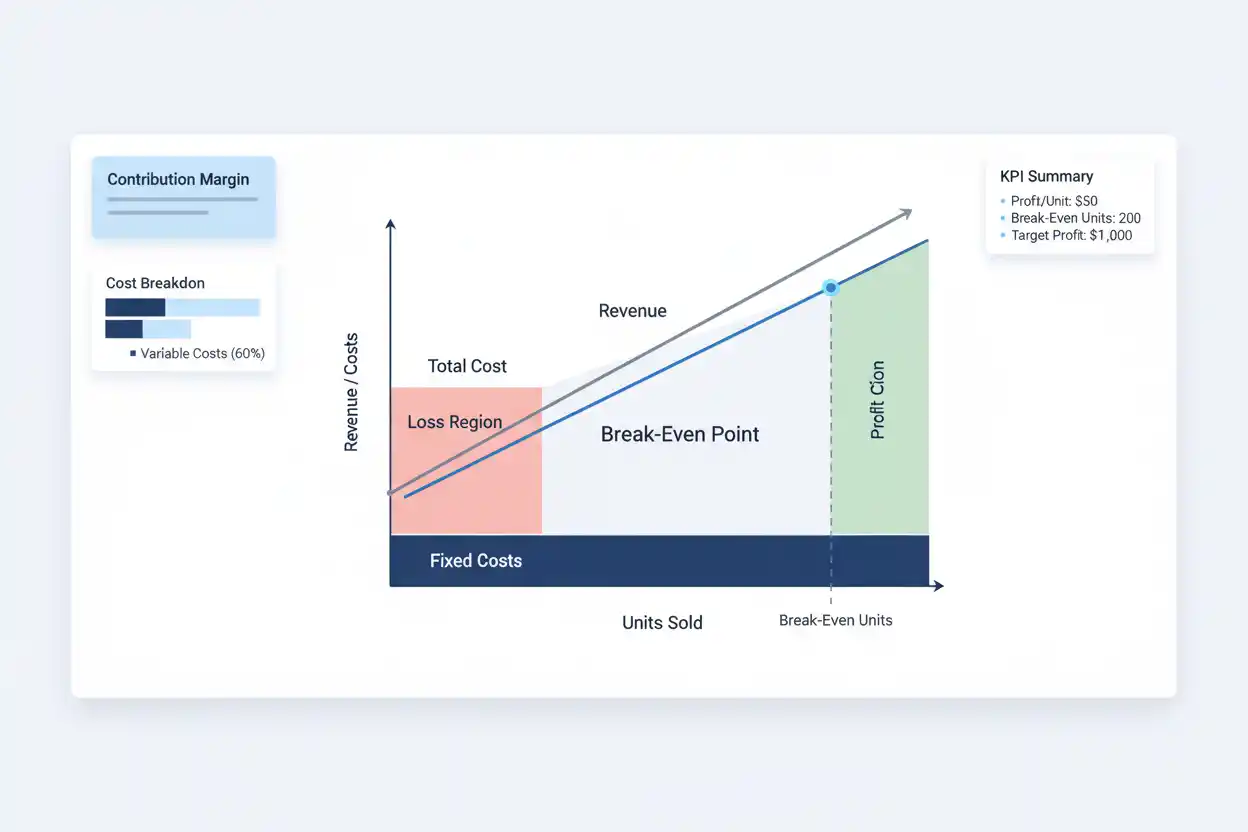
Break-even analysis determines the sales volume or revenue a business needs to cover its costs before it begins generating profit under the assumptions used in the calculation.
At the break-even level, total contribution equals fixed costs. Below that level, the modeled operation produces a loss. Above it, additional contribution can produce operating profit.
The basic calculation is simple. The useful analysis comes from understanding which costs are fixed, which costs vary with sales, how much each sale contributes toward fixed costs, and how changes in price or cost move the break-even threshold.
Break-even analysis therefore sits at the intersection of pricing, cost management, sales forecasting, profitability, and business finance.
What Is Break-Even Analysis?
Break-even analysis examines the relationship among selling price, sales volume, variable costs, fixed costs, and profit.
Its central question is:
How much must a business sell before revenue covers the costs included in the model?
A company can calculate break-even in units when it sells measurable products or services at a reasonably consistent unit price. It can also calculate break-even revenue using a contribution margin ratio.
For example, a company that earns $25 of contribution from each unit and has $50,000 of fixed costs needs to sell enough units for total contribution to reach $50,000.
Break-Even Units = Fixed Costs ÷ Contribution Margin per Unit
Break-Even Units = $50,000 ÷ $25 = 2,000 units
At 2,000 units, the modeled contribution exactly covers the $50,000 of fixed costs.
That 2,000-unit figure is the break-even point. Break-even analysis goes further by examining what happens when price, costs, volume, product mix, or profit targets change.
Break-Even Analysis Formula
For a single product or service, break-even units can be calculated from fixed costs, selling price, and variable cost per unit.
Break-Even Units = Fixed Costs ÷ (Selling Price per Unit − Variable Cost per Unit)
The amount inside the parentheses is the contribution margin per unit.
Contribution Margin per Unit = Selling Price per Unit − Variable Cost per Unit
Suppose a product sells for $80 and has $50 of variable costs.
Contribution Margin per Unit = $80 − $50 = $30
If fixed costs are $120,000:
Break-Even Units = $120,000 ÷ $30
Break-Even Units = 4,000 units
The company must therefore sell 4,000 units under those assumptions before the modeled contribution covers its $120,000 of fixed costs.
Why Contribution Margin Matters
Contribution margin is central to break-even analysis because not every dollar of revenue is available to cover fixed costs.
Part of each sale may immediately be consumed by costs that vary with the sale.
If a product sells for $100 but incurs $65 of variable costs, only $35 remains to contribute toward fixed costs and, after those costs are covered, profit.
Contribution Margin per Unit = $100 − $65 = $35
A business that focuses only on revenue can miss this relationship.
Two companies can each generate $1 million in sales but have very different break-even positions if one retains a much larger contribution from each revenue dollar.
That is why break-even analysis should connect with profit analysis rather than treating sales volume as the only measure that matters.
Fixed Costs in Break-Even Analysis
Fixed costs are costs that do not change directly with the modeled level of sales or production within the relevant operating range and time period.
Examples can include rent, certain salaries, insurance, software subscriptions, property-related expenses, and other costs that remain relatively stable while sales volume changes.
Suppose a company’s monthly modeled fixed costs are:
Rent: $8,000
Salaries: $27,000
Insurance: $2,000
Software and administration: $3,000
Total fixed costs are:
Fixed Costs = $8,000 + $27,000 + $2,000 + $3,000
Fixed Costs = $40,000 per month
Those costs must be covered by contribution generated from sales.
However, “fixed” does not mean permanently unchanged.
A company may need a second warehouse when volume reaches a certain level, hire another manager, add production equipment, or move to a larger facility. These step changes can alter the break-even calculation substantially.
Break-even analysis is therefore most reliable within the operating range represented by its assumptions.
Variable Costs in Break-Even Analysis
Variable costs change with the number of units sold or produced under the model.
For a physical product, they may include materials, packaging, transaction charges, sales commissions, shipping paid by the seller, or other costs tied directly to each additional sale.
Suppose a product has:
Materials of $22
Packaging of $3
Transaction fees of $2
Sales commission of $5
Variable cost per unit becomes:
Variable Cost per Unit = $22 + $3 + $2 + $5
Variable Cost per Unit = $32
If the selling price is $60:
Contribution Margin per Unit = $60 − $32 = $28
The $28 contribution—not the full $60 selling price—is what helps cover fixed costs.
Accurate cost classification matters because understating variable cost can make the break-even threshold appear artificially low.
Break-Even Analysis Example
Consider a small manufacturer selling a product for $125 per unit.
Variable cost per unit is $75, while monthly fixed costs are $90,000.
First calculate contribution margin.
Contribution Margin per Unit = $125 − $75 = $50
Then calculate break-even units.
Break-Even Units = $90,000 ÷ $50
Break-Even Units = 1,800 units
The company therefore needs to sell 1,800 units per month to reach break-even under the model.
Break-even revenue can then be estimated:
Break-Even Revenue = 1,800 × $125
Break-Even Revenue = $225,000
At $225,000 of sales, contribution equals the modeled fixed costs.
Revenue above $225,000 does not automatically become profit dollar for dollar. Each additional sale still incurs its variable cost.
Break-Even Revenue Formula
Businesses that sell many products or prefer to plan in revenue terms can use the contribution margin ratio.
Contribution Margin Ratio = Contribution Margin ÷ Revenue
If a company generates $500,000 of revenue and $200,000 of contribution margin:
Contribution Margin Ratio = $200,000 ÷ $500,000
Contribution Margin Ratio = 40%
Break-even revenue is then:
Break-Even Revenue = Fixed Costs ÷ Contribution Margin Ratio
If fixed costs are $150,000:
Break-Even Revenue = $150,000 ÷ 0.40
Break-Even Revenue = $375,000
The company needs approximately $375,000 of sales under the assumptions used to cover its fixed costs.
Revenue-based analysis becomes particularly useful when management is forecasting total company sales rather than one standardized product.
Contribution Margin Ratio vs Gross Margin
Contribution margin and gross margin are related but should not automatically be treated as identical.
Gross margin is generally based on revenue minus cost of goods sold.
Contribution margin focuses specifically on revenue minus variable costs relevant to the analysis.
Some costs included in cost of goods sold may behave differently from the variable costs used in a management break-even model. Conversely, some variable selling costs may sit outside reported cost of goods sold.
For break-even analysis, cost behavior is crucial.
The calculation must identify how much each additional sale actually contributes toward fixed costs within the model.
Break-Even Analysis With a Profit Target
Businesses usually want to earn more than zero profit.
Break-even mathematics can therefore be extended to calculate the volume required to achieve a target operating profit.
Required Units for Target Profit = (Fixed Costs + Target Profit) ÷ Contribution Margin per Unit
Suppose fixed costs are $80,000, contribution margin is $40 per unit, and management wants $60,000 of operating profit.
Required Units = ($80,000 + $60,000) ÷ $40
Required Units = 3,500 units
The normal break-even point would be:
Break-Even Units = $80,000 ÷ $40 = 2,000 units
However, achieving the $60,000 target requires 3,500 units.
This distinction makes break-even analysis more useful for target pricing and planning than simply asking when losses stop.
How Price Changes Affect Break-Even
Price has a direct effect on contribution margin when variable cost remains unchanged.
Assume a product costs $40 per unit to supply and sells for $70.
Contribution Margin = $70 − $40 = $30
With fixed costs of $120,000:
Break-Even Units = $120,000 ÷ $30 = 4,000 units
Now suppose the selling price rises to $80 while variable cost remains $40.
New Contribution Margin = $80 − $40 = $40
New Break-Even Units = $120,000 ÷ $40 = 3,000 units
The price increase reduces the modeled break-even volume by 1,000 units.
However, this does not prove that raising the price is automatically better.
Customers may buy fewer units at the higher price. Competitors may respond. Product positioning may change. Customer acquisition costs can shift.
Break-even analysis measures the financial consequence of the assumption; it does not predict customer behavior.
How Discounts Affect Break-Even
Discounting can have a larger effect on required sales volume than the percentage discount alone suggests.
Suppose a product normally sells for $100, costs $60 per unit, and contributes $40.
At $100:
Contribution Margin = $100 − $60 = $40
Now reduce the price by 10% to $90.
New Contribution Margin = $90 − $60 = $30
The selling price fell by 10%, but contribution margin fell from $40 to $30—a 25% reduction.
If fixed costs are $120,000:
Original Break-Even Units = $120,000 ÷ $40 = 3,000
Discounted Break-Even Units = $120,000 ÷ $30 = 4,000
The company must sell 1,000 additional units merely to reach the same zero-profit threshold.
This is why discounts should be evaluated through contribution economics rather than percentage-off messaging alone.
How Variable Cost Increases Affect Break-Even
Suppose a company sells a product for $90 and originally incurs $50 of variable cost.
Original Contribution Margin = $90 − $50 = $40
With fixed costs of $100,000:
Original Break-Even Units = $100,000 ÷ $40 = 2,500 units
Now assume material or fulfillment costs rise to $60 per unit.
New Contribution Margin = $90 − $60 = $30
New Break-Even Units = $100,000 ÷ $30 ≈ 3,334 units
The business now needs approximately 834 additional unit sales to break even.
This illustrates why cost inflation can materially alter profitability even when revenue and list prices appear unchanged.
Monitoring net profit without understanding contribution margin can hide the operating mechanism causing the change.
How Fixed Cost Increases Affect Break-Even
Expansion often increases fixed costs.
A company may open another location, lease a warehouse, hire administrative staff, invest in software, or add equipment.
Suppose contribution margin remains $50 per unit but fixed costs rise from $150,000 to $200,000.
Before expansion:
Break-Even Units = $150,000 ÷ $50 = 3,000 units
After expansion:
Break-Even Units = $200,000 ÷ $50 = 4,000 units
The company now needs another 1,000 unit sales to cover its expanded fixed-cost base.
Expansion can still be economically attractive if the new capacity supports sufficient revenue and profit. Break-even analysis simply identifies the higher operating threshold.
Margin of Safety
The margin of safety measures how far actual or expected sales exceed break-even sales.
In revenue terms:
Margin of Safety = Actual Sales − Break-Even Sales
Suppose expected revenue is $600,000 and break-even revenue is $450,000.
Margin of Safety = $600,000 − $450,000 = $150,000
It can also be expressed as a percentage:
Margin of Safety % = (Actual Sales − Break-Even Sales) ÷ Actual Sales × 100
Margin of Safety % = $150,000 ÷ $600,000 × 100 = 25%
A larger margin of safety generally means sales can decline further before reaching the modeled break-even point.
However, the result is only as reliable as the assumptions behind the break-even calculation.
Operating Leverage and Break-Even Risk
Businesses with high fixed costs and lower variable costs can behave differently from businesses with low fixed costs and higher variable costs.
A software company may spend heavily on development and infrastructure before serving additional customers at comparatively low incremental cost.
A resale business may carry lower fixed costs but incur substantial cost with each additional sale.
Operating leverage describes how the cost structure can magnify changes in operating profit as sales change.
High fixed-cost businesses may need substantial initial volume to reach break-even. Once that level has been exceeded, additional contribution can increase profit quickly if capacity remains available.
The same structure can work in reverse when sales fall.
Break-even analysis therefore helps management understand not only the zero-profit threshold but also the risk embedded in its cost structure.
Break-Even Analysis for a Service Business
Service businesses can use break-even analysis even when they do not sell physical units.
A unit might represent a billable hour, consultation, subscription, project, appointment, seat, or customer account.
Suppose a consulting firm charges $250 per billable hour and incurs $50 of variable labor or delivery cost per hour.
Contribution Margin per Hour = $250 − $50 = $200
If monthly fixed costs total $40,000:
Break-Even Billable Hours = $40,000 ÷ $200
Break-Even Billable Hours = 200 hours
The company needs 200 billable hours under those assumptions before contribution covers the modeled fixed costs.
The next question is operational: does the business have enough available capacity to deliver 200 billable hours?
That is where break-even analysis becomes connected to staffing and utilization rather than remaining an abstract formula.
Break-Even Analysis for Multiple Products
Single-product break-even calculations assume one contribution margin per unit.
A multi-product company is more complicated because products can have different prices and contribution margins.
If the sales mix remains sufficiently stable, management can calculate a weighted-average contribution margin.
Suppose a company sells Product A and Product B.
Product A contributes $30 per unit and represents 60% of expected unit sales. Product B contributes $50 and represents 40%.
Weighted Contribution Margin = ($30 × 60%) + ($50 × 40%)
Weighted Contribution Margin = $18 + $20 = $38
If fixed costs are $190,000:
Break-Even Composite Units = $190,000 ÷ $38
Break-Even Composite Units = 5,000
However, the result depends on the assumed sales mix.
If customers shift toward the lower-contribution product, actual break-even requirements rise.
For businesses with many products, revenue-based modeling and scenario analysis can be more practical than forcing every decision into a single-unit calculation.
Break-Even Analysis and Sales Forecasting
Break-even analysis tells management the required sales threshold. A cash flow forecast or sales forecast asks whether that threshold is realistic and when cash may actually arrive.
Suppose a business needs $500,000 of monthly revenue to break even but its realistic sales forecast is only $380,000.
The gap identifies a structural problem before the period begins.
Management can investigate pricing, expenses, contribution margins, sales capacity, or financing needs instead of discovering the problem after losses accumulate.
Likewise, projected sales of $650,000 against a $500,000 break-even point provide a margin above break-even—but that does not automatically mean the company will have sufficient cash.
Sales timing, customer payment terms, inventory, capital expenditure, and debt payments still matter.
Break-Even Is Not the Same as Cash Break-Even
Accounting or operating break-even and cash sufficiency are related but different.
A company may reach operating break-even while still facing cash pressure because customers pay later than suppliers, loan principal must be repaid, inventory must be purchased before sales occur, or capital expenditures consume cash.
Likewise, depreciation is an accounting expense but does not represent a current-period cash payment.
This is why break-even analysis should be considered alongside cash flow forecasting, working capital, and the cash conversion cycle.
Profitability answers one question. Liquidity answers another.
Break-Even Analysis and Pricing
Break-even calculations give pricing decisions a financial structure.
Suppose management is considering three prices for the same product. Each price creates a different contribution margin and therefore a different required sales volume.
A low price may attract more customers but require significantly greater volume.
A high price can reduce the required break-even quantity but may decrease customer demand.
Cost-plus pricing can provide one baseline, while markup and margin vs markup help distinguish commonly confused pricing measures.
Break-even analysis adds another question:
At this price and cost structure, how much must we sell before the economics work?
Break-Even Analysis for a New Business
A new business can use break-even analysis before launching to estimate the operating scale necessary for viability.
Suppose a planned business expects fixed monthly costs of $25,000 and a contribution margin ratio of 35%.
Break-Even Revenue = $25,000 ÷ 0.35
Break-Even Revenue ≈ $71,429 per month
Management can now compare that requirement with expected demand and sales capacity.
If credible market assumptions suggest only $40,000 of monthly revenue, the planned economics deserve further work.
Possible responses include reducing fixed costs, raising contribution margin, changing pricing, redesigning the product, reducing variable costs, or reconsidering the business model.
Break-even analysis cannot prove that customers will buy. It can determine what must happen financially for the modeled operation to cover its costs.
Break-Even Analysis for an Existing Business
Existing businesses can use actual operating data to update assumptions.
If contribution margin declines because input costs rise, management can immediately estimate the new break-even threshold.
If rent increases, another calculation shows the additional sales needed.
If automation lowers variable cost but raises fixed cost, scenario analysis can compare the old and new structures.
For this reason, break-even analysis is most useful as a recurring management tool rather than a calculation performed only when creating a business plan.
It can also support budgeting by connecting expense plans with required revenue.
Scenario Analysis
A single break-even answer can create false confidence because price, demand, and costs rarely remain perfectly constant.
Scenario analysis improves the model by calculating several outcomes.
Imagine the base case assumes:
Price: $100
Variable cost: $60
Fixed costs: $160,000
Base Contribution Margin = $100 − $60 = $40
Base Break-Even Units = $160,000 ÷ $40 = 4,000
Now test a downside scenario in which variable cost rises to $68.
Downside Contribution Margin = $100 − $68 = $32
Downside Break-Even Units = $160,000 ÷ $32 = 5,000
Then consider a price increase to $110 while variable cost remains $68.
Revised Contribution Margin = $110 − $68 = $42
Revised Break-Even Units = $160,000 ÷ $42 ≈ 3,810
The model now provides a decision range rather than one fragile answer.
Break-Even Sensitivity Analysis
Sensitivity analysis asks which assumptions affect the break-even result most.
Management can separately change price, variable cost, fixed cost, or sales mix and observe the resulting threshold.
This process can reveal that a small change in one variable creates a surprisingly large change in required volume.
For example, when contribution margins are thin, a modest increase in variable cost can sharply increase break-even sales.
That insight helps management identify which costs or pricing assumptions deserve the greatest attention.
It also prevents teams from spending excessive effort optimizing expenses that have little effect on overall economics.
Capacity Matters
A mathematically valid break-even result may still be operationally impossible.
Suppose a restaurant needs 9,000 monthly customer visits to break even but its premises can realistically serve only 7,000.
The problem is not merely sales performance. The existing operating model lacks enough capacity to achieve break-even.
Likewise, a consulting business may calculate that it needs 1,200 billable hours each month even though its team can supply only 900.
Capacity should therefore be tested immediately after calculating break-even volume.
If required volume exceeds realistic capacity, management must change price, cost structure, capacity, product mix, or the business model.
Break-Even Analysis and Business Loans
A company considering additional borrowing should understand how the financing decision affects its required operating performance.
Interest expense may increase fixed financial obligations, while financed equipment could change productive capacity and costs.
A business loan payment analysis determines the financing schedule, but break-even analysis asks whether the resulting operation can generate enough contribution to support its expanded cost structure.
Debt decisions should also be reviewed through debt-to-income ratio or more business-appropriate leverage and coverage measures where relevant.
A project that appears profitable before financing commitments may look different once its full required cash outflows are considered.
Break-Even Analysis vs Payback Period
Break-even analysis and payback period address different decisions.
Break-even analysis asks when sales contribution covers operating costs.
Payback period asks how long it takes for cash inflows or benefits to recover an initial investment under the selected calculation method.
A new machine might reduce unit costs enough to lower the break-even point, but management may still want to know how long the original equipment investment takes to recover.
The two analyses can therefore complement each other without being interchangeable.
Break-Even Analysis vs ROI
ROI measures return relative to an investment under the chosen ROI definition.
Break-even analysis measures the sales or revenue threshold required to cover modeled costs.
A business can exceed break-even but still produce a return that is too low to justify the capital invested.
For example, a project that earns only $5,000 above break-even after requiring a $1 million investment technically generates profit but may still be economically unattractive.
Stopping at break-even would miss that distinction.
Break-Even Analysis vs Profit Analysis
Break-even establishes the point where modeled profit is zero.
Profit analysis evaluates what happens above or below that level.
Once break-even volume is known, expected operating profit can be estimated with:
Operating Profit = (Units Sold × Contribution Margin per Unit) − Fixed Costs
Suppose 6,000 units are sold with a $35 contribution margin and $150,000 of fixed costs.
Operating Profit = (6,000 × $35) − $150,000
Operating Profit = $210,000 − $150,000
Operating Profit = $60,000
The same cost-volume-profit relationship therefore supports break-even analysis and profit planning.
Common Break-Even Analysis Mistakes
One common mistake is classifying costs incorrectly.
If a cost rises with every additional sale but is treated as fixed, contribution margin will be overstated and break-even volume understated.
Another problem is assuming every unit sells at the same price. Discounts, customer tiers, channel commissions, and product mix can change the economics materially.
Businesses may also overlook capacity limits, step costs, taxes, financing obligations, or changes in demand caused by pricing decisions.
Perhaps the most important mistake is treating break-even as a forecast.
It is not.
Break-even analysis calculates what must occur under specified assumptions. A forecast estimates what management expects will actually occur.
Both are useful, but they answer different questions.
Limitations of Break-Even Analysis
The simplest model assumes stable prices, consistent variable costs, identifiable fixed costs, and a predictable relationship between sales volume and cost.
Real businesses are less tidy.
Supplier pricing may change with volume. Labor may include fixed and variable components. Capacity expansions can create step costs. Discounts can alter average prices. Product mix can shift. Demand can react to price changes.
As a result, break-even analysis should be viewed as a decision model rather than a perfect representation of future accounting results.
The assumptions should be documented, tested, and updated when circumstances change.
How to Use Break-Even Analysis Properly
Start by defining the period being analyzed. Mixing monthly fixed costs with annual revenue will produce meaningless results.
Next, separate fixed and variable costs using the best available information.
Calculate contribution margin per unit or contribution margin ratio, depending on whether unit or revenue analysis is more appropriate.
Then calculate the break-even threshold.
After that, test whether the required sales level is realistic given demand and operating capacity.
Finally, run scenarios for changes in price, costs, product mix, and sales volume.
The result should support a decision—not merely produce a number.
Frequently Asked Questions
What is break-even analysis?
Break-even analysis calculates the sales volume or revenue required for contribution to cover fixed costs under a specified set of assumptions.
What is the break-even analysis formula?
For units:
Break-Even Units = Fixed Costs ÷ (Selling Price per Unit − Variable Cost per Unit)
The denominator is contribution margin per unit.
How do you calculate break-even sales revenue?
Break-Even Revenue = Fixed Costs ÷ Contribution Margin Ratio
The contribution margin ratio expresses contribution margin as a percentage of revenue.
What does it mean to break even?
Breaking even means modeled revenue and costs result in zero profit and zero loss at the specified threshold.
Is break-even revenue the same as profit?
No. Break-even is the point at which modeled profit is zero. Profit begins only after contribution exceeds the fixed costs included in the model.
What is contribution margin?
Contribution margin is revenue remaining after variable costs. It contributes toward fixed costs first and toward profit after those fixed costs have been covered.
Do salaries count as fixed costs?
Some salaries may behave as fixed costs within a particular period and operating range, while other labor costs vary with activity. Classification should reflect how the cost actually behaves in the model.
Can break-even analysis be used for services?
Yes. A service business can define units as billable hours, consultations, appointments, subscriptions, projects, customers, or another meaningful service unit.
What happens when variable costs increase?
Higher variable costs reduce contribution margin when selling price remains unchanged. A smaller contribution margin increases the break-even sales requirement.
What happens when fixed costs increase?
If contribution margin remains constant, higher fixed costs increase the number of sales or amount of revenue needed to reach break-even.
Is a lower break-even point always better?
Not necessarily. A lower threshold may result from reduced investment or capacity that harms future growth. The economic consequences of the cost structure matter more than minimizing the ratio mechanically.
How often should break-even analysis be updated?
It should be updated whenever material assumptions change, including pricing, input costs, fixed expenses, product mix, capacity, or the operating model.
Final Perspective
Break-even analysis converts a cost structure into a measurable sales requirement.
Its foundation is contribution margin:
Break-Even Units = Fixed Costs ÷ Contribution Margin per Unit
However, the most useful insight rarely comes from the formula alone.
The analysis shows how pricing, variable costs, fixed costs, discounts, product mix, capacity, and target profit affect the amount a business must sell before its economics become profitable under the model.
That makes break-even analysis valuable not merely for finding a single point, but for testing decisions.
A useful break-even model should ultimately answer three questions:
Where is the threshold? What assumptions create it? What changes if those assumptions move?




