


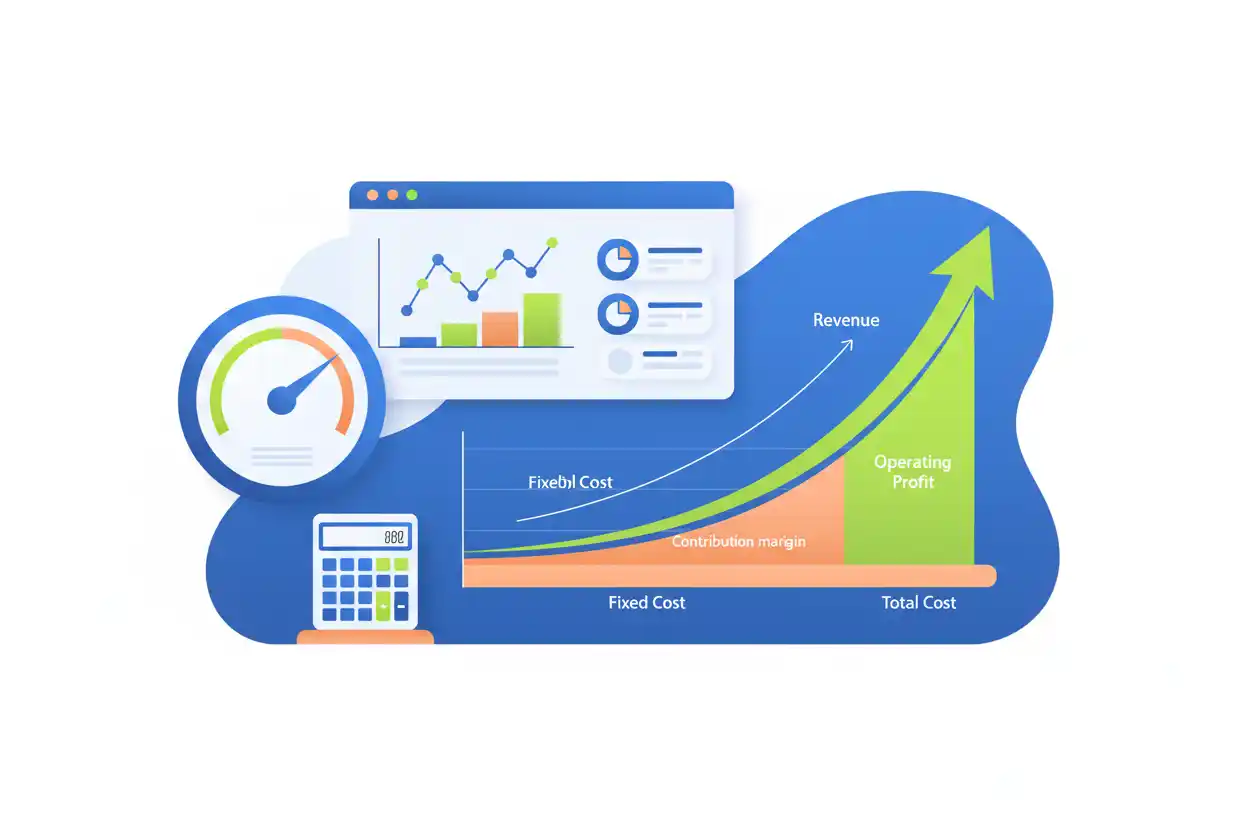
Operating leverage measures how sensitive a company’s operating profit is to changes in sales. A business with high operating leverage has a relatively large fixed-cost base compared with its variable costs, so a change in revenue can produce a much larger percentage change in operating profit.
Suppose sales increase 10% while operating profit rises 40%. The implied degree of operating leverage over that change is:
Degree of Operating Leverage = 40% ÷ 10% = 4.0
A degree of operating leverage, or DOL, of 4 means that around the measured activity level, a 1% change in sales corresponds to approximately a 4% change in operating profit when the underlying price, variable-cost relationship, and fixed-cost structure remain consistent.
That amplification works in both directions. High operating leverage can accelerate profit growth when sales rise, but it can also accelerate profit declines when revenue falls.
Within business finance, operating leverage helps connect sales volume, contribution margin, fixed costs, operating profit, and business risk.
What Is Operating Leverage?
Operating leverage describes the relationship between a company’s cost structure and the sensitivity of operating earnings to changes in sales.
The underlying distinction is between fixed costs and variable costs.
Fixed costs remain relatively stable across a relevant range of activity. Examples can include certain facility costs, salaried personnel, software commitments, equipment leases, and other expenses that do not immediately rise with each additional unit sold.
Variable costs change more directly with activity. Examples can include materials, transaction fees, certain commissions, packaging, and other costs incurred as additional units are produced or sold.
A company with substantial fixed costs can generate powerful profit expansion once sales exceed the level required to cover those costs.
That is operating leverage.
Operating Leverage Formula
The most general degree of operating leverage formula compares percentage changes:
Degree of Operating Leverage = % Change in Operating Profit ÷ % Change in Sales
If revenue rises by 8% and operating profit rises by 24%:
DOL = 24% ÷ 8%
DOL = 3.0
The observed operating-profit change is three times the percentage sales change.
For a simplified cost structure at a specified activity level, DOL can also be calculated using contribution margin:
Degree of Operating Leverage = Contribution Margin ÷ Operating Profit
Because contribution margin equals revenue minus variable costs:
DOL = (Revenue − Variable Costs) ÷ Operating Profit
For a single-product model:
DOL = Q(P − V) ÷ [Q(P − V) − F]
Where:
Q = quantity sold
P = selling price per unit
V = variable cost per unit
F = fixed operating costs
These point-in-time formulas assume the underlying cost relationships remain valid around the activity level being analyzed.
Operating Leverage Example
Suppose a company sells 10,000 units at $100 each.
Selling price per unit = $100
Variable cost per unit = $60
Units sold = 10,000
Fixed costs = $300,000
Revenue is:
Revenue = 10,000 × $100
Revenue = $1,000,000
Total variable costs are:
Variable Costs = 10,000 × $60
Variable Costs = $600,000
Contribution margin is:
Contribution Margin = $1,000,000 − $600,000
Contribution Margin = $400,000
Operating profit is:
Operating Profit = $400,000 − $300,000
Operating Profit = $100,000
The degree of operating leverage is:
DOL = $400,000 ÷ $100,000
DOL = 4.0
At this activity level, the company’s operating profit is highly sensitive to changes in sales.
What Does Operating Leverage of 4 Mean?
A DOL of 4 means a 1% change in sales is associated with approximately a 4% change in operating profit around the current operating level, assuming the cost and pricing relationships used in the calculation remain valid.
If sales increase by 10%:
Expected Operating Profit Change ≈ 4 × 10%
Expected Operating Profit Change ≈ 40%
Starting operating profit is $100,000.
A 40% increase would produce approximately:
$100,000 × 1.40 = $140,000
We can verify this directly.
If units rise 10% from 10,000 to 11,000:
Revenue becomes:
11,000 × $100 = $1,100,000
Variable costs:
11,000 × $60 = $660,000
Contribution margin:
$1,100,000 − $660,000 = $440,000
Fixed costs remain $300,000:
Operating Profit = $440,000 − $300,000
Operating Profit = $140,000
Sales increased 10%, while operating profit increased from $100,000 to $140,000—a 40% increase.
Operating Leverage Works Both Ways
Operating leverage does not only amplify growth.
Using the same example, suppose unit sales fall 10% from 10,000 to 9,000.
Revenue becomes:
9,000 × $100 = $900,000
Variable costs become:
9,000 × $60 = $540,000
Contribution margin:
$900,000 − $540,000 = $360,000
After $300,000 of fixed costs:
Operating Profit = $60,000
Operating profit fell from $100,000 to $60,000:
Percentage Decline = ($60,000 − $100,000) ÷ $100,000
Percentage Decline = −40%
A 10% sales decline therefore produced a 40% operating-profit decline.
This downside sensitivity is the central risk of high operating leverage.
Why Fixed Costs Create Operating Leverage
Assume a business has $500,000 of annual fixed operating costs.
Once those costs are covered, additional contribution margin can flow more rapidly into operating profit because the fixed-cost base does not immediately increase with each additional sale.
For example, suppose:
Revenue = $2,000,000
Variable costs = $1,200,000
Contribution margin = $800,000
Fixed costs = $600,000
Operating profit is:
$800,000 − $600,000 = $200,000
Now revenue increases by 20% to $2.4 million while the same variable-cost ratio and fixed-cost structure remain applicable.
Variable costs rise to:
$1,200,000 × 1.20 = $1,440,000
Contribution margin becomes:
$2,400,000 − $1,440,000 = $960,000
Fixed costs remain $600,000:
Operating Profit = $360,000
Revenue increased 20%.
Operating profit increased:
($360,000 − $200,000) ÷ $200,000 = 80%
The fixed-cost base allowed much of the incremental contribution margin to increase operating earnings.
Contribution Margin and Operating Leverage
Contribution margin is central to the point-in-time DOL calculation.
The basic relationship is:
Contribution Margin = Revenue − Variable Costs
Operating profit is then:
Operating Profit = Contribution Margin − Fixed Operating Costs
Therefore:
DOL = Contribution Margin ÷ Operating Profit
Suppose contribution margin equals $600,000 and fixed operating costs equal $450,000.
Operating profit is:
$600,000 − $450,000 = $150,000
DOL is:
$600,000 ÷ $150,000 = 4.0
The relatively small $150,000 operating profit is supported by $600,000 of contribution margin because $450,000 is absorbed by fixed costs.
That structure creates the leverage.
Another Operating Leverage Formula
Because:
Operating Profit = Contribution Margin − Fixed Costs
we can rearrange the relationship:
Contribution Margin = Operating Profit + Fixed Costs
Therefore:
DOL = (Operating Profit + Fixed Costs) ÷ Operating Profit
which becomes:
DOL = 1 + Fixed Costs ÷ Operating Profit
This version makes the role of fixed costs particularly visible.
If operating profit is $200,000 and fixed costs are $400,000:
DOL = 1 + $400,000 ÷ $200,000
DOL = 3.0
Again, this simplified formulation depends on the cost definitions and operating range assumed in the model.
High Operating Leverage
High operating leverage generally means operating earnings are highly sensitive to changes in revenue.
Businesses can have high operating leverage when they require substantial fixed infrastructure but have comparatively low incremental cost for additional sales.
Examples can include some software, media, telecommunications, manufacturing, transportation, platform, and infrastructure-intensive models.
However, industry labels alone do not determine DOL.
A company must be analyzed from its actual cost structure.
High operating leverage can be attractive when demand rises because operating profit may grow considerably faster than revenue.
It can be dangerous when sales weaken because fixed expenses remain while contribution margin contracts.
Low Operating Leverage
Low operating leverage generally means a larger portion of costs changes with sales and a smaller portion is fixed.
Suppose a company earns:
Revenue = $1,000,000
Variable costs = $700,000
Fixed costs = $100,000
Contribution margin:
$1,000,000 − $700,000 = $300,000
Operating profit:
$300,000 − $100,000 = $200,000
DOL:
$300,000 ÷ $200,000 = 1.5
A 10% sales change would correspond to approximately a 15% operating-profit change around that activity level under the model assumptions.
The business has lower operating sensitivity than the earlier company with DOL of 4.
Is High Operating Leverage Good or Bad?
Neither high nor low operating leverage is inherently good.
High operating leverage can generate rapid profit expansion when sales grow.
Low operating leverage can provide more protection when sales decline.
The appropriate structure depends on demand stability, competitive position, pricing power, customer concentration, fixed commitments, financing capacity, growth expectations, and management’s tolerance for volatility.
A company with highly predictable recurring sales may be able to support more fixed operating infrastructure comfortably.
A highly cyclical company may face greater risk from the same cost structure.
Operating leverage describes sensitivity. It does not declare the business good or bad.
Degree of Operating Leverage
The degree of operating leverage quantifies operating leverage numerically.
The percentage-change formula is:
DOL = % Change in Operating Profit ÷ % Change in Revenue
Suppose:
Revenue increases from $5 million to $5.5 million.
Percentage revenue growth:
($5.5M − $5M) ÷ $5M = 10%
Operating profit increases from $500,000 to $650,000.
Percentage operating-profit growth:
($650,000 − $500,000) ÷ $500,000 = 30%
Therefore:
DOL = 30% ÷ 10%
DOL = 3.0
Over that observed change, operating profit grew three times as fast as revenue on a percentage basis.
DOL Is Not Constant
A company’s degree of operating leverage generally changes as its sales level changes.
Return to the example:
Revenue = $1,000,000
Contribution margin = $400,000
Fixed costs = $300,000
Operating profit = $100,000
DOL:
$400,000 ÷ $100,000 = 4.0
Now suppose revenue doubles while the contribution-margin ratio and fixed costs remain unchanged.
New revenue = $2,000,000
New contribution margin = $800,000
Fixed costs = $300,000
Operating profit = $500,000
New DOL:
$800,000 ÷ $500,000 = 1.6
Operating leverage falls from 4.0 to 1.6 as the company moves farther above its break-even level.
The fixed costs still exist, but they represent a much smaller burden relative to contribution margin and operating profit.
Operating Leverage Near Break-Even
Operating leverage can become extremely high near the break-even point because operating profit approaches zero.
Suppose:
Contribution margin = $510,000
Fixed costs = $500,000
Operating profit:
$510,000 − $500,000 = $10,000
DOL:
$510,000 ÷ $10,000
DOL = 51
The mathematical DOL is 51.
A small change in sales can therefore produce an enormous percentage change in operating profit because the starting profit denominator is only $10,000.
This does not necessarily mean the company possesses an extraordinary economic advantage.
It means earnings are extremely sensitive because the business is operating close to break-even.
Operating Leverage at Break-Even
At exact break-even:
Operating Profit = $0
The point-in-time formula becomes:
DOL = Contribution Margin ÷ 0
Division by zero is undefined.
Therefore, DOL cannot be meaningfully calculated with this formula at exactly zero operating profit.
This is an important limitation when interpreting very high operating-leverage figures.
As operating profit approaches zero, the ratio can become unstable and less intuitive.
Operating Leverage and Break-Even Analysis
Operating leverage is closely related to break-even analysis.
For a simple single-product model:
Break-Even Units = Fixed Costs ÷ Contribution Margin per Unit
Suppose:
Selling price = $100
Variable cost = $60
Contribution margin per unit = $40
Fixed costs = $300,000
Break-even volume is:
$300,000 ÷ $40 = 7,500 Units
At 10,000 units, the company is 2,500 units above break-even and has DOL of 4.
As sales move farther above 7,500 units, DOL generally falls under the simplified model.
As sales move closer to 7,500 units, DOL rises.
The two concepts therefore describe different aspects of the same cost structure.
Margin of Safety and Operating Leverage
A business operating substantially above break-even has more room for sales to decline before operating profit reaches zero.
That cushion is sometimes described as a margin of safety.
High DOL often coincides with a smaller relative cushion above break-even because fixed costs consume a large share of contribution margin.
Suppose two companies each generate $1 million of revenue.
Company A earns $300,000 of operating profit.
Company B earns only $50,000.
If both have similar contribution margins, Company B will generally be much more sensitive to a comparable revenue decline because less operating profit remains above its fixed-cost burden.
Operating Leverage vs Financial Leverage
Operating leverage and financial leverage are different.
Operating leverage comes from the relationship between fixed operating costs and sales.
Financial leverage comes primarily from using debt or other financing arrangements with fixed financial obligations.
Operating leverage affects operating profit.
Financial leverage affects how changes in operating earnings can translate into earnings available after financing costs.
A company can have:
high operating leverage and little debt;
low operating leverage and high debt;
high levels of both; or
low levels of both.
The risks should be analyzed separately before considering their combined effect.
Operating Leverage vs Degree of Combined Leverage
The degree of combined leverage captures the combined sensitivity created by operating and financial leverage.
A common conceptual relationship is:
Degree of Combined Leverage = Degree of Operating Leverage × Degree of Financial Leverage
Suppose:
DOL = 3
Degree of financial leverage = 2
Then:
DCL = 3 × 2 = 6
Under the applicable assumptions, a 1% change in sales could correspond to approximately a 6% change in the relevant bottom-line earnings measure used by the model.
The combined metric belongs on its dedicated page because it adds financing sensitivity that operating leverage alone does not measure.
Operating Leverage vs Operating Profit
The workbook directly maps operating profit to this article.
Operating profit is an earnings amount.
Operating leverage measures the sensitivity of that earnings amount to changes in sales.
Suppose operating profit is $500,000.
That number alone does not reveal operating leverage.
To assess leverage, you need information about contribution margin, fixed costs, or how operating profit changes when revenue changes.
Two companies can report identical operating profit while having very different operating leverage.
Operating Leverage vs Operating Margin
Operating margin measures operating profit relative to revenue:
Operating Margin = Operating Profit ÷ Revenue × 100
Operating leverage asks how sensitive that operating profit is to a change in revenue.
Suppose:
Revenue = $1 million
Operating profit = $100,000
Operating margin:
$100,000 ÷ $1,000,000 = 10%
If contribution margin is $400,000:
DOL = $400,000 ÷ $100,000 = 4
The business therefore has a 10% operating margin and DOL of 4.
Those numbers describe different characteristics.
The margin describes the current level of profitability.
DOL describes profit sensitivity.
Operating Leverage and Margin Expansion
One visible outcome of favorable operating leverage can be operating-margin expansion.
Suppose:
Year 1 revenue = $1 million
Year 1 operating profit = $100,000
Operating margin:
10%
Year 2 revenue = $1.2 million
Operating profit = $180,000
Operating margin:
$180,000 ÷ $1.2 million = 15%
Revenue increased 20%, while operating profit increased 80%.
Because operating profit grew faster than sales, operating margin expanded from 10% to 15%.
This is the practical effect companies often refer to when discussing the ability to spread fixed operating expenses across a larger revenue base.
Negative Operating Leverage
Operating leverage can work negatively when revenue growth fails to cover increased operating costs or when sales decline against a sticky fixed-cost base.
Suppose revenue falls 10%, but many operating expenses cannot be reduced immediately.
Operating profit might fall 30%, 50%, or more.
Businesses sometimes describe this as negative operating leverage or operating deleverage.
The expression can also be used when operating expenses grow faster than revenue and margins contract.
The exact financial outcome depends on what caused costs and revenue to change.
Operating Deleverage Example
Suppose:
Year 1 revenue = $2 million
Variable costs = $1 million
Fixed costs = $700,000
Operating profit:
$2,000,000 − $1,000,000 − $700,000 = $300,000
Now revenue falls 15%.
New revenue:
$1,700,000
Assuming the 50% variable-cost ratio remains unchanged:
Variable Costs = $850,000
Fixed costs remain $700,000.
New operating profit:
$1,700,000 − $850,000 − $700,000 = $150,000
Revenue fell 15%.
Operating profit fell:
($150,000 − $300,000) ÷ $300,000 = −50%
The fixed cost structure magnified the downturn.
Operating Leverage and Gross Margin
Gross margin affects how much revenue remains available before operating expenses.
A company with high gross margin can still have either high or low operating leverage depending on its operating-cost structure.
Consider a software company with high gross margin and large fixed development and administrative expenses.
Its operating leverage can be substantial.
Another high-gross-margin business may outsource most functions and maintain a more variable cost structure.
Therefore:
High Gross Margin ≠ High Operating Leverage Automatically
Gross margin describes one profitability layer.
Operating leverage describes sensitivity created by the broader cost structure.
Operating Leverage and Gross Profit
Gross profit can increase rapidly with revenue, but the effect on operating profit depends on operating expenses.
Suppose incremental sales produce $1 million of additional gross profit.
If operating expenses increase by only $200,000:
Incremental Operating Profit = $800,000
That represents strong flow-through.
If operating expenses increase by $900,000:
Incremental Operating Profit = $100,000
The incremental gross profit is identical, but the operating-leverage outcome is very different.
Operating Leverage and Revenue
Revenue is the top-line driver in the DOL relationship.
Operating leverage becomes economically important because a given percentage change in revenue can create a larger percentage movement in operating earnings.
However, sales growth does not guarantee positive operating leverage.
If costs rise as quickly as or faster than revenue, operating profit may not accelerate.
Therefore, analysts should examine both revenue growth and expense behavior.
Operating Leverage and Net Profit Margin
The workbook maps net profit margin because favorable operating leverage can eventually improve bottom-line profitability, but the relationship is not automatic.
Net profit margin incorporates financing costs, taxes, and other items below operating profit.
A company can generate favorable operating leverage but experience little improvement in net margin if interest expense or taxes rise substantially.
Operating leverage therefore belongs primarily at the operating-profit level.
Operating Leverage and Operating Cash Flow
Operating cash flow provides a cash-based perspective on operations.
Favorable operating leverage can increase operating profit as sales grow, but operating cash flow may move differently because of receivables, inventory, payables, noncash expenses, and other working-capital changes.
For example, rapidly increasing sales can produce strong operating leverage while simultaneously consuming cash through additional inventory and customer receivables.
Earnings sensitivity and cash conversion should therefore be analyzed separately.
Operating Leverage and EBITDA
EBITDA can also show the effects of cost leverage when revenue grows faster than certain operating expenses.
However, DOL needs a clearly defined operating-profit measure and consistent cost framework.
Using EBITDA instead of operating profit changes what costs are included in the earnings measure.
If an analysis calculates leverage from EBITDA growth, it should be labeled accordingly rather than silently treating the number as identical to conventional EBIT- or operating-profit-based DOL.
Operating Leverage and EBIT
EBIT can correspond closely with operating profit in some analyses, although company reporting and non-operating items can create differences.
When EBIT is the defined operating earnings measure, a simplified DOL calculation may be written:
DOL = Contribution Margin ÷ EBIT
The denominator must represent the operating earnings level intended by the analysis.
Using net profit instead would introduce financing and tax effects and move beyond pure operating leverage.
Operating Leverage and Profit
Profit is a broad concept, whereas operating leverage specifically concerns how operating earnings respond to changes in sales.
A company may have positive profit while carrying high operating leverage.
Another may have thin operating profit but low fixed costs.
The profit number tells you the current outcome.
Operating leverage helps explain how quickly that outcome could change when revenue changes.
Operating Leverage and Unit Economics
Unit economics provides the building blocks for many operating-leverage calculations.
Suppose:
Selling price per unit = $100
Variable cost per unit = $40
Contribution margin per unit:
$100 − $40 = $60
If fixed costs are $600,000, every additional unit contributes $60 toward covering fixed costs and then operating profit under the simplified model.
At 10,000 units:
Contribution Margin = $600,000
Operating profit is zero.
At 15,000 units:
Contribution Margin = $900,000
Operating Profit = $300,000
Once fixed costs are covered, incremental unit contribution can have a large effect on operating profit.
Operating Leverage and Cost-Plus Pricing
Cost-plus pricing can influence contribution margin by determining how much selling price exceeds relevant variable or product costs.
However, a markup that looks attractive on an individual product does not automatically cover the company’s fixed operating structure.
Suppose each product generates $20 of contribution margin, but annual fixed costs equal $2 million.
The company still needs substantial sales volume before reaching operating profitability.
Operating leverage therefore links per-unit pricing economics with the scale of the fixed-cost base.
Operating Leverage in Software Businesses
Some software businesses can display substantial operating leverage because software development, engineering, administrative infrastructure, and platform costs may include significant fixed or semi-fixed components.
Once the platform can serve additional customers without costs rising proportionally with revenue, incremental sales may increase operating profit rapidly.
However, software is not automatically a high-operating-leverage business.
Cloud hosting, customer support, sales commissions, marketing, implementation, artificial-intelligence compute, and other expenses can scale materially with usage or revenue.
Actual financial data matters more than the industry label.
Operating Leverage in Manufacturing
Manufacturing businesses can have significant fixed costs from factories, machinery, maintenance capacity, supervision, and production infrastructure.
At low production volumes, those fixed costs are spread across relatively few units.
As production and sales increase, the cost per unit attributable to fixed capacity can decline within the relevant operating range.
Operating profit can then grow faster than revenue.
However, once existing capacity is exhausted, the company may need another factory, production line, shift, or equipment investment.
At that point, fixed costs can step upward and the old DOL relationship may no longer apply.
Operating Leverage in Retail
Retail businesses can also have operating leverage through store rent, salaried labor, distribution infrastructure, technology, and corporate overhead.
A store generating more sales without a proportionate increase in those expenses can produce stronger operating profit.
Yet many retail costs are mixed rather than perfectly fixed or variable.
Labor hours, payment fees, shipping, shrinkage, promotions, and fulfillment can change with volume.
Therefore, real-world retail operating leverage is generally more complex than a textbook two-cost model.
Operating Leverage in Service Businesses
A professional-services business may appear highly variable because labor is its primary cost, but the actual structure depends on staffing.
If most employees receive fixed salaries, the company can have substantial short-term operating leverage.
Revenue can increase through improved utilization without proportionate payroll growth.
Conversely, a firm relying heavily on freelancers or contractors paid directly for billable work may maintain a more variable cost structure.
Again, classification depends on actual economic behavior rather than the name of the industry.
Fixed Costs Are Not Fixed Forever
One limitation of operating-leverage models is the assumption that fixed costs remain fixed.
In reality, fixed costs are generally fixed only within a relevant range and for a particular period.
A company may need another warehouse after sales exceed a threshold.
A software business may need additional server capacity.
A retailer may need another store.
A manufacturer may add a production line.
These are sometimes described as step costs because expenses remain stable for a range and then jump when capacity expands.
DOL calculated at one operating level should not automatically be extrapolated far beyond that level.
Variable Costs Are Not Always Constant Per Unit
The simple operating-leverage model often assumes variable cost per unit remains constant.
Actual variable costs can change because of volume discounts, overtime, supply shortages, shipping rates, product mix, efficiency changes, or pricing from suppliers.
Suppose variable cost falls from $60 to $55 per unit as production expands.
Operating profit can increase faster than predicted by a model that assumes a constant $60 variable cost.
The opposite happens when incremental production becomes more expensive.
Operating leverage is therefore a model of sensitivity, not a guarantee of exact future earnings.
Product Mix Can Change DOL
Multi-product businesses complicate operating leverage further.
Suppose Product A has a 70% contribution margin and Product B has a 20% contribution margin.
If sales growth comes mostly from Product A, operating profit can expand rapidly.
If the same revenue growth comes primarily from Product B, the profit effect can be much smaller.
Therefore, sales-mix changes can alter the effective contribution-margin ratio and the company’s DOL.
A revenue forecast that ignores product mix can misestimate future operating earnings.
Price Changes Can Affect Operating Leverage
The standard DOL interpretation assumes a relatively stable relationship among selling prices, variable costs, and fixed costs around the measured level.
If prices rise while unit volume remains unchanged, contribution margin per unit may increase significantly.
Operating profit can then grow even without equivalent unit growth.
Conversely, discounting can reduce contribution margin and weaken operating economics even when unit sales rise.
When explaining an actual change in operating profit, separate:
volume effects, price effects, cost effects, and fixed-cost effects.
Operating Leverage During Rapid Growth
Rapid growth can reveal attractive operating leverage when revenue expands faster than the expense base.
Suppose:
Year 1 revenue = $10 million
Operating profit = $1 million
Year 2 revenue = $12 million
Operating profit = $1.8 million
Revenue growth:
20%
Operating profit growth:
80%
Observed DOL:
80% ÷ 20% = 4.0
Operating margin also expands:
Year 1:
$1M ÷ $10M = 10%
Year 2:
$1.8M ÷ $12M = 15%
This combination—revenue growth, faster operating-profit growth, and margin expansion—is a clear practical example of favorable operating leverage.
Operating Leverage During a Downturn
The opposite pattern can occur during declining demand.
Suppose:
Year 1 revenue = $10 million
Operating profit = $1 million
Year 2 revenue = $9 million
Operating profit = $600,000
Sales declined:
−10%
Operating profit declined:
−40%
Observed DOL:
−40% ÷ −10% = 4.0
The same leverage that supported rapid earnings growth in an expansion amplifies the decline.
This symmetry is why high operating leverage increases business risk when demand is uncertain.
Operating Leverage and Forecasting
DOL can be useful for short-range scenario analysis.
Suppose current operating profit is $5 million and DOL is estimated at 2.5.
Management forecasts a 6% increase in sales.
A rough sensitivity estimate is:
Expected Operating Profit Change ≈ 2.5 × 6%
Expected Operating Profit Change ≈ 15%
Estimated operating profit becomes:
$5 million × 1.15 = $5.75 million
This is a sensitivity estimate, not a complete forecast.
If prices, product mix, fixed costs, variable rates, capacity, or efficiency change, actual operating profit may differ substantially.
Why DOL Should Not Be Applied Too Far
Suppose current DOL is 5.
It would be dangerous to assume that a 100% sales increase automatically causes a 500% operating-profit increase.
DOL describes local sensitivity around the activity level and cost structure used in the calculation.
Large changes in sales can trigger new factories, employees, systems, marketing programs, supplier terms, or product-mix changes.
As the company moves farther from the initial level, DOL itself can change significantly.
Use the ratio for sensitivity—not unlimited extrapolation.
Negative DOL
When operating profit is negative, the contribution-margin-over-operating-profit formula can produce a negative DOL.
For example:
Contribution margin = $400,000
Fixed costs = $500,000
Operating profit = −$100,000
Then:
DOL = $400,000 ÷ −$100,000
DOL = −4
Although mathematically calculable, interpretation becomes less intuitive when the company is already operating at a loss.
A sales increase can make the loss smaller, causing percentage-change calculations to behave differently from ordinary profitable-company examples.
For businesses near or below break-even, scenario analysis in actual dollars is often clearer than relying on DOL alone.
Operating Leverage and Business Risk
High operating leverage increases sensitivity to uncertainty in sales.
If demand is stable and growing, that sensitivity can be beneficial.
If demand is volatile, forecasting errors have a larger effect on operating profit.
Suppose management forecasts $100 million of revenue but actual sales are 5% lower.
A low-DOL business might experience only a modest earnings shortfall.
A high-DOL business may experience a much larger percentage decline in operating earnings.
This does not necessarily make high operating leverage undesirable. It makes accurate understanding of demand and cost commitments more important.
Ways a Business Can Reduce Operating Leverage
A company can sometimes reduce operating leverage by converting fixed commitments into variable costs.
For example, it might use outsourcing, contract labor, usage-based infrastructure, third-party logistics, or flexible capacity instead of owning or staffing everything internally.
Doing so can lower downside sensitivity.
However, more variable costs may reduce the amount of profit that flows through when revenue grows.
The decision therefore involves a tradeoff between flexibility and upside leverage.
Ways a Business Can Increase Operating Leverage
A business can increase operating leverage when it invests in fixed infrastructure that allows revenue to grow without proportional increases in variable cost.
Automation can sometimes create this effect.
Owning equipment rather than outsourcing production can also increase fixed costs while reducing variable cost per unit.
Software platforms may invest heavily upfront and then support additional customers at relatively low incremental cost.
Again, higher operating leverage is not automatically superior. The economics depend on whether expected volume justifies the fixed commitment.
Operating Leverage and Automation
Automation often shifts part of the cost structure from variable labor or outsourced activity toward fixed technology, equipment, software, or development costs.
Suppose a process costs $10 per unit when outsourced.
A company considers investing $1 million in equipment that reduces variable cost to $3 per unit.
The automated model creates more fixed cost but potentially much lower incremental cost.
At high volume, the investment may generate strong economics.
At low volume, the fixed commitment may become a burden.
The decision therefore depends on expected volume, contribution, capital requirements, and risk—not operating leverage alone.
Operating Leverage and NFT Profit
The workbook maps NFT profit as a neighboring specialist concept.
An individual NFT transaction can generate a positive profit after purchase price, marketplace fees, royalties, and network costs.
That says little about the operating leverage of an NFT-related business.
A project may carry significant fixed development, artwork, community, platform, and administrative expenses. Once those costs are covered, additional transactions may create substantial earnings leverage.
Individual transaction economics and company-level operating leverage should therefore remain separate.
Common Operating Leverage Mistakes
A frequent mistake is assuming high operating leverage simply means a company has high fixed costs.
Fixed costs matter, but leverage depends on their relationship with contribution margin and operating profit.
Another mistake is treating DOL as constant across all revenue levels.
The ratio can fall substantially as a business moves farther above break-even.
Analysts can also confuse operating leverage with financial leverage.
Another error is applying a current DOL to very large sales changes even when the company’s cost structure would clearly change.
A fifth mistake is assuming favorable revenue growth automatically creates favorable operating leverage. Costs may rise faster than sales.
Finally, DOL becomes unstable around zero operating profit, so extreme values near break-even need careful interpretation.
Limitations of Operating Leverage
Operating leverage is useful for understanding earnings sensitivity, but it simplifies real businesses.
Costs are rarely perfectly fixed or perfectly variable.
Prices can change.
Product mix changes.
Capacity constraints create step costs.
Variable costs can rise or fall with volume.
Management can adjust spending in response to demand.
Acquisitions and divestitures can alter the cost structure.
Accounting classifications can also differ between businesses.
For these reasons, DOL works best as a sensitivity framework combined with detailed cost and scenario analysis rather than as a permanent characteristic of a company.
How to Analyze Operating Leverage Properly
Start with the company’s contribution margin or a defensible approximation of its variable and fixed operating cost structure.
Then calculate operating profit at the current activity level.
Use:
DOL = Contribution Margin ÷ Operating Profit
when the simplified cost model is appropriate.
Next, test modest increases and decreases in sales directly rather than relying only on the ratio.
Examine whether fixed costs remain fixed under those scenarios.
Check for capacity constraints and step costs.
Then compare the resulting operating-profit change with changes in operating margin and cash flow.
Finally, assess how financial leverage could amplify the operating risk further.
This approach keeps DOL connected to the economic structure that creates it.
Why Operating Leverage Matters
Operating leverage explains why two companies with identical sales growth can experience very different profit growth.
The core percentage-change relationship is:
Degree of Operating Leverage = % Change in Operating Profit ÷ % Change in Sales
For a simplified fixed-and-variable cost structure:
DOL = Contribution Margin ÷ Operating Profit
A higher DOL means operating profit is more sensitive to changes in sales.
That sensitivity creates upside when sales rise and downside when sales fall.
The effect is generally strongest near break-even and declines as a company moves farther above its fixed-cost base, assuming the underlying cost relationships remain stable.
Operating leverage is therefore not simply a measure of fixed costs. It is a measure of how the company’s cost structure converts changes in sales into changes in operating earnings.
Frequently Asked Questions
What is operating leverage in simple terms?
Operating leverage measures how strongly operating profit changes when sales change. Businesses with larger fixed-cost commitments relative to their variable costs often have greater operating-profit sensitivity.
What is the operating leverage formula?
The general formula is:
DOL = % Change in Operating Profit ÷ % Change in Sales
For a simplified cost structure at a specific activity level:
DOL = Contribution Margin ÷ Operating Profit
What does operating leverage of 3 mean?
A DOL of 3 means a 1% change in sales corresponds to approximately a 3% change in operating profit around the measured activity level, assuming the relevant cost and pricing relationships remain stable.
Is high operating leverage good?
It can be beneficial when sales grow because operating profit may rise faster than revenue. However, it also increases downside sensitivity when sales decline. High operating leverage therefore creates both opportunity and risk.
What causes high operating leverage?
High operating leverage generally results when a business has substantial fixed operating costs and relatively lower incremental variable costs. The exact DOL also depends on contribution margin and current operating profit.
What causes low operating leverage?
Low operating leverage generally occurs when more costs vary with sales and fixed operating costs are comparatively smaller. Profit then tends to move less dramatically in percentage terms when revenue changes.
Why does operating leverage fall as sales increase?
Under a simplified fixed-cost model, operating profit grows as additional contribution margin is earned while fixed costs remain stable. Because operating profit becomes larger relative to contribution margin, the DOL ratio generally declines.
Why is operating leverage high near break-even?
Near break-even, operating profit is very small. Since operating profit is the denominator in the contribution-margin-based DOL formula, a small denominator can produce a very high leverage figure.
Can operating leverage be negative?
Yes, mathematically, when operating profit is negative. However, DOL becomes harder to interpret around losses and break-even, so direct scenario analysis is often more informative.
What is the difference between operating leverage and financial leverage?
Operating leverage arises from fixed operating costs and affects operating-profit sensitivity. Financial leverage arises from financing obligations such as debt and affects earnings after financing costs.
What is the difference between operating leverage and operating margin?
Operating margin measures current operating profit as a percentage of revenue. Operating leverage measures how sensitive operating profit is to changes in revenue.
Does operating leverage stay constant?
No. DOL can change with sales volume, pricing, variable costs, fixed costs, product mix, capacity, and other operating conditions. It should generally be treated as a sensitivity measure around a specified activity level rather than a permanent constant.




