


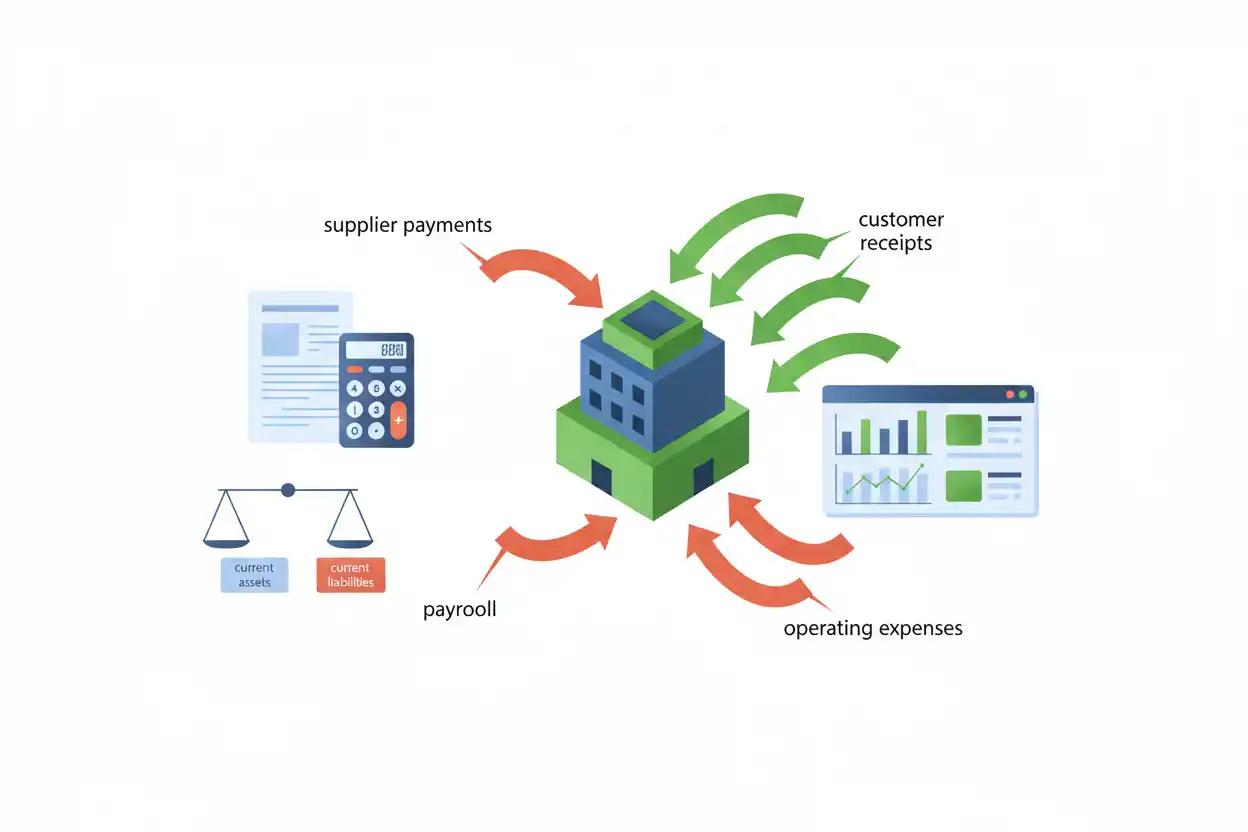
Operating cash flow measures the net cash a business generates or uses through its core operating activities during a period. It shows whether day-to-day operations are actually bringing cash into the business after accounting for operating receipts, operating payments, noncash income-statement items, and relevant changes in working capital.
A company can report positive accounting profit while generating weak or negative operating cash flow. The reverse can also happen. That distinction exists because accrual accounting records revenue and expenses based on accounting recognition rules, while operating cash flow tracks the related movement of cash.
For example, suppose a business reports $180,000 of net profit but also has depreciation, growing receivables, changing inventory, and higher accounts payable. After reconciling those items, its operating cash flow could be $225,000.
Operating cash flow is therefore a central measure within business finance because it connects reported earnings with the cash generated by the underlying business.
What Is Operating Cash Flow?
Operating cash flow, often abbreviated OCF, is the net amount of cash provided by or used in a company’s operating activities.
It appears in the operating section of the cash flow statement.
Operating activities generally relate to the company’s principal revenue-producing operations rather than investing in long-term assets or raising and repaying capital.
Conceptually:
Operating Cash Flow = Operating Cash Inflows − Operating Cash Outflows
A positive result means operating activities generated more cash than they consumed during the period.
A negative result means operating activities consumed more cash than they generated.
However, the reported calculation depends on whether the cash flow statement uses the direct method or indirect method.
Operating Cash Flow Formula
There is not one single line-item formula that works identically for every company because operating cash flows can contain many adjustments.
Two approaches are useful.
Under the direct method:
Operating Cash Flow = Cash Received From Operating Activities − Cash Paid for Operating Activities
Under the indirect method, the calculation begins with net profit or net income and reconciles that accounting result to cash generated from operations:
Operating Cash Flow = Net Income + Noncash Expenses − Noncash Gains + Noncash Losses ± Changes in Operating Assets and Liabilities ± Other Operating Adjustments
A simplified analytical version often looks like:
OCF ≈ Net Income + Depreciation & Amortization ± Working Capital Adjustments + Other Noncash Adjustments
The word approximately matters. Real cash flow statements can contain many additional reconciling items beyond depreciation and the most familiar working-capital accounts.
Direct Method vs Indirect Method
The direct and indirect methods arrive at operating cash flow from different directions.
The direct method presents major categories of operating cash receipts and payments, such as cash collected from customers and cash paid to suppliers or employees.
The indirect method starts with accounting earnings and adjusts that figure until it reflects cash generated or used by operating activities.
Under consistent classifications, the methods describe the same operating cash-flow result even though the presentation is different.
The indirect method is particularly useful for understanding why accounting earnings differ from cash flow because each reconciliation item explains part of the gap.
How the Indirect Operating Cash Flow Formula Works
The indirect approach typically begins with net income.
Then, noncash items are adjusted.
For example, depreciation expense lowers accounting earnings without requiring an equivalent current-period cash payment. Consequently, depreciation is commonly added back when reconciling net income to operating cash flow.
Next, changes in operating assets and liabilities are incorporated.
This is where working capital becomes important.
An increase in certain operating assets generally uses cash.
An increase in certain operating liabilities generally preserves or provides cash, at least temporarily.
The exact sign depends on the account.
Operating Cash Flow Example Using the Indirect Method
Suppose a company reports:
Net income: $180,000
Depreciation and amortization: $50,000
Other noncash expense: $10,000
Gain on asset disposal: $5,000
Increase in accounts receivable: $35,000
Decrease in inventory: $20,000
Increase in accounts payable: $15,000
Decrease in accrued operating liabilities: $10,000
Start with net income:
$180,000
Add depreciation and amortization:
$180,000 + $50,000 = $230,000
Add the other noncash expense:
$230,000 + $10,000 = $240,000
Subtract the noncash gain:
$240,000 − $5,000 = $235,000
Subtract the increase in receivables:
$235,000 − $35,000 = $200,000
Add the decrease in inventory:
$200,000 + $20,000 = $220,000
Add the increase in accounts payable:
$220,000 + $15,000 = $235,000
Subtract the decrease in accrued liabilities:
$235,000 − $10,000 = $225,000
Therefore:
Operating Cash Flow = $225,000
The company reports $180,000 of net income but generates $225,000 of operating cash flow because the combined noncash and working-capital adjustments add $45,000 to cash flow.
Why Depreciation Is Added Back
Depreciation reduces accounting profit, but the expense does not represent the purchase of a new asset during the period in which depreciation is recognized.
Suppose a company purchased equipment for cash several years ago.
The historical purchase affected cash when the equipment was acquired. Accounting rules may then allocate that equipment cost across several later periods as depreciation.
If depreciation expense for the current year is $40,000, net income is $40,000 lower because of that expense.
However, the company did not necessarily pay another $40,000 in cash this year merely because depreciation was recorded.
Therefore, under the indirect method:
Net Income + Depreciation Expense = Earnings Adjusted for That Noncash Expense
This does not mean depreciation has no economic significance. Assets wear out and often eventually require replacement. It simply means depreciation expense and current-period cash expenditure occur on different timelines.
How Accounts Receivable Affects Operating Cash Flow
An increase in accounts receivable generally reduces operating cash flow under the indirect method.
Suppose a company records $100,000 of additional revenue but customers have not yet paid that amount.
Accounting income can rise even though cash has not yet been received.
If accounts receivable increases by $100,000:
Operating Cash Flow Adjustment = −$100,000
The adjustment removes cash that is included economically in accrual earnings but has not yet been collected.
Conversely, a decline in accounts receivable generally adds to operating cash flow because the company collected more cash from customers than the amount represented by current-period credit revenue alone.
Receivables Collection and Operating Cash Flow
Changes in receivables become easier to interpret when combined with receivables turnover.
If revenue is rising but receivables are rising much faster, the company may be converting a smaller portion of reported sales into cash.
The related days sales outstanding measure can show whether customers are taking longer to pay.
A company can therefore report healthy revenue and profit growth while operating cash flow weakens because more cash remains tied up in unpaid invoices.
That does not automatically mean the reported revenue is problematic, but it is a signal worth investigating.
How Inventory Affects Operating Cash Flow
Inventory purchases generally consume cash before the related inventory is sold.
Suppose inventory increases by $75,000 during the period.
Under a simplified indirect reconciliation:
Increase in Inventory = −$75,000 Operating Cash Flow Adjustment
The business has committed additional cash to products that remain on hand.
If inventory decreases by $75,000:
Decrease in Inventory = +$75,000 Operating Cash Flow Adjustment
The cash-flow effect should still be interpreted in context.
A reduction in inventory can reflect efficient stock management, but it can also result from supply shortages, deliberate liquidation, or weakening purchasing activity.
The inventory turnover ratio helps place the balance change within the company’s broader inventory economics.
How Accounts Payable Affects Operating Cash Flow
An increase in accounts payable generally increases operating cash flow under the indirect method.
Suppose the company buys goods or services but has not yet paid suppliers.
Expenses or inventory may be recognized, yet the cash remains temporarily in the business.
If accounts payable increases by $60,000:
Operating Cash Flow Adjustment = +$60,000
If accounts payable decreases by $60,000:
Operating Cash Flow Adjustment = −$60,000
A falling payable balance can therefore reduce operating cash flow because the business paid suppliers faster or settled obligations accumulated in earlier periods.
Working Capital Adjustment Rules
A useful shorthand is:
| Change | Typical OCF Effect |
|---|---|
| Operating asset increases | Decreases OCF |
| Operating asset decreases | Increases OCF |
| Operating liability increases | Increases OCF |
| Operating liability decreases | Decreases OCF |
These are directional rules, not substitutes for reading the company’s actual cash flow statement.
Specific classifications and unusual transactions can require additional analysis.
Operating Cash Flow and Days Payable Outstanding
The timing of supplier payments can materially affect cash generation.
Days payable outstanding helps show how long the business takes to pay suppliers.
If a company extends its payment cycle, accounts payable may increase and operating cash flow can improve temporarily.
That does not necessarily mean underlying profitability improved.
The company may simply be retaining cash for longer before paying suppliers.
Likewise, reducing overdue balances can lower operating cash flow in a period while improving supplier relationships and balance-sheet quality.
Operating Cash Flow and the Cash Conversion Cycle
The cash conversion cycle connects inventory, receivables, and payables into a broader measure of how long operating cash remains tied up.
A simplified formulation is:
Cash Conversion Cycle = DIO + DSO − DPO
If inventory moves faster, customers pay sooner, or supplier terms lengthen appropriately, the operating cycle may require less cash.
As a result, the company can potentially generate stronger operating cash flow without necessarily increasing accounting profit.
This is one reason working-capital management can have a large effect on cash generation.
Direct Method Operating Cash Flow Example
Suppose a business reports the following cash activity:
Cash collected from customers = $1,150,000
Cash paid to suppliers = $650,000
Cash paid to employees = $250,000
Taxes and other operating cash payments = $90,000
Then:
Operating Cash Flow = $1,150,000 − $650,000 − $250,000 − $90,000
Operating Cash Flow = $160,000
The direct approach makes the cash movements intuitive because it shows actual categories of operating receipts and payments.
The indirect method would instead begin with net income and reconcile accrual accounting differences until it reached the same operating cash-flow total under the same reporting framework and classifications.
Operating Cash Flow vs Net Profit
Operating cash flow and net profit often move in the same general direction over long periods, but they can differ significantly in individual periods.
Net profit measures accounting earnings.
Operating cash flow measures operating cash movements.
Suppose:
Net profit = $200,000
Depreciation = $80,000
Increase in receivables = $100,000
Increase in inventory = $50,000
Increase in accounts payable = $30,000
A simplified reconciliation gives:
OCF = $200,000 + $80,000 − $100,000 − $50,000 + $30,000
OCF = $160,000
The company reports $200,000 of profit but generates only $160,000 of operating cash flow.
The $40,000 difference results from the combined noncash and working-capital adjustments.
Can Operating Cash Flow Be Higher Than Net Profit?
Yes.
Suppose:
Net profit = $100,000
Depreciation and other noncash expenses = $120,000
Decrease in receivables = $30,000
Increase in inventory = $25,000
Decrease in payables = $15,000
Then:
OCF = $100,000 + $120,000 + $30,000 − $25,000 − $15,000
OCF = $210,000
Operating cash flow is more than twice net profit.
That does not automatically mean the business is performing exceptionally well. A large depreciation add-back may reflect a capital-intensive asset base, while a reduction in receivables could be temporary.
The drivers should always be examined.
Can Operating Cash Flow Be Lower Than Net Profit?
Yes.
A company can report strong earnings while cash remains tied up in working capital.
Suppose:
Net profit = $300,000
Depreciation = $50,000
Receivables increase = $150,000
Inventory increases = $120,000
Payables increase = $30,000
Then:
OCF = $300,000 + $50,000 − $150,000 − $120,000 + $30,000
OCF = $110,000
The business reports $300,000 of net profit but only $110,000 of operating cash flow.
Rapid growth can create exactly this pattern because more cash becomes tied up in inventory and customer receivables.
Positive Operating Cash Flow
Positive operating cash flow means operating activities generated net cash during the period.
For example:
Operating Cash Inflows = $1,400,000
Operating Cash Outflows = $1,050,000
Therefore:
Operating Cash Flow = $350,000
Positive OCF can provide cash for capital expenditures, debt repayment, acquisitions, dividends, share repurchases, or increases in cash reserves.
However, positive operating cash flow by itself does not mean the business has enough cash for every obligation or investment.
The size and sustainability of the cash flow matter.
Negative Operating Cash Flow
Negative operating cash flow means operating activities consumed cash.
Suppose:
Operating cash inflows = $800,000
Operating cash outflows = $950,000
Then:
Operating Cash Flow = −$150,000
A negative result is often a warning sign, but the circumstances matter.
A fast-growing company may temporarily consume cash because inventory and receivables increase rapidly.
A seasonal company may have negative OCF in one quarter and strongly positive OCF later.
An established business with persistent negative operating cash flow deserves greater scrutiny because operations continually require financing from cash reserves, borrowing, asset sales, or new capital.
Operating Cash Flow vs Free Cash Flow
Operating cash flow stops before many investing cash outlays.
Free cash flow typically goes further by deducting capital expenditures under a common simplified definition.
Free Cash Flow = Operating Cash Flow − Capital Expenditures
Suppose:
Operating cash flow = $800,000
Capital expenditures = $500,000
Then:
Free Cash Flow = $800,000 − $500,000
Free Cash Flow = $300,000
The company generates $800,000 from operations but retains only $300,000 after the stated capital expenditures.
That distinction is especially important for asset-intensive companies.
Strong operating cash flow can coexist with weak free cash flow when maintaining or expanding the asset base requires substantial investment.
Operating Cash Flow vs EBITDA
EBITDA is an earnings measure rather than a cash-flow measure.
It excludes interest, taxes, depreciation, and amortization under its standard construction, but it does not automatically incorporate actual movements in receivables, inventory, payables, and other operating balances.
Suppose a rapidly growing company reports high EBITDA while accounts receivable and inventory consume substantial cash.
Its operating cash flow can be much lower than EBITDA.
Similarly, collecting old receivables or temporarily increasing payables can cause OCF to exceed EBITDA.
Consequently:
EBITDA ≠ Operating Cash Flow
The two can move together, but they are not interchangeable.
Operating Cash Flow vs EBIT
EBIT is also an accounting earnings measure.
EBIT focuses on earnings before interest and taxes.
Operating cash flow reconciles accrual accounting with actual operating cash movement.
A company with strong EBIT may have weak OCF because customers have not paid or inventory has increased.
Likewise, substantial noncash expenses can make EBIT appear lower than operating cash flow.
For cash-generation analysis, EBIT therefore provides useful profitability context but does not replace the cash flow statement.
Operating Cash Flow vs Operating Profit
Operating profit shows accounting earnings from operations after relevant operating expenses.
Operating cash flow shows the cash generated or used by operating activities.
Suppose a company sells products on credit and reports an operating profit immediately, but customers will not pay for 90 days.
Operating profit recognizes the earnings effect.
Operating cash flow reflects the fact that cash has not yet arrived.
This timing difference is one of the most important distinctions between accrual profitability and cash generation.
Operating Cash Flow vs Operating Margin
The workbook maps operating margin directly to this page because both measures examine operating performance from different perspectives.
Operating margin asks:
How much operating profit does the business generate from each dollar of revenue?
Operating cash flow asks:
How much cash did operating activities actually generate or consume?
A company can have a healthy operating margin but weak OCF because of working-capital growth.
Another company may report a modest operating margin but temporarily strong OCF because it collected old receivables or reduced inventory.
Profitability and cash conversion should therefore be evaluated together.
Operating Cash Flow vs Net Profit Margin
Net profit margin expresses final accounting profit as a percentage of revenue.
Operating cash flow is a dollar cash-flow amount.
A 15% net profit margin therefore does not mean the business collected 15 cents of operating cash for every revenue dollar.
The actual cash result can differ because of noncash expenses and changes in operating assets and liabilities.
For comparative analysis, a company with attractive reported margins but consistently weak operating cash generation deserves additional investigation.
Operating Cash Flow Margin
Operating cash flow can be normalized by revenue using an operating cash-flow margin.
A common analytical formula is:
Operating Cash Flow Margin = Operating Cash Flow ÷ Revenue × 100
Suppose revenue is $5 million and OCF is $750,000:
Operating Cash Flow Margin = $750,000 ÷ $5,000,000 × 100
Operating Cash Flow Margin = 15%
This means the company’s operating cash flow equals 15% of revenue for the period.
However, this is a secondary analytical ratio. The core operating cash flow metric remains the dollar amount reported from operating activities.
Operating Cash Flow and Operating Leverage
The workbook also maps operating leverage to this article.
A business with substantial fixed operating costs can experience large swings in operating profit when revenue changes.
Those changes can eventually affect operating cash generation, although OCF also depends on working-capital timing and noncash expenses.
For example, rapid sales growth can increase operating profit while temporarily reducing cash flow if the company must build inventory and extend credit to customers.
Operating leverage explains sensitivity in earnings economics.
Operating cash flow shows what actually happened to operating cash during the period.
Operating Cash Flow and Interest Coverage
Strong operating cash flow can provide useful context when evaluating interest coverage, but the measurements are not substitutes.
Interest coverage generally compares an earnings measure with interest expense.
Operating cash flow measures cash generated by operations.
A business can have satisfactory EBIT-based coverage yet weak cash conversion.
Likewise, temporarily strong cash collections can improve OCF without creating a permanent improvement in earnings capacity.
Debt analysis should therefore examine both earnings coverage and actual cash generation.
Operating Cash Flow and Liquidity
Liquidity ratios generally provide a balance-sheet snapshot of short-term financial capacity.
Operating cash flow shows cash generation across a period.
This distinction matters.
A company may hold significant current assets today and report comfortable liquidity while consistently consuming cash through operations.
Another company can operate with a modest balance-sheet liquidity cushion but generate reliable operating cash every month.
Combining snapshot ratios with cash-flow trends provides a more complete view of near-term financial strength.
Operating Cash Flow and the Current Ratio
The current ratio compares current assets with current liabilities.
Operating cash flow does not directly enter the formula.
However, persistent positive OCF can help replenish cash balances and support the company’s ability to meet current obligations.
Conversely, negative OCF can gradually weaken liquidity even when the starting current ratio appears healthy.
The ratio shows the current balance-sheet position.
Operating cash flow shows whether ongoing business activity is strengthening or weakening the cash position over time.
Operating Cash Flow and Asset Efficiency
Operating cash generation can also be considered alongside asset turnover.
Asset turnover measures how much revenue is generated from the asset base.
Operating cash flow measures how much operating cash is produced from the business’s activities.
Two companies can generate identical revenue from similar asset levels while converting that revenue into very different amounts of cash because their margins, receivable terms, inventory requirements, supplier terms, and operating costs differ.
Combining efficiency and cash-generation measures can therefore reveal differences that either metric alone would miss.
Operating Cash Flow and Growth
Growth can increase or decrease operating cash flow depending on the business model.
Suppose a business grows revenue 50%.
If customers pay immediately and the company carries little inventory, the growth can generate substantial additional operating cash.
If customers pay after 120 days and inventory must be purchased months before sale, the same 50% growth could consume cash.
This is why growth is not automatically cash-generative.
Fast-growing businesses often need detailed cash flow forecasting because reported sales growth can mask the amount of financing required to support receivables, inventory, payroll, and other operating commitments.
Operating Cash Flow and Business Valuation
Operating cash flow can provide useful context for business valuation, but it should not automatically be used as the final valuation cash-flow measure.
Valuation models may require adjustments for capital expenditures, financing perspective, taxes, working capital, nonrecurring items, and other factors.
A business generating strong OCF may still require significant investment merely to maintain its productive capacity.
Conversely, a company with temporarily weak OCF may be investing working capital to support high-value future growth.
Operating cash flow is therefore an important starting point, not a complete valuation model.
Operating Cash Flow and NFT Profit
The workbook maps NFT profit as a neighboring specialist page.
Transaction-level NFT profit measures the economics of a particular digital-asset purchase and sale after relevant transaction costs.
Operating cash flow operates at the business level and captures cash generated or consumed by the company’s operating activities.
An NFT-related business could report profitable individual transactions while overall operating cash flow remains negative because payroll, development, marketing, infrastructure, and working-capital demands consume more cash than the transactions generate.
The two metrics therefore occupy different levels of analysis.
Cash Flow Quality and Earnings Quality
Analysts often compare net profit with operating cash flow to understand how strongly accounting earnings translate into cash.
Suppose net profit grows steadily for several years while operating cash flow consistently declines.
That gap can result from legitimate business changes, such as rapid credit sales or inventory buildup.
However, it can also indicate that reported earnings are not converting into cash as effectively as before.
Possible areas to inspect include receivables, inventory, payables, noncash gains, capitalization practices, unusual accruals, and one-time adjustments.
No single OCF-to-profit pattern proves that financial reporting is poor quality. The comparison identifies where further analysis may be warranted.
Operating Cash Flow Ratio
One liquidity-oriented analytical ratio compares operating cash flow with current liabilities:
Operating Cash Flow Ratio = Operating Cash Flow ÷ Current Liabilities
Suppose:
Operating cash flow = $500,000
Current liabilities = $400,000
Then:
Operating Cash Flow Ratio = $500,000 ÷ $400,000
Operating Cash Flow Ratio = 1.25
This indicates annual operating cash flow equals 1.25 times the stated current liabilities.
Unlike the current ratio, which uses balance-sheet assets, this ratio uses cash generated during a period.
Because the numerator covers a period while the denominator is measured at a point in time, comparisons should be made consistently.
Can Operating Cash Flow Be Manipulated by Timing?
Operating cash flow is based on cash movement, but its timing can still be influenced by business decisions.
A company might collect customers more aggressively before period-end.
It may delay supplier payments.
It can reduce inventory purchases temporarily.
These actions can improve reported operating cash flow for the period without representing an equivalent improvement in long-term business economics.
That does not automatically make the cash flow improper. Working-capital management is a normal part of running a business.
The key is to distinguish sustainable improvement from temporary timing effects.
Seasonality and Operating Cash Flow
Seasonal businesses can report highly uneven operating cash flow across quarters.
A retailer may purchase inventory before the holiday season, causing operating cash outflows to rise months before customer sales peak.
After the peak selling period, cash collections can produce very strong OCF while inventory falls.
Looking at only one quarter could therefore provide a distorted view.
Trailing twelve-month results, multi-year trends, and comparison with corresponding seasonal periods can provide better context.
Why Operating Cash Flow Can Spike
A large increase in OCF can result from stronger earnings, improved collections, lower inventory, increased supplier financing, lower cash operating expenses, or several factors occurring simultaneously.
Not every increase has equal quality.
For example, reducing overdue customer receivables can represent a genuine improvement in cash collection.
Allowing accounts payable to rise sharply because suppliers are not being paid can also boost OCF temporarily, but the underlying implication may be much less favorable.
The reconciliation should therefore be read line by line.
Why Operating Cash Flow Can Fall
OCF can decline even when the company remains profitable.
Common reasons include growing receivables, inventory buildup, faster supplier payments, weaker earnings, cash restructuring costs, tax payments, or other operating outflows.
Suppose net income remains unchanged at $500,000 but receivables increase by another $300,000 compared with the previous period.
All else equal, that working-capital movement can substantially reduce cash generated from operations.
The company may eventually collect those receivables, but today’s cash-flow statement reflects what occurred during the current period.
Common Operating Cash Flow Mistakes
One common mistake is treating net income as operating cash flow.
Another is simply adding depreciation to net income and stopping there. Working-capital changes and other reconciling items can be substantial.
A third mistake is assuming every increase in OCF represents stronger underlying operations. Delayed supplier payments or temporary inventory reductions can boost cash flow.
Users also sometimes subtract capital expenditures and still label the result operating cash flow. Once capital expenditures are deducted under the common simplified framework, the metric has moved toward free cash flow.
Another mistake is comparing EBITDA directly with OCF without considering receivables, inventory, payables, and other cash adjustments.
Finally, operating cash flow should not be confused with the change in the company’s total cash balance. Investing and financing activities also affect total cash.
Limitations of Operating Cash Flow
Operating cash flow provides direct insight into cash generation from operations, but it has limitations.
It can be volatile because of working-capital timing.
One strong period may result from collecting old receivables.
Cash can be improved temporarily by delaying supplier payments.
OCF does not subtract capital expenditures.
It does not measure investment return.
It does not directly reveal whether the company is creating enough economic value relative to its capital base.
Classification choices and business models can also complicate comparisons between companies.
For these reasons, OCF works best when analyzed across several periods and alongside profitability, free cash flow, balance-sheet quality, working capital, and capital requirements.
How to Analyze Operating Cash Flow Properly
Start with the reported operating cash-flow amount.
Next, compare it with net income.
Then examine noncash adjustments such as depreciation and other reconciliation items.
After that, review each major working-capital change, especially receivables, inventory, payables, and accrued liabilities.
Compare the result with prior periods.
Then evaluate free cash flow to understand what remains after capital investment.
Finally, connect cash generation with profitability, liquidity, debt obligations, and growth requirements.
This approach turns OCF from a headline number into an explanation of where operating cash actually came from and where it went.
Why Operating Cash Flow Matters
A business ultimately needs cash to pay employees, suppliers, taxes, lenders, and other obligations.
Accounting profit remains essential for measuring financial performance, but profit alone does not guarantee that enough cash entered the company during the period.
Operating cash flow addresses that gap.
Its basic economic logic is:
Operating Cash Flow = Cash Generated by Operating Activities − Cash Used by Operating Activities
Under the indirect method:
OCF = Net Income Adjusted for Noncash Items and Changes in Operating Assets and Liabilities
Positive, sustainable OCF indicates that core operations are supplying cash that can help fund the rest of the business.
Weak or persistently negative OCF suggests operations require cash from another source.
The most useful analysis therefore looks beyond whether operating cash flow is positive and asks why it has the value it does, how repeatable it is, and what the business must do with that cash next.
Frequently Asked Questions
What is operating cash flow in simple terms?
Operating cash flow is the net cash generated or used by a company’s normal operating activities during a period. It shows how much cash day-to-day business operations actually produced.
What is the operating cash flow formula?
Under the direct approach:
Operating Cash Flow = Operating Cash Receipts − Operating Cash Payments
Under the indirect method, net income is adjusted for noncash items and changes in operating assets and liabilities.
How do you calculate operating cash flow from net income?
A simplified indirect formula is:
OCF ≈ Net Income + Noncash Expenses − Noncash Gains + Noncash Losses ± Working Capital Adjustments
Actual statements can contain additional reconciliation items.
Why is depreciation added back to operating cash flow?
Depreciation reduces accounting profit but does not normally represent a new current-period cash payment. It is therefore added back when reconciling net income to operating cash flow under the indirect method.
Is operating cash flow the same as net income?
No. Net income is an accrual-accounting earnings measure. Operating cash flow reflects operating cash movements and adjusts for noncash items and changes in operating assets and liabilities.
Can operating cash flow be higher than net income?
Yes. Large noncash expenses, collections of receivables, reductions in inventory, or increases in operating liabilities can cause OCF to exceed net income.
Can a profitable company have negative operating cash flow?
Yes. A profitable company can generate negative OCF if significant cash becomes tied up in receivables or inventory or if other operating cash payments exceed collections during the period.
Is negative operating cash flow always bad?
No. A single negative period can result from seasonality, rapid growth, inventory buildup, or other temporary factors. Persistent negative OCF is generally more concerning because ongoing operations continue to require outside cash.
What is the difference between operating cash flow and free cash flow?
Operating cash flow measures cash from operating activities. A common free-cash-flow calculation subtracts capital expenditures from OCF to estimate cash remaining after capital investment.
How does an increase in accounts receivable affect operating cash flow?
An increase in accounts receivable generally reduces OCF under the indirect method because revenue has been recognized without collecting an equivalent amount of cash.
How does an increase in accounts payable affect operating cash flow?
An increase in accounts payable generally increases OCF under the indirect method because expenses or purchases have been recognized while the related cash payment has not yet been made.
Where is operating cash flow found on financial statements?
Operating cash flow appears in the operating activities section of the statement of cash flows. Under the indirect method, the section typically reconciles net income with net cash provided by or used in operating activities.




