


Receivables turnover measures how efficiently a business converts its accounts receivable into collections. The ratio compares credit sales with the average receivable balance held during the same period.
The standard formula is:
Receivables Turnover = Net Credit Sales ÷ Average Accounts Receivable
Suppose a company records $1.2 million of annual net credit sales and maintains average accounts receivable of $120,000.
Receivables Turnover = $1,200,000 ÷ $120,000
Receivables Turnover = 10 Times
A turnover ratio of 10 means the company’s average receivable balance was generated and collected approximately ten times during the year under the assumptions of the calculation.
Receivables turnover is particularly useful within business finance because credit sales can produce accounting revenue before customers actually pay. The ratio helps show how quickly that sales activity is converting into collected cash.
What Is Receivables Turnover?
Receivables turnover is an efficiency ratio that compares credit-based sales activity with the average amount customers owe the business.
The underlying accounts receivable balance represents amounts owed by customers for qualifying sales or services that have been recognized but not yet collected.
When customers pay, receivables decline and cash increases.
The turnover ratio summarizes that collection relationship.
Conceptually:
Receivables Turnover = Credit Sales Activity ÷ Average Receivables Supporting Those Sales
A higher ratio generally indicates faster turnover of the receivable balance.
A lower ratio generally indicates that receivables remain outstanding longer.
However, the ratio should not be judged from one universal benchmark. Payment terms, industry practices, customer mix, seasonality, billing structure, and the proportion of cash versus credit sales can all change what constitutes normal turnover.
Receivables Turnover Formula
The preferred formula is:
Receivables Turnover = Net Credit Sales ÷ Average Accounts Receivable
Where:
Net credit sales represent sales made on credit during the period, adjusted where appropriate for returns, allowances, or other reductions consistent with the company’s reporting.
Average accounts receivable is commonly calculated as:
Average Accounts Receivable = (Beginning Accounts Receivable + Ending Accounts Receivable) ÷ 2
Combining the formulas gives:
Receivables Turnover = Net Credit Sales ÷ [(Beginning A/R + Ending A/R) ÷ 2]
For more seasonal or volatile businesses, a monthly or quarterly average receivable balance can provide a better denominator than using only beginning and ending balances.
How to Calculate Receivables Turnover
Suppose a company reports:
Beginning accounts receivable = $180,000
Ending accounts receivable = $220,000
Annual net credit sales = $2,000,000
First calculate average receivables:
Average Accounts Receivable = ($180,000 + $220,000) ÷ 2
Average Accounts Receivable = $200,000
Now calculate turnover:
Receivables Turnover = $2,000,000 ÷ $200,000
Receivables Turnover = 10
The company turns over its average receivable balance approximately 10 times during the year.
Receivables Turnover Example
Consider a wholesaler that sells primarily to business customers on credit.
Net credit sales = $6 million
Beginning receivables = $450,000
Ending receivables = $550,000
Average accounts receivable:
($450,000 + $550,000) ÷ 2 = $500,000
Receivables turnover:
$6,000,000 ÷ $500,000 = 12
The business therefore has a receivables turnover ratio of 12 times per year.
A useful approximate conversion to collection days is:
Average Collection Days ≈ 365 ÷ Receivables Turnover
Therefore:
365 ÷ 12 ≈ 30.4 Days
The result suggests the average receivable balance corresponds to roughly 30 days of credit sales under this simplified annual calculation.
What Does Receivables Turnover of 10 Mean?
A receivables turnover ratio of 10 means net credit sales during the period were ten times the average receivable balance.
Suppose:
Net credit sales = $5 million
Average receivables = $500,000
Then:
$5,000,000 ÷ $500,000 = 10
The approximate collection period using a 365-day year is:
365 ÷ 10 = 36.5 Days
A turnover ratio of 10 therefore corresponds to roughly 36.5 days of sales being held in receivables on average under the stated assumptions.
The ratio does not mean that every invoice was collected exactly 10 times or every customer paid in 36.5 days.
It summarizes the overall relationship between sales and the average receivable balance.
What Does a High Receivables Turnover Mean?
A relatively high receivables turnover generally suggests the company collects receivables quickly relative to its level of credit sales.
Possible reasons include effective collection procedures, short payment terms, reliable customers, strong credit screening, automatic billing, substantial recurring payments, or a business model in which customers typically pay rapidly.
However, an unusually high ratio is not automatically ideal.
A company may be offering credit terms that are so restrictive that potential customers choose competitors with more flexible payment options.
Likewise, a high ratio calculated from total sales can be misleading if a large portion of sales is actually paid in cash.
The ratio should therefore be interpreted alongside the company’s credit policy and customer economics.
What Does a Low Receivables Turnover Mean?
A relatively low receivables turnover means the average receivable balance is large relative to credit sales.
Possible causes include slower collections, longer contractual payment terms, customer disputes, weaker credit quality, billing delays, rapid end-of-period growth, or overdue accounts.
Suppose turnover falls from 12 to 6 while sales remain broadly stable.
The approximate collection period changes from:
365 ÷ 12 ≈ 30.4 Days
to:
365 ÷ 6 ≈ 60.8 Days
The company’s receivable balance now represents roughly twice as many days of credit sales.
That deserves investigation, particularly if normal customer terms have not changed.
What Is a Good Receivables Turnover Ratio?
There is no universal good receivables turnover ratio.
The appropriate level depends heavily on payment terms.
A company requiring payment within 15 days should generally show different turnover characteristics from a business offering 90-day terms.
Industry norms also differ.
Government contractors, healthcare businesses, manufacturers, software providers, wholesalers, and consumer businesses can have very different billing and collection cycles.
A useful benchmark compares:
the company’s current turnover with its historical turnover;
actual collection speed with contractual payment terms;
the ratio with comparable businesses;
and changes in overdue receivables.
The direction and cause of the ratio often matter more than whether it exceeds one arbitrary number.
Average Accounts Receivable Formula
The denominator is commonly calculated as:
Average Accounts Receivable = (Beginning Receivables + Ending Receivables) ÷ 2
Suppose:
Beginning receivables = $300,000
Ending receivables = $500,000
Then:
Average Receivables = ($300,000 + $500,000) ÷ 2
Average Receivables = $400,000
If net credit sales are $4 million:
Receivables Turnover = $4,000,000 ÷ $400,000
Receivables Turnover = 10
Using an average denominator is generally preferable to using only ending receivables because the sales numerator covers an entire period.
Why Average Receivables Matter
Suppose annual credit sales are $10 million.
Beginning receivables are $500,000.
Ending receivables are $1.5 million.
Using ending receivables alone gives:
$10,000,000 ÷ $1,500,000 ≈ 6.67
Using the beginning-and-ending average gives:
Average Receivables = ($500,000 + $1,500,000) ÷ 2 = $1,000,000
Then:
Turnover = $10,000,000 ÷ $1,000,000 = 10
The results are substantially different.
Neither two-point average nor ending balance perfectly describes every business, but the average generally aligns the period-based sales numerator with a more representative balance denominator.
Monthly Average Receivables
A beginning-and-ending average can still be misleading when balances fluctuate significantly during the year.
Suppose a seasonal company has:
January receivables = $1 million
Most monthly balances = $4 million
December receivables = $1 million
The simple beginning-and-ending average would be close to $1 million, even though the business carried much larger receivable balances through most of the year.
A more representative denominator can be:
Average A/R = Sum of Monthly Receivable Balances ÷ Number of Months
Using monthly or quarterly balances can substantially improve turnover analysis for seasonal companies.
Net Credit Sales vs Total Revenue
The most conceptually appropriate numerator is generally net credit sales because accounts receivable arises primarily from sales for which customer payment is deferred.
Suppose:
Total revenue = $10 million
Cash sales = $6 million
Credit sales = $4 million
Average receivables = $500,000
Using total sales:
$10 million ÷ $500,000 = 20
Using credit sales:
$4 million ÷ $500,000 = 8
The difference is enormous.
The ratio of 20 makes collections appear much faster because $6 million of cash sales that never entered accounts receivable have been included in the numerator.
When reliable credit-sales information is available, it provides the cleaner match.
What If Credit Sales Are Not Disclosed?
Public financial statements do not always disclose cash and credit sales separately.
In that case, analysts sometimes use net sales or revenue as a practical proxy.
If doing so, label the methodology clearly.
The resulting turnover ratio is most comparable across periods when the proportion of credit sales remains reasonably stable.
If a company’s sales mix changes sharply from cash to credit or vice versa, a total-sales-based turnover ratio can change even when collection performance itself has not.
Receivables Turnover vs Days Sales Outstanding
Days sales outstanding expresses receivable collection in days rather than times per period.
When the metrics use consistent sales and receivable definitions:
DSO ≈ Days in Period ÷ Receivables Turnover
For annual analysis:
DSO ≈ 365 ÷ Receivables Turnover
If turnover equals 8:
DSO ≈ 365 ÷ 8
DSO ≈ 45.6 Days
If turnover increases to 12:
DSO ≈ 365 ÷ 12
DSO ≈ 30.4 Days
Thus, higher turnover generally corresponds to lower DSO.
The two measures describe the same broad collection relationship from opposite directions.
Receivables Turnover vs Accounts Receivable
Accounts receivable is a balance-sheet amount.
Receivables turnover is an efficiency ratio.
Suppose a business reports $1 million of receivables.
That number alone tells us little about collection efficiency.
If annual credit sales are $2 million, the balance is relatively large.
If annual credit sales are $100 million, the same $1 million balance is comparatively small.
The turnover ratio places receivables in the context of the sales that generated them.
Receivables Turnover and Accrual Accounting
Under accrual accounting, revenue can be recognized before cash is collected.
Suppose a business delivers a qualifying service today and invoices a customer $100,000 payable in 60 days.
Revenue may be recognized under the applicable accounting framework before the $100,000 cash arrives.
Accounts receivable increases.
Receivables turnover then helps assess how quickly those recognized credit sales eventually convert into collections.
This makes the ratio particularly useful when accounting revenue and cash receipts occur at different times.
Receivables Turnover and Operating Cash Flow
Operating cash flow provides the cash-flow counterpart to receivable analysis.
If accounts receivable increases substantially because customers have not yet paid, that change can reduce operating cash flow under the indirect method.
Suppose a company reports strong profit growth but receivables grow much faster than sales.
Accounting earnings may improve while operating cash conversion weakens.
A declining receivables turnover can therefore help explain why profit and operating cash flow are diverging.
Receivables Turnover and Working Capital
Working capital includes accounts receivable as a current asset.
When receivables increase, working capital may increase mathematically.
However, more working capital does not always mean more immediately available cash.
A company can have substantial positive working capital precisely because large amounts of money remain tied up in unpaid customer invoices.
Faster receivables turnover can release cash from that working-capital cycle without requiring additional sales.
Receivables Turnover and Cash Conversion Cycle
The cash conversion cycle connects receivable collection with inventory and supplier-payment timing.
Its common structure is:
Cash Conversion Cycle = DIO + DSO − DPO
Where:
DIO = days inventory outstanding
DSO = days sales outstanding
DPO = days payable outstanding
Receivables turnover influences the DSO component.
When receivables are collected faster, DSO generally falls.
All else equal, that shortens the cash conversion cycle and returns cash to the business sooner.
Receivables Turnover and Inventory Turnover
Inventory turnover measures how rapidly inventory is sold or used relative to its average balance.
Receivables turnover measures how quickly credit sales are collected relative to average receivables.
For a product business, the sequence can be viewed as:
Inventory → Sale → Receivable → Cash
A company can sell inventory rapidly but collect customers slowly.
In that situation, inventory turnover may look strong while receivables turnover is weak.
The business has moved the cash bottleneck from inventory into customer credit.
Receivables Turnover and Days Inventory Outstanding
Days inventory outstanding measures the inventory stage of the working-capital cycle.
Suppose a manufacturer reduces DIO by 20 days but DSO increases by 20 days.
Inventory is moving faster, but customers are taking correspondingly longer to pay.
The overall cash-cycle improvement may therefore be limited.
This is why receivables performance should be analyzed with the other working-capital components rather than in isolation.
Receivables Turnover and Days Payable Outstanding
Days payable outstanding measures how long the company takes to pay suppliers.
Faster customer collection and appropriately managed supplier terms can improve cash availability.
For example:
DSO falls from 60 to 40 days.
DPO remains 45 days.
The company now collects many customer invoices before it pays certain supplier obligations, depending on the specific timing and business model.
However, deliberately delaying suppliers simply to preserve cash can create operational and credit risks.
Cash-cycle optimization should remain commercially sustainable.
Receivables Turnover and Accounts Payable
Accounts payable represents amounts the business owes suppliers and other qualifying creditors.
Receivables represent money customers owe the business.
A company can therefore be collecting from customers while simultaneously deciding when to pay suppliers.
The relationship affects working capital and operating cash flow.
Strong receivables collections can reduce reliance on extending payable terms or short-term borrowing.
Receivables Turnover and Quick Ratio
The workbook directly maps quick ratio to this article because receivables commonly make up a substantial portion of quick assets.
Suppose:
Cash = $100,000
Receivables = $900,000
Current liabilities = $800,000
Quick ratio:
($100,000 + $900,000) ÷ $800,000 = 1.25
The ratio appears comfortably above 1.
But 90% of the quick assets in this simplified example are receivables.
If those receivables are slow or difficult to collect, practical liquidity can be weaker than the quick ratio suggests.
Receivables turnover therefore helps test the quality of an important liquidity asset.
Receivables Turnover and Current Ratio
The current ratio includes accounts receivable within current assets.
A rising receivable balance can therefore increase current assets and potentially support the current ratio.
But if the rise results from slower customer collections, operating liquidity may actually be deteriorating.
This illustrates a broader principle:
A larger current asset balance is not automatically better when that asset is becoming harder to convert into cash.
Balance-sheet size and asset quality both matter.
Receivables Turnover and Cash Ratio
The cash ratio normally excludes receivables and focuses on cash and the most cash-like resources.
As customers pay invoices, receivables fall while cash rises.
The transaction may leave total current assets largely unchanged but alter their liquidity composition.
Faster receivables collection can therefore strengthen the company’s cash position without necessarily changing revenue or profit at the moment of collection.
Receivables Turnover and Liquidity Ratios
Liquidity ratios provide static measures of current financial capacity.
Receivables turnover adds an efficiency dimension.
Suppose two companies each have a quick ratio of 1.3.
Company A collects customers in roughly 25 days.
Company B takes 90 days.
The headline liquidity ratios are identical, yet Company A may have a more readily convertible asset base.
Combining liquidity ratios with collection metrics creates a more complete picture.
Receivables Turnover and Cash Flow Forecasting
Cash flow forecasting converts customer-payment assumptions into expected future cash receipts.
A business may forecast $1 million of monthly sales, but that does not mean $1 million enters the bank during the same month.
If customers receive 60-day credit:
April sales may largely become June cash collections.
A realistic forecast should therefore incorporate expected collection timing rather than treating revenue and cash receipts as identical.
Historical receivables turnover and DSO can help test whether forecast collection assumptions are reasonable.
Receivables Turnover and Profit
The workbook maps profit directly to this page because profitable sales do not automatically create immediate cash.
Suppose a company makes a $100,000 sale with $60,000 of related costs.
The transaction can contribute $40,000 of accounting profit under the simplified assumptions.
If the customer has not paid, however, the $100,000 remains a receivable.
The business still needs cash to fund payroll, suppliers, debt, and other obligations.
Receivables turnover helps show how quickly profitable credit sales convert into collections.
Receivables Turnover and Net Profit
Net profit can rise while receivables turnover falls.
For example, relaxed credit terms may increase sales and accounting profit initially.
If customers then take much longer to pay, average receivables grow.
The company looks more profitable on the income statement while cash conversion weakens.
This does not automatically mean the new credit policy is wrong.
It means the additional earnings should be evaluated alongside the additional working capital required and the risk of nonpayment.
Receivables Turnover and Return on Assets
The workbook maps return on assets because accounts receivable forms part of the asset base.
Suppose two businesses generate identical profit and revenue.
Company A maintains $500,000 of average receivables.
Company B requires $2 million because its customers pay much more slowly.
All else equal, Company B ties up more assets to support the same level of activity.
Slower receivables turnover can therefore reduce asset efficiency as well as cash availability.
Receivables Turnover and Asset Turnover
Asset turnover compares revenue with the overall asset base.
Receivables turnover focuses specifically on receivables.
A company may have strong total asset turnover while customer collections deteriorate, particularly if receivables represent only a small part of total assets.
Conversely, a service business with limited inventory and fixed assets may depend heavily on receivable management for overall asset efficiency.
The specific turnover ratios show where capital is being tied up.
Receivables Turnover and Return on Equity
Return on equity measures earnings relative to shareholders’ equity.
Receivable management can indirectly influence ROE by affecting the amount of capital needed to finance operations.
If customers pay slowly, the company may need more equity or debt to fund the gap between delivering goods or services and collecting cash.
Better collection efficiency can reduce that funding burden, although the exact effect depends on the company’s broader balance sheet and financing choices.
Receivables Turnover and Free Cash Flow
Free cash flow can also be affected by changes in receivable collection.
Suppose accounting earnings remain unchanged while accounts receivable rises sharply.
Operating cash flow may fall because more cash is tied up in customer balances.
With capital spending unchanged, free cash flow can also decline.
Faster turnover can reverse part of that effect by converting existing receivables into cash.
Receivables Turnover and Profitability Index
The workbook maps profitability index as another neighboring Finance concept.
PI evaluates discounted project cash flows relative to an investment.
Receivables turnover measures collection efficiency.
The connection appears when a new project generates sales on credit.
Suppose a project model assumes customers pay within 30 days, but actual collection behavior is closer to 90 days.
The project cash inflows arrive later than forecast.
Because later cash flows have lower present value, slower receivable collection can reduce the project’s modeled NPV and profitability index.
Receivables Turnover and Rental Property Returns
The workbook also maps rental property returns to this page, but the search intents remain distinct.
Rental property return analysis evaluates investment cash flow, yield, and other property economics.
Receivables turnover is principally a business credit-and-collection efficiency measure.
However, a property-management or commercial-rental business with substantial unpaid tenant balances can still monitor receivables and collection periods operationally.
The existence of receivables does not turn the receivables-turnover ratio into a property-return metric.
Credit Policy and Receivables Turnover
Credit policy can significantly affect the ratio.
A business offering 15-day terms will generally target a different collection profile from one offering 60 or 90 days.
Stricter credit standards can increase turnover by reducing exposure to slower-paying customers.
However, excessively strict terms can reduce sales.
Looser terms can support revenue growth but increase receivables, financing needs, and credit-loss exposure.
The goal is not necessarily to maximize turnover.
The goal is to establish credit terms that create attractive risk-adjusted economics.
Example: Relaxing Credit Terms
Suppose a company currently has:
Credit sales = $5 million
Average receivables = $500,000
Turnover = 10
The company relaxes its credit terms.
Sales increase to $6 million, but average receivables rise to $1 million.
New turnover:
$6 million ÷ $1 million = 6
Sales increased 20%, but receivables doubled.
The policy may still be worthwhile if the additional profit exceeds the cost of financing and credit risk.
However, turnover reveals that the business is tying up substantially more capital in customer balances.
Example: Improving Collections
Suppose:
Credit sales = $12 million
Average receivables = $2 million
Initial turnover:
$12 million ÷ $2 million = 6
Approximate collection period:
365 ÷ 6 ≈ 60.8 Days
After improving invoicing and collection processes, average receivables fall to $1.2 million while sales remain $12 million.
New turnover:
$12 million ÷ $1.2 million = 10
Approximate collection period:
365 ÷ 10 = 36.5 Days
The company has released approximately $800,000 from receivables while maintaining the same annual credit sales.
That can materially strengthen liquidity.
Example: Sales Growth Can Lower Turnover Temporarily
A falling ratio does not always indicate poor collections.
Suppose a company experiences exceptionally strong credit sales near year-end.
Annual net credit sales rise sharply, but many December invoices remain unpaid at the reporting date simply because their payment terms have not expired.
Ending receivables can rise substantially.
If the denominator relies heavily on the year-end balance, turnover may appear weaker.
This is why seasonality, sales timing, and a more representative average receivable balance matter.
Receivables Turnover and Seasonality
Seasonality can distort both the numerator and denominator.
A holiday-oriented business might generate most credit sales in the final quarter.
A construction business may have uneven project billing.
A seasonal wholesaler may accumulate receivables around peak selling periods.
Using only January and December balances can fail to capture the typical balance throughout the year.
Monthly or quarterly averages generally provide stronger analysis when the business is highly seasonal.
Receivables Turnover and Bad Debts
Receivables turnover measures collection speed, but it does not directly measure how much of the receivable balance will ultimately prove uncollectible.
A business could collect most customers quickly while still suffer meaningful credit losses from a small group of accounts.
Another could collect almost every dollar eventually but take a long time.
Therefore, turnover should be combined with an analysis of delinquent balances, credit-loss allowances, write-offs, and customer quality where material.
Speed and collectibility are related but different dimensions.
Gross vs Net Accounts Receivable
Financial statements may present accounts receivable net of an allowance for expected credit losses.
The denominator used for turnover should be defined consistently when comparing periods or companies.
Suppose:
Gross receivables = $1 million
Allowance = $100,000
Net receivables = $900,000
Using gross receivables produces a different turnover ratio from using net receivables.
Neither number should be mixed casually with another period calculated on a different basis.
Consistency is critical.
Receivables Aging vs Turnover
An accounts receivable aging report groups unpaid invoices by how long they have been outstanding.
For example:
Current
1–30 days overdue
31–60 days overdue
61–90 days overdue
More than 90 days overdue
Receivables turnover compresses all collection activity into one ratio.
The aging schedule reveals where the problems are.
A stable turnover ratio can hide a growing concentration of very old receivables if other customers are paying faster.
Operational collection management should therefore use detailed aging alongside the headline turnover metric.
Invoice Timing Can Affect the Ratio
Receivables collection starts with accurate and timely billing.
A company can negotiate 30-day customer terms but consistently wait ten days after delivery to send invoices.
The effective cash cycle becomes longer even if customers pay exactly 30 days after receiving the invoice.
Improving turnover can therefore involve operational changes before collection activity begins:
faster invoice creation;
accurate billing;
clear payment instructions;
electronic invoicing;
and rapid dispute resolution.
Collection efficiency is not only a matter of chasing overdue customers.
Customer Concentration and Receivables Risk
A company with a large share of receivables owed by one customer can face greater collection risk than another business with the same turnover ratio and a diversified customer base.
Suppose:
Company A turnover = 8
Company B turnover = 8
Company A’s largest customer represents 5% of receivables.
Company B’s largest customer represents 60%.
The ratios are identical, but the risk of one payment delay affecting cash flow is much greater for Company B.
Turnover therefore does not capture concentration risk.
How to Improve Receivables Turnover
Improving receivables turnover generally means accelerating collections without sacrificing economically valuable sales.
A business can examine customer credit before extending large balances, issue invoices promptly, make payment instructions clear, use electronic payment methods, follow up before and after due dates, resolve disputes quickly, monitor aging, and apply credit terms consistently.
The company can also identify customers whose payment behavior consistently differs from contractual terms.
However, aggressive collection should not be pursued without regard to customer relationships.
The objective is better cash conversion, not simply the highest possible ratio.
Should You Shorten Customer Payment Terms?
Shorter terms can accelerate cash collection, but they can also affect competitiveness.
Suppose a market normally operates on 60-day terms.
A company moving unilaterally to payment in 10 days may improve theoretical working-capital economics but lose customers to competitors.
Instead, management needs to evaluate the financial cost of longer credit against the commercial value created by offering it.
Credit can be part of the product.
The economically optimal turnover ratio is therefore not always the mathematical maximum.
Early-Payment Discounts and Turnover
A business can offer discounts for earlier customer payment.
For example, a customer may receive a discount for paying within a shorter period instead of using the full standard credit term.
The benefit is faster cash collection.
The cost is lower revenue or gross profit on that transaction.
The decision should therefore compare the value of receiving cash sooner with the margin sacrificed.
Receivables turnover can improve while profitability worsens if discounts are too generous.
Receivables Turnover and Financing Cost
Slow customer payments can create a financing requirement.
Suppose a company sells goods today, pays suppliers in 30 days, but collects customers after 90 days.
For approximately 60 days, the business must finance the gap.
It may use cash reserves, equity, a line of credit, or another funding source.
Faster receivables turnover can reduce the amount and duration of that financing need.
This makes collection efficiency economically important even when customers eventually pay in full.
Receivables Turnover and Growth
Rapid growth can consume cash because receivables can grow before collections catch up.
Suppose a business doubles credit sales while maintaining the same collection period.
Its required receivable investment can also rise dramatically.
A stable receivables turnover during rapid growth therefore does not mean working-capital requirements remain constant.
The ratio can stay at 10 while average receivables rise from $1 million to $2 million because sales doubled from $10 million to $20 million.
Efficiency remained stable.
The dollar amount of capital tied up doubled.
Why Turnover Can Rise Without Better Collections
A higher ratio does not always result from stronger collection activity.
Suppose the business shifts from credit sales toward cash sales.
If total revenue is incorrectly used as the numerator, the apparent turnover may increase even though the remaining credit customers pay no faster.
Likewise, writing off old receivables can reduce the denominator and mechanically increase turnover.
The analyst should therefore examine what caused the numerator or denominator to change.
Why Turnover Can Fall Without Worse Collections
A falling ratio can also occur for benign reasons.
The company may intentionally extend payment terms to high-quality strategic customers.
Sales may surge late in the period.
The customer mix may shift toward large enterprises with longer contractual payment cycles.
The business may enter an industry where normal terms are longer.
A lower turnover ratio is a signal for analysis, not proof of poor management.
Receivables Turnover Trend Analysis
Suppose turnover changes:
Year 1 = 11.5
Year 2 = 10.8
Year 3 = 8.2
Year 4 = 6.5
The consistent decline deserves investigation.
Possible drivers include slower collections, longer credit terms, rapid receivable growth, customer financial weakness, disputes, or changing sales mix.
Now consider:
Year 1 = 6
Year 2 = 7
Year 3 = 9
Year 4 = 11
The company appears to be collecting faster relative to its credit-sales base.
Again, verify whether the change reflects actual collection improvement or a shift in accounting and sales composition.
Comparing Receivables Turnover Between Companies
Peer comparisons can be useful when the companies have similar customers, sales models, payment terms, and accounting definitions.
Comparison becomes weaker when one company sells mainly for cash and another operates almost entirely on credit.
Likewise, one business may use gross receivables while another uses net receivables.
Geographic payment practices can differ.
Seasonality can differ.
Customer concentration can differ.
A ratio is only as comparable as the economic definitions behind it.
Receivables Turnover and the Balance Sheet Date
Turnover combines an income-statement numerator covering a period with balance-sheet amounts measured at particular dates.
This creates an inherent measurement challenge.
A company can temporarily collect a large number of invoices immediately before year-end, reducing ending receivables and improving the ratio.
Another can issue a large batch of invoices just before year-end and look temporarily worse.
Using multiple balance dates and understanding year-end timing can reduce this distortion.
360 Days vs 365 Days
When converting receivables turnover to approximate collection days, some analyses use 365 days while others use a 360-day convention.
Using 365:
Collection Days ≈ 365 ÷ Turnover
Using 360:
Collection Days ≈ 360 ÷ Turnover
For turnover of 10:
365 ÷ 10 = 36.5 Days
versus:
360 ÷ 10 = 36 Days
The difference is small but real.
Use the same convention when comparing periods or companies.
Quarterly Receivables Turnover
A quarterly calculation should match quarterly sales with the relevant average receivable balance.
Suppose:
Quarterly credit sales = $900,000
Beginning quarter receivables = $280,000
Ending receivables = $320,000
Average:
($280,000 + $320,000) ÷ 2 = $300,000
Quarterly turnover:
$900,000 ÷ $300,000 = 3 Times During the Quarter
Do not automatically interpret that as an annual turnover of 3.
If annualization is required, state the method and consider seasonality before multiplying the quarterly result by four.
Common Receivables Turnover Mistakes
One common mistake is using total sales when substantial cash sales are included and credit-sales information is available.
Another is using ending receivables instead of a representative average without recognizing the distortion.
Users can also assume that higher turnover is always better.
A third mistake is comparing companies with radically different credit terms.
Another is ignoring bad-debt risk because the average collection speed appears acceptable.
Analysts may also mix gross and net receivable balances between periods.
Finally, turnover can be confused with DSO even though one is expressed as times per period and the other as days.
Limitations of Receivables Turnover
Receivables turnover compresses a complicated collection process into one number.
It does not show the aging distribution of receivables.
It does not directly measure expected credit losses.
It can be distorted by seasonality.
The numerator can be imperfect when credit sales are unavailable.
Beginning-and-ending averages may not represent typical balances.
Different industries use different payment terms.
High turnover can reflect overly restrictive credit policy.
The ratio also does not show customer concentration or the exact timing of upcoming collections.
Therefore, receivables turnover should be combined with DSO, receivable aging, operating cash flow, liquidity measures, customer credit quality, and cash forecasts.
How to Analyze Receivables Turnover Properly
Start with the best available measure of net credit sales.
Then calculate a representative average accounts receivable balance.
Use:
Receivables Turnover = Net Credit Sales ÷ Average Accounts Receivable
Compare the result with prior periods.
Convert it into approximate collection days:
Collection Days ≈ 365 ÷ Receivables Turnover
Then compare those days with contractual customer terms.
Review receivables aging.
Examine credit-loss allowances and write-offs.
Compare receivable growth with revenue growth.
Finally, connect collection performance with operating cash flow, liquidity, and the cash conversion cycle.
This approach shows not only how quickly receivables turn, but whether the resulting cash conversion is economically healthy.
Why Receivables Turnover Matters
A sale is not the end of the operating cycle when the customer has not yet paid.
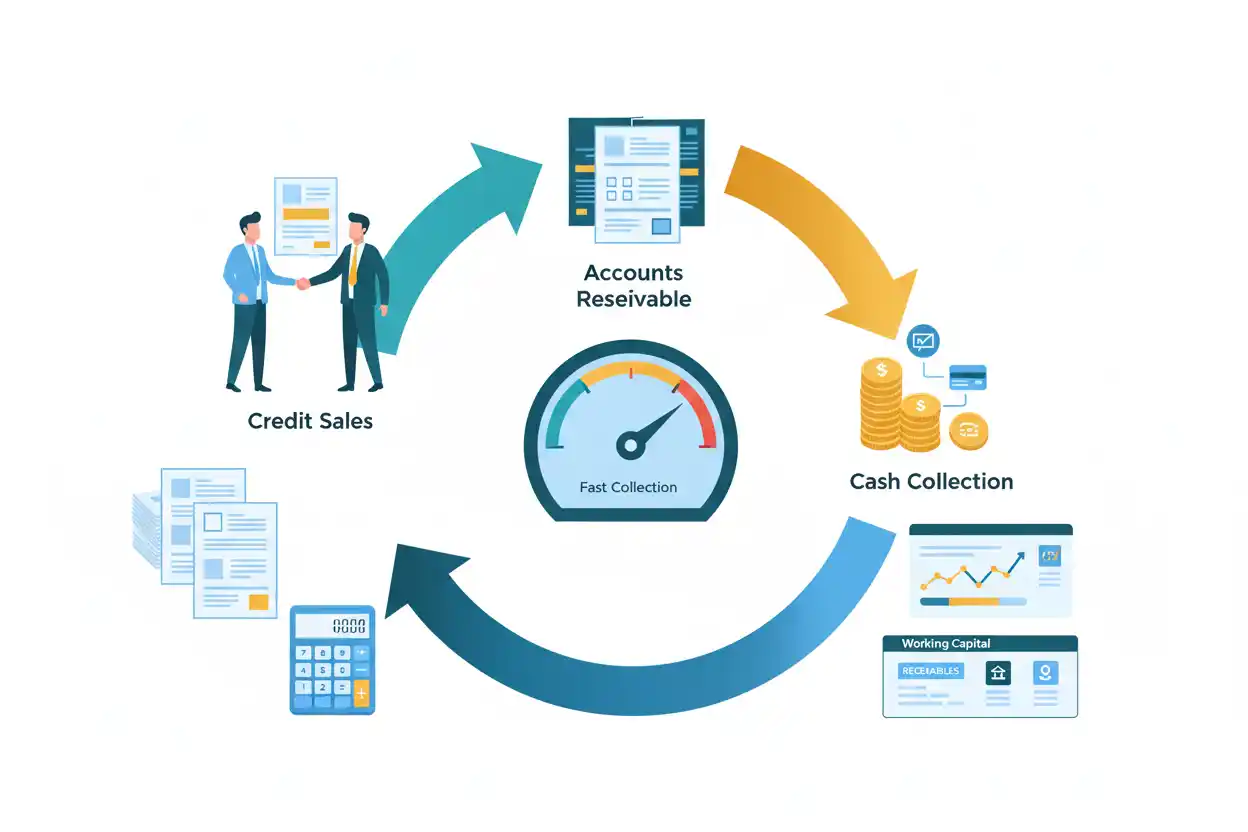
For businesses selling on credit, revenue moves through another stage:
Credit sale → Accounts receivable → Cash collection
Receivables turnover measures the speed of that conversion.
Its primary formula is:
Receivables Turnover = Net Credit Sales ÷ Average Accounts Receivable
A higher ratio usually indicates faster conversion.
A lower ratio usually indicates more sales are tied up in receivables for longer.
Yet the best ratio is not simply the highest possible number.
Credit terms can support profitable sales.
Customer relationships matter.
Seasonality matters.
Receivable quality matters.
The strongest analysis therefore balances collection speed, credit risk, liquidity, and commercial growth rather than optimizing one ratio in isolation.
Frequently Asked Questions
What is receivables turnover in simple terms?
Receivables turnover measures how many times during a period a company’s average accounts receivable balance is represented by its credit sales. It is commonly used to assess collection efficiency.
What is the receivables turnover formula?
The standard formula is:
Receivables Turnover = Net Credit Sales ÷ Average Accounts Receivable
How do you calculate average accounts receivable?
A common formula is:
Average Accounts Receivable = (Beginning A/R + Ending A/R) ÷ 2
For seasonal businesses, monthly or quarterly averages can be more representative.
What does a receivables turnover ratio of 10 mean?
It means credit sales equal roughly ten times the company’s average receivable balance during the period. Using a 365-day approximation, it corresponds to about 36.5 collection days.
Is a higher receivables turnover better?
Higher turnover generally indicates faster collections, but an extremely high ratio can also reflect restrictive credit terms or a sales mix that makes the comparison misleading. Context matters.
What does low receivables turnover mean?
A low ratio means receivables are relatively large compared with credit sales. Possible causes include slower collection, longer payment terms, overdue invoices, billing disputes, or changes in customer mix.
What is a good receivables turnover ratio?
There is no universal good ratio. The appropriate level depends on the company’s contractual credit terms, industry, customer base, seasonality, and business model.
What is the difference between receivables turnover and DSO?
Receivables turnover is expressed as times per period. DSO is expressed as days. With consistent assumptions, annual DSO can be approximated as 365 divided by receivables turnover.
Should total sales or credit sales be used?
Net credit sales provide the cleaner numerator because receivables arise from sales awaiting customer payment. Total sales may be used as a proxy when credit sales are unavailable, but the limitation should be recognized.
Why use average accounts receivable?
Sales accumulate over an entire period, while a single receivable balance represents one date. Averaging beginning and ending balances creates a better period match, although more frequent averages can be preferable for seasonal businesses.
Can receivables turnover improve while profit falls?
Yes. Faster collections can improve turnover while pricing, costs, or other expenses reduce profit. Collection efficiency and profitability are different measures.
How can a company improve receivables turnover?
Potential improvements include faster and more accurate invoicing, stronger credit review, clearer payment terms, early follow-up, easier payment methods, rapid dispute resolution, disciplined aging reviews, and targeted action on consistently late-paying customers.




