


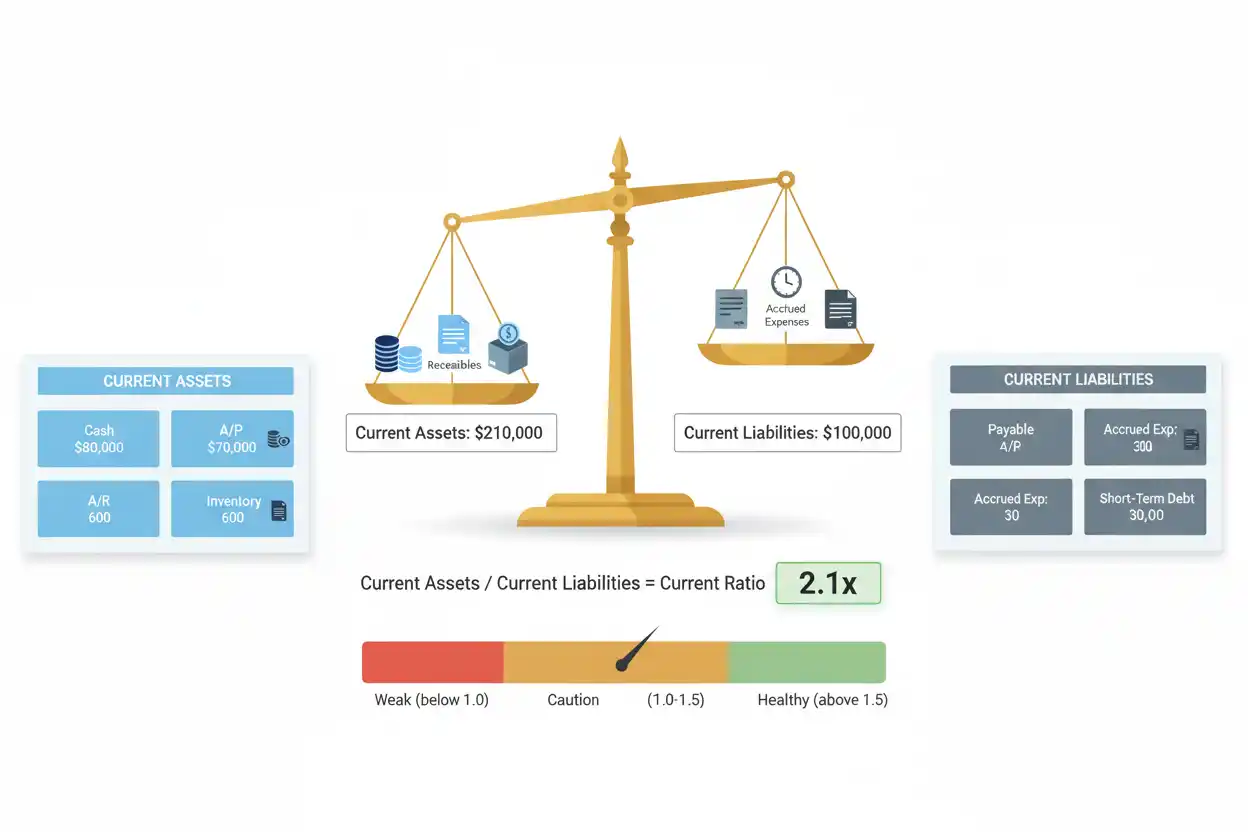
The current ratio measures a company’s current assets relative to its current liabilities. It is a short-term liquidity ratio used to examine whether the resources classified as current are sufficient relative to obligations classified as current.
The formula is:
Current Ratio = Current Assets ÷ Current Liabilities
If a company has $1.2 million of current assets and $800,000 of current liabilities:
Current Ratio = $1,200,000 ÷ $800,000 = 1.50
A current ratio of 1.50 means the company reports approximately $1.50 of current assets for every $1 of current liabilities.
That does not mean $1.50 of cash is immediately available. Current assets can include accounts receivable, inventory, prepaid items, and other assets whose liquidity differs substantially from cash.
The current ratio is therefore useful for business finance and liquidity analysis, but it should be interpreted with the composition of current assets, timing of liabilities, operating cash flow, and working-capital cycle.
What Is the Current Ratio?
The current ratio compares two sections of the balance sheet: current assets and current liabilities.
Current assets generally represent assets expected to be realized, sold, consumed, or otherwise treated as current under the applicable accounting framework. Common examples include cash, cash equivalents, receivables, inventory, and certain other short-term assets.
Current liabilities represent obligations classified as short term, such as accounts payable, accrued expenses, some taxes payable, short-term borrowings, and the current portion of longer-term debt where applicable.
The ratio asks:
How large is the company’s reported current-asset base relative to its current obligations?
It does not directly answer whether every obligation can be paid on time. That requires information about actual cash availability and timing.
Current Ratio Formula
The standard formula is:
Current Ratio = Current Assets ÷ Current Liabilities
Suppose a balance sheet reports:
Current assets = $900,000
Current liabilities = $600,000
Then:
Current Ratio = $900,000 ÷ $600,000
Current Ratio = 1.50
The ratio is normally stated as 1.5, 1.5:1, or approximately $1.50 of current assets per $1 of current liabilities.
Unlike working capital, which expresses the difference as a dollar amount, the current ratio expresses the relationship proportionally.
Current Ratio Example
Consider a business with the following current assets:
Cash and cash equivalents: $200,000
Accounts receivable: $350,000
Inventory: $400,000
Other current assets: $50,000
Total current assets are:
Current Assets = $200,000 + $350,000 + $400,000 + $50,000
Current Assets = $1,000,000
The company reports current liabilities of $625,000.
Its current ratio is:
Current Ratio = $1,000,000 ÷ $625,000
Current Ratio = 1.60
The company reports $1.60 of current assets for every $1 of current liabilities.
However, 40% of those current assets consist of inventory. If that inventory is difficult to sell, obsolete, or slow-moving, the headline ratio may overstate practical near-term liquidity.
This is why the current ratio should be followed by analysis rather than treated as the conclusion.
What Are Current Assets?
Current assets form the numerator.
They can include cash and cash equivalents, trade receivables, inventory, short-term investments where classified as current, prepaid expenses, and other qualifying balances.
Not every current asset has the same liquidity.
Cash may be immediately usable.
Accounts receivable require customer collection.
Inventory normally has to be sold and may then create another receivable before becoming cash.
Prepaid expenses may reduce future cash requirements but usually cannot be used to pay a supplier today.
That difference in liquidity is exactly why the quick ratio and cash ratio exist.
What Are Current Liabilities?
Current liabilities form the denominator.
Depending on the business and accounting presentation, they may include accounts payable, accrued payroll, taxes payable, short-term borrowings, current lease obligations, accrued expenses, and the portion of long-term debt due within the current classification period.
Suppose a business reports:
Accounts payable: $280,000
Accrued expenses: $120,000
Current debt: $100,000
Other current liabilities: $50,000
Total current liabilities equal:
Current Liabilities = $280,000 + $120,000 + $100,000 + $50,000
Current Liabilities = $550,000
If current assets equal $825,000:
Current Ratio = $825,000 ÷ $550,000
Current Ratio = 1.50
Understanding what created the $550,000 denominator is as important as knowing the final ratio.
What Does a Current Ratio of 1 Mean?
A current ratio of 1.0 means reported current assets equal reported current liabilities.
For example:
Current assets = $700,000
Current liabilities = $700,000
Current Ratio = $700,000 ÷ $700,000 = 1.00
This does not mean every liability can necessarily be paid immediately.
If $400,000 of current assets consist of slow-moving inventory while large obligations are due tomorrow, practical liquidity could be much tighter than the ratio suggests.
Conversely, a company that collects customer cash rapidly may be able to operate effectively with a relatively modest ratio.
The quality and timing of assets matter.
What Does a Current Ratio Above 1 Mean?
A ratio above 1 means current assets exceed current liabilities.
Suppose:
Current assets = $1.5 million
Current liabilities = $1 million
Current Ratio = $1,500,000 ÷ $1,000,000
Current Ratio = 1.50
The company reports 50% more current assets than current liabilities.
This generally provides more balance-sheet liquidity than a ratio below 1, all else equal.
But all else is rarely equal.
A current ratio of 1.5 dominated by overdue receivables and obsolete inventory can be weaker than another company’s 1.2 composed largely of cash and rapidly collected customer balances.
The composition of the numerator can matter as much as its size.
What Does a Current Ratio Below 1 Mean?
A current ratio below 1 means reported current liabilities exceed current assets.
Suppose:
Current assets = $600,000
Current liabilities = $800,000
Current Ratio = $600,000 ÷ $800,000
Current Ratio = 0.75
The company has approximately $0.75 of current assets for each $1 of current liabilities.
That can indicate greater short-term liquidity pressure, particularly when the company also has weak cash generation, slow collections, limited borrowing capacity, or imminent obligations.
A ratio below 1 does not automatically prove insolvency.
Some businesses collect cash very quickly, turn inventory rapidly, or receive customer funds before paying suppliers. Those operating characteristics can reduce the amount of balance-sheet working capital required.
The cash conversion cycle can help explain this distinction.
Is a Higher Current Ratio Better?
Not indefinitely.
Increasing the ratio generally strengthens the mathematical relationship between current assets and current liabilities.
However, a very high current ratio can reflect inefficient use of resources.
A company may be holding excessive inventory.
Receivables may be accumulating because customers are not paying.
Cash may be sitting unused despite attractive investment opportunities.
Management could also be avoiding productive short-term financing.
Liquidity is valuable, but maximizing the current ratio is not the same as maximizing business value.
What Is a Good Current Ratio?
There is no universal current ratio that is appropriate for every business.
Industry, operating model, inventory requirements, supplier terms, customer payment patterns, seasonality, access to credit, and cash-flow stability can all affect an appropriate liquidity structure.
A retailer with rapid inventory movement may operate differently from a construction company with lengthy projects and slow receivable collections.
An asset-light subscription company may have a different working-capital model from a manufacturer.
The most useful comparisons are usually the company’s own trend and genuinely comparable businesses using consistent definitions.
Current Ratio vs Quick Ratio
The current ratio includes all qualifying current assets.
Current Ratio = Current Assets ÷ Current Liabilities
The quick ratio uses a narrower set of assets and typically excludes inventory and certain other less-liquid current assets.
Consider:
Cash = $150,000
Receivables = $300,000
Inventory = $450,000
Other current assets = $100,000
Current liabilities = $500,000
Current assets total:
Current Assets = $150,000 + $300,000 + $450,000 + $100,000
Current Assets = $1,000,000
Current ratio:
Current Ratio = $1,000,000 ÷ $500,000 = 2.00
If the quick-ratio calculation includes only the $150,000 cash and $300,000 receivables:
Quick Ratio = $450,000 ÷ $500,000
Quick Ratio = 0.90
The difference shows that much of the company’s apparent current liquidity depends on inventory and other excluded assets.
Current Ratio vs Cash Ratio
The cash ratio is more restrictive again.
Cash Ratio = Cash and Cash Equivalents ÷ Current Liabilities
Using the previous example:
Cash Ratio = $150,000 ÷ $500,000
Cash Ratio = 0.30
The same company therefore has:
Current ratio = 2.00
Quick ratio = 0.90
Cash ratio = 0.30
None of these numbers contradict one another.
Each progressively narrows the definition of assets available to support current liabilities.
Current Ratio vs Working Capital
Current ratio and working capital use the same broad balance-sheet categories but express them differently.
Working Capital = Current Assets − Current Liabilities
Current Ratio = Current Assets ÷ Current Liabilities
Suppose current assets equal $1 million and current liabilities equal $500,000.
Working capital:
Working Capital = $1,000,000 − $500,000
Working Capital = $500,000
Current ratio:
Current Ratio = $1,000,000 ÷ $500,000
Current Ratio = 2.00
Now consider a much larger company with $10 million of current assets and $9.5 million of current liabilities.
Working capital is also:
Working Capital = $10,000,000 − $9,500,000 = $500,000
Yet its current ratio is:
Current Ratio = $10,000,000 ÷ $9,500,000 ≈ 1.05
Both companies have $500,000 of working capital, but their proportional liquidity positions differ substantially.
Current Ratio and Accounts Receivable
Receivables can make a significant contribution to current assets.
However, a receivable is useful for liquidity only if it can be collected on commercially reasonable terms.
Suppose a company reports $1 million of receivables but customers are paying progressively later.
Its current ratio may remain unchanged or even rise while actual cash pressure worsens.
Days sales outstanding helps examine collection speed.
A high current ratio accompanied by deteriorating DSO deserves more scrutiny than the ratio alone suggests.
Current Ratio and Inventory
Inventory can materially influence the current ratio.
A business can increase its ratio simply because unsold inventory accumulates.
Suppose current assets initially consist of:
Cash: $200,000
Receivables: $300,000
Inventory: $300,000
Total = $800,000
With $500,000 of current liabilities:
Current Ratio = $800,000 ÷ $500,000 = 1.60
Inventory then increases by $200,000 while everything else remains unchanged.
New current assets = $1 million.
New Current Ratio = $1,000,000 ÷ $500,000 = 2.00
The ratio improved mathematically.
Yet if the additional inventory exists because products stopped selling, the company’s economic liquidity may actually have deteriorated.
Inventory turnover and days inventory outstanding provide the necessary operating context.
Current Ratio and Accounts Payable
Accounts payable commonly forms a large part of current liabilities.
When payable balances increase, the denominator rises and the current ratio can fall.
However, supplier credit can also finance operating activity.
A business receiving 60-day payment terms may need less immediate cash than a business required to pay suppliers upfront.
Days payable outstanding adds that timing perspective.
A declining current ratio caused by normal supplier credit is different from a decline caused by overdue bills the company cannot pay.
Current Ratio and the Cash Conversion Cycle
The current ratio is static.
The cash conversion cycle is dynamic.
The current ratio asks how current assets compare with current liabilities on the balance sheet.
The cash conversion cycle estimates how quickly inventory and receivables cycle toward cash after considering supplier payment timing.
Two companies can report the same current ratio while having very different CCCs.
A company that collects customer cash before paying suppliers may need less static working capital than a company whose cash remains tied up for months.
This is why liquidity ratios become more informative when paired with operating-cycle measures.
Current Ratio and Cash Flow Forecasting
A ratio calculated today cannot show next month’s liquidity.
Cash flow forecasting estimates future cash receipts, payments, and balances.
Suppose a company has a current ratio of 1.8.
Management already knows that a large tax payment, equipment purchase, and debt installment are due next month.
The current ratio alone cannot map those future cash movements.
Likewise, a company with a ratio of 0.9 may have substantial contracted customer collections arriving before major obligations become due.
Static ratios and forward cash forecasts answer different questions.
Current Ratio and Operating Cash Flow
Operating cash flow measures cash generated or consumed by normal operations over a period.
The current ratio measures balance-sheet amounts at a specific date.
A company can have a high current ratio and weak operating cash flow if receivables and inventory continually increase.
Another can maintain a relatively low current ratio while generating strong cash from customers.
The flow of cash therefore provides information that the point-in-time ratio cannot.
Current Ratio and Free Cash Flow
Free cash flow examines cash generation after specified capital requirements under its chosen definition.
It should not be confused with current ratio.
A company might have a high current ratio after raising debt or equity even though free cash flow is negative.
Another company can generate strong free cash flow and deliberately distribute or reinvest excess cash, resulting in a lower current ratio.
Liquidity position and cash generation are connected but distinct.
Current Ratio and Debt
Short-term borrowing and the current portion of long-term debt can increase current liabilities.
As those amounts rise, the current ratio can decline if current assets do not increase proportionately.
Suppose current assets are $1 million and current liabilities are $600,000.
Current Ratio = $1,000,000 ÷ $600,000 ≈ 1.67
If $200,000 of debt becomes current:
New Current Liabilities = $800,000
New Current Ratio = $1,000,000 ÷ $800,000 = 1.25
Nothing changed in current assets, but the near-term liability structure changed materially.
Broader capital structure should be evaluated separately through measures such as the debt-to-equity ratio and interest coverage ratio.
Current Ratio and Burn Rate
A cash-consuming startup can maintain a seemingly strong current ratio shortly after raising financing.
Suppose it receives several million dollars of new cash.
Current assets increase sharply, raising the current ratio.
If the business then has a high burn rate, that liquidity can decline month after month.
A static current ratio does not show the speed of that decline.
Cash runway provides the corresponding time-based perspective.
Current Ratio and Profitability
The current ratio does not measure profit.
A company can be highly profitable while maintaining a relatively lean current-asset position.
Another can report large current assets but persistent operating losses.
Similarly, an accumulation of unsold inventory can increase current assets while simultaneously hurting profitability.
Net profit and gross margin therefore answer different questions from the current ratio.
Liquidity and profitability should be evaluated separately before examining how they interact.
How Transactions Change the Current Ratio
The current ratio can change in ways that are not always intuitive.
The effect depends on the starting ratio and which side of the balance sheet changes.
Consider a company with:
Current assets = $1,000,000
Current liabilities = $500,000
Current Ratio = 2.00
If the company uses $100,000 of cash to pay $100,000 of current liabilities:
New current assets = $900,000
New current liabilities = $400,000
New Current Ratio = $900,000 ÷ $400,000
New Current Ratio = 2.25
The ratio increases.
Now consider a company starting below 1:
Current assets = $400,000
Current liabilities = $500,000
Current Ratio = 0.80
It pays $100,000 of current liabilities using cash.
New current assets = $300,000
New current liabilities = $400,000
New Current Ratio = $300,000 ÷ $400,000
New Current Ratio = 0.75
The same type of transaction caused the ratio to decline.
Understanding the underlying mathematics prevents misleading conclusions from isolated changes.
Buying Inventory With Cash
Buying inventory with cash usually changes the composition of current assets rather than total current assets, assuming the transaction occurs at the same recorded amount and ignoring other effects.
Suppose cash falls $50,000 while inventory rises $50,000.
Total current assets remain unchanged.
Therefore, the current ratio initially remains unchanged.
However, liquidity quality changes because cash has been converted into inventory.
The quick ratio and cash ratio would normally respond differently because inventory is excluded from their narrower numerators.
Buying Inventory on Credit
When inventory is purchased on supplier credit, both current assets and current liabilities can rise.
Suppose the company initially has:
Current assets = $800,000
Current liabilities = $400,000
Current Ratio = 2.00
It purchases $100,000 of inventory on credit.
New current assets = $900,000
New current liabilities = $500,000
New Current Ratio = $900,000 ÷ $500,000
New Current Ratio = 1.80
The ratio declines even though current assets increased.
This demonstrates why an increase in assets does not necessarily improve a liquidity ratio.
Collecting Accounts Receivable
When a customer pays a receivable, one current asset is generally exchanged for another: receivables fall and cash rises.
If the amount collected equals the receivable carrying amount and there are no other effects, total current assets remain the same.
The current ratio therefore generally remains unchanged immediately.
Yet practical liquidity improves because cash is more immediately usable than an outstanding receivable.
Again, the current ratio captures quantity, not all aspects of asset quality.
Writing Off Bad Receivables
If an uncollectible receivable is removed from current assets without an offsetting increase in another current asset, total current assets fall.
Suppose current assets are $900,000 and current liabilities are $600,000.
Current Ratio = $900,000 ÷ $600,000 = 1.50
A $60,000 receivable is written off.
New current assets = $840,000.
New Current Ratio = $840,000 ÷ $600,000 = 1.40
The decline reflects the recognition that part of the previously reported current-asset base was not economically recoverable.
Current Ratio Trend Analysis
Tracking the current ratio over several periods can reveal meaningful changes.
Suppose:
Year 1 = 1.70
Year 2 = 1.45
Year 3 = 1.18
The downward trend warrants investigation.
Perhaps current debt increased.
Maybe cash declined because of investment.
Accounts payable may have grown.
Alternatively, management might be operating more efficiently and deliberately holding less working capital.
Trend analysis tells you that the relationship changed—not why.
The reason must be found in the underlying balance sheet and cash flows.
Seasonal Businesses
Seasonality can make one current-ratio calculation misleading.
A retailer may build inventory substantially before its peak sales period.
At that point, current assets can appear high because inventory is high.
After the selling season, inventory can decline and cash or receivables can rise.
Current liabilities may also move with seasonal purchasing.
Comparing the same point in each operating cycle is usually more meaningful than comparing arbitrary months with very different seasonal characteristics.
Can the Current Ratio Be Too High?
Yes, at least economically.
A very high current ratio can indicate substantial liquidity, but it can also reflect excessive cash, slow receivables, overstocked inventory, or insufficient use of short-term financing.
Suppose a business has a ratio of 5.0 because inventory doubled while sales declined.
The high ratio is not evidence of superior operating performance.
The important issue is whether current assets are productive, collectible, saleable, and appropriate for the company’s needs.
Can the Current Ratio Be Negative?
The conventional current ratio is generally not negative because current assets and current liabilities are ordinarily reported as nonnegative balance-sheet totals.
If current liabilities are zero, division is undefined rather than producing a meaningful conventional current ratio.
If unusual input data result in a negative value, the classifications and calculation should be reviewed before interpreting the number.
How to Improve the Current Ratio
The ratio can improve mathematically through an increase in current assets relative to current liabilities or a reduction in current liabilities under suitable circumstances.
Operationally, that might come from retaining more cash, collecting receivables, refinancing short-term obligations into appropriately structured longer-term financing, generating profits that remain within current assets, or changing working-capital management.
However, management should not optimize the ratio mechanically.
Borrowing long-term merely to accumulate idle cash can raise the current ratio while increasing leverage.
Likewise, cutting inventory too aggressively can increase liquidity but cause shortages and lost sales.
The financial objective is sustainable liquidity, not the largest possible ratio.
Common Current Ratio Mistakes
One mistake is treating every current asset as equally liquid.
Another is assuming a ratio above 1 guarantees that obligations can be paid on time.
Comparisons across unrelated industries can also be misleading.
Analysts may ignore seasonality, overdue receivables, obsolete inventory, debt maturities, or supplier-payment patterns.
Using only one reporting date can hide substantial volatility during the year.
Finally, the current ratio should not be confused with cash flow. It is calculated from balance-sheet stocks rather than cash movements over time.
Limitations of the Current Ratio
The current ratio compresses several different assets and liabilities into one number.
It does not show whether receivables are overdue.
It does not show whether inventory is obsolete.
It does not tell you exactly when liabilities become payable.
It does not measure future operating cash generation.
It can change because of accounting classifications or seasonal balance-sheet movements.
It also gives the same weight to $1 of cash and $1 of inventory even though their practical liquidity can differ significantly.
That simplicity makes the ratio easy to calculate but unsuitable as a complete liquidity assessment.
How to Analyze the Current Ratio Properly
Begin with the calculation.
Then examine the composition of current assets.
Determine how much consists of cash, receivables, inventory, and other balances.
Review receivable collection and inventory turnover.
Inspect the composition and due dates of current liabilities.
Compare the result with the quick ratio and cash ratio.
Then connect the balance-sheet snapshot with cash-flow forecasts, operating cash generation, working-capital trends, and the company’s operating cycle.
The strongest analysis explains why the ratio is at its current level rather than simply labeling it good or bad.
Frequently Asked Questions
What is the current ratio?
The current ratio is a liquidity ratio that compares a company’s current assets with its current liabilities.
What is the current ratio formula?
Current Ratio = Current Assets ÷ Current Liabilities
What does a current ratio of 1.5 mean?
It means the company reports approximately $1.50 of current assets for every $1 of current liabilities.
What does a current ratio of 1 mean?
It means reported current assets and current liabilities are equal.
What does a current ratio below 1 mean?
It means current liabilities exceed current assets. That can indicate tighter short-term liquidity but should be interpreted alongside cash generation, asset quality, payment timing, and industry economics.
Is a current ratio above 1 good?
It generally indicates that current assets exceed current liabilities, but it does not guarantee strong liquidity. Inventory quality, receivable collection, liability timing, and cash flow still matter.
What is a good current ratio?
There is no universal ideal. Appropriate levels vary by industry, business model, seasonality, cash-flow stability, supplier terms, customer payment behavior, and financing access.
What is the difference between current ratio and quick ratio?
The current ratio includes all qualifying current assets. The quick ratio excludes inventory and certain less-liquid current assets.
What is the difference between current ratio and cash ratio?
The cash ratio generally includes only cash and cash equivalents in the numerator, making it substantially more conservative.
Is current ratio the same as working capital?
No. Working capital subtracts current liabilities from current assets and produces an absolute amount. Current ratio divides the two and produces a proportional measure.
Does inventory count in the current ratio?
Yes, inventory classified as a current asset is normally included in the current-ratio numerator.
Can a profitable business have a poor current ratio?
Yes. Profitability and liquidity are different. A profitable company can have substantial receivables, inventory, debt maturities, or other working-capital pressures.
Final Perspective
The current ratio provides a simple view of short-term balance-sheet liquidity:
Current Ratio = Current Assets ÷ Current Liabilities
The formula is easy.
The interpretation requires more work.
A ratio above 1 does not guarantee that every obligation can be paid. A ratio below 1 does not automatically mean a company is failing. Cash, receivables, inventory, supplier terms, debt maturities, seasonality, and operating cash generation all influence the real liquidity position.
The current ratio becomes most useful when it starts the analysis rather than ends it.
Ask what makes up current assets. Determine whether receivables are collectible and inventory is moving. Understand when liabilities fall due. Compare the result with quick and cash ratios. Then connect those balance-sheet numbers with actual and forecast cash flows.
That reveals what the current ratio is intended to show: the relationship between short-term financial resources and short-term obligations, with enough context to determine whether that relationship is genuinely sustainable.




