


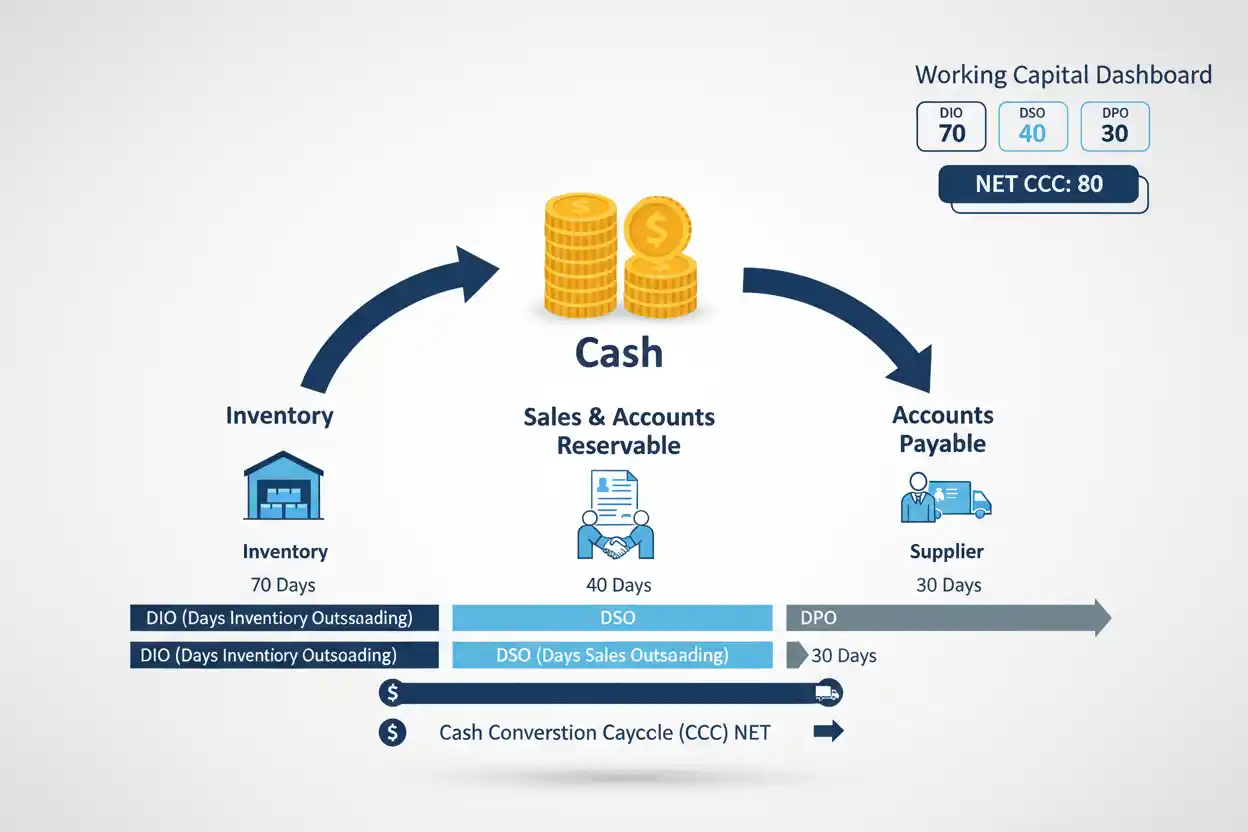
The cash conversion cycle, or CCC, measures the approximate number of days between committing cash to operating resources and recovering cash from customers after accounting for supplier payment timing.
It combines three working-capital measures: days inventory outstanding, days sales outstanding, and days payable outstanding.
The standard formula is:
Cash Conversion Cycle = Days Inventory Outstanding + Days Sales Outstanding − Days Payable Outstanding
If a company holds inventory for 50 days, collects customer receivables in 35 days, and takes 40 days to pay suppliers:
Cash Conversion Cycle = 50 + 35 − 40 = 45 days
The business therefore has an estimated 45-day cash conversion cycle under those assumptions.
A shorter cycle generally means less time between cash commitment and cash recovery. However, the lowest possible number is not automatically the best outcome. Inventory availability, customer payment terms, supplier relationships, purchasing economics, and business model all influence what a sustainable cycle looks like.
Within business finance, the cash conversion cycle is particularly useful because it connects operational activity directly with working capital and liquidity.
What Is the Cash Conversion Cycle?
The cash conversion cycle measures how long cash is effectively tied up in a company’s operating cycle.
For an inventory-based business, cash may first be committed when inventory is purchased. The company then waits for the inventory to sell. If the sale is made on credit, it waits again for the customer to pay.
Supplier credit can delay the company’s own cash payment, reducing the amount of time its money is tied up.
The CCC combines those movements into a single days-based measure.
Conceptually:
Buy inventory → hold inventory → sell to customer → collect cash
while supplier payment terms offset part of the time:
Receive supplier credit → pay supplier later
The result is not a literal timestamp for every dollar. It is an operating-efficiency metric built from average financial relationships.
Cash Conversion Cycle Formula
The standard formula is:
CCC = DIO + DSO − DPO
where:
DIO means Days Inventory Outstanding.
DSO means Days Sales Outstanding.
DPO means Days Payable Outstanding.
Expanded:
Cash Conversion Cycle = Days Inventory Outstanding + Days Sales Outstanding − Days Payable Outstanding
Each component measures a different portion of the operating cycle.
DIO measures approximately how long inventory remains before being sold.
DSO estimates how long the company takes to collect receivables from customers.
DPO estimates how long the business takes to pay qualifying supplier obligations.
The subtraction of DPO reflects the financing benefit created by supplier payment terms.
Cash Conversion Cycle Example
Consider a wholesaler with the following operating metrics:
DIO = 60 days
DSO = 30 days
DPO = 45 days
The calculation is:
Cash Conversion Cycle = 60 + 30 − 45
Cash Conversion Cycle = 45 days
The business takes approximately 90 days from inventory holding through customer collection, but its supplier payment terms finance 45 of those days.
The net modeled cash conversion period is therefore 45 days.
If the company improves inventory movement so DIO falls from 60 to 50 days while everything else remains unchanged:
New CCC = 50 + 30 − 45
New CCC = 35 days
The cash conversion cycle improves by 10 days.
That reduction can decrease the amount of capital tied up in operations if the change reflects genuine operating improvement rather than inadequate inventory.
How to Calculate Days Inventory Outstanding
Days Inventory Outstanding estimates the average time inventory remains in the business before being sold.
A common formula is:
DIO = Average Inventory ÷ Cost of Goods Sold × Number of Days
Suppose annual cost of goods sold is $2,400,000 and average inventory is $400,000.
Using 365 days:
DIO = $400,000 ÷ $2,400,000 × 365
DIO ≈ 60.8 days
The company holds approximately 61 days of inventory under the calculation.
DIO is closely related to inventory turnover. A company turning inventory more frequently generally reports a lower number of inventory days, assuming consistent definitions and periods.
However, lower inventory days are not automatically better if the reduction causes shortages, lost sales, production disruption, or higher emergency purchasing costs.
How to Calculate Days Sales Outstanding
Days Sales Outstanding estimates the average time required to collect customer receivables.
A common formula is:
DSO = Average Accounts Receivable ÷ Credit Sales × Number of Days
Suppose average receivables equal $300,000 and annual credit sales total $3,650,000.
DSO = $300,000 ÷ $3,650,000 × 365
DSO = 30 days
The company therefore takes approximately 30 days to collect the receivables represented by the model.
When reliable credit-sales data are unavailable, analysts sometimes use total revenue as an approximation, but that substitution should be understood because cash sales do not create accounts receivable.
DSO is therefore most informative when the numerator and denominator reflect the same underlying activity.
How to Calculate Days Payable Outstanding
Days Payable Outstanding estimates how long a business takes to pay suppliers for operating purchases represented in accounts payable.
A common version is:
DPO = Average Accounts Payable ÷ Cost of Goods Sold × Number of Days
Suppose average accounts payable is $360,000 and annual cost of goods sold is $2,920,000.
DPO = $360,000 ÷ $2,920,000 × 365
DPO ≈ 45 days
This indicates that supplier obligations remain outstanding for approximately 45 days on average under the calculation.
Cost of goods sold is often used as a practical denominator when purchase data are not readily available, although purchases can be more conceptually precise because accounts payable arise from purchases rather than from cost recognition itself.
Consistency matters when comparing DPO across periods.
Complete Cash Conversion Cycle Calculation
Assume a company reports:
Average inventory: $600,000
Average accounts receivable: $450,000
Average accounts payable: $400,000
Annual cost of goods sold: $3,650,000
Annual credit sales: $5,475,000
First calculate DIO:
DIO = $600,000 ÷ $3,650,000 × 365
DIO = 60 days
Then calculate DSO:
DSO = $450,000 ÷ $5,475,000 × 365
DSO = 30 days
Now calculate DPO:
DPO = $400,000 ÷ $3,650,000 × 365
DPO = 40 days
Finally:
Cash Conversion Cycle = 60 + 30 − 40
Cash Conversion Cycle = 50 days
The company’s modeled operating cash is tied up for approximately 50 days between inventory investment and customer cash recovery after accounting for supplier financing.
Why the Cash Conversion Cycle Matters
A profitable company can still experience financial pressure when cash remains tied up in operating assets for too long.
Inventory requires funding.
Accounts receivable represent sales for which cash has not yet been collected.
Meanwhile, payroll, rent, taxes, debt obligations, and suppliers may still need to be paid.
The cash conversion cycle helps reveal this timing problem.
A company whose CCC expands from 40 days to 75 days may need substantially more financing even if annual revenue and accounting profit remain stable.
That is why the metric complements cash flow forecasting and working capital analysis.
Cash Conversion Cycle and Working Capital
Working capital is commonly expressed as:
Working Capital = Current Assets − Current Liabilities
The current ratio provides another perspective on short-term financial position:
Current Ratio = Current Assets ÷ Current Liabilities
These measures tell management how current assets and liabilities compare at a particular point.
The cash conversion cycle asks a different question:
How quickly do important operating working-capital accounts move through the business?
A company could have a substantial positive working-capital balance but still operate inefficiently if inventory sits for months or customers pay slowly.
Conversely, some highly efficient businesses can operate with relatively modest working capital because inventory moves quickly and customers pay before suppliers must be paid.
Cash Conversion Cycle vs Operating Cycle
The operating cycle generally focuses on the time from acquiring inventory to collecting cash from the related customer sale.
Conceptually:
Operating Cycle = DIO + DSO
The cash conversion cycle adjusts that period for supplier payment timing:
Cash Conversion Cycle = Operating Cycle − DPO
Suppose DIO is 55 days and DSO is 25 days.
Operating Cycle = 55 + 25 = 80 days
If DPO is 35:
Cash Conversion Cycle = 80 − 35 = 45 days
The difference is important because supplier credit finances part of the operating cycle.
What Does a Short Cash Conversion Cycle Mean?
A relatively short CCC generally indicates that a company converts its investment in inventory and receivables back into cash quickly after considering accounts payable.
Possible reasons include rapid inventory turnover, fast customer collections, favorable supplier credit, or some combination of these factors.
A shorter cycle can reduce the need for external working-capital financing.
However, aggressive efforts to minimize the metric can create other problems.
Reducing inventory too far may cause lost sales.
Demanding immediate payment from customers may weaken competitiveness.
Delaying suppliers beyond agreed terms may damage relationships or creditworthiness.
Efficiency should therefore be evaluated economically rather than by trying to minimize the CCC at any cost.
What Does a Long Cash Conversion Cycle Mean?
A longer cash conversion cycle means more time passes before operating cash is recovered.
The cause could be slow-moving inventory, delayed customer collections, shorter supplier payment terms, or a combination of these factors.
Suppose a company’s CCC increases from 50 to 80 days.
Management should not immediately conclude that all operating efficiency deteriorated.
Instead, inspect each component.
Perhaps DIO increased because management intentionally purchased inventory ahead of a seasonal sales period.
Maybe DSO increased because the company expanded into a customer segment that requires longer credit terms.
Alternatively, DPO may have fallen because suppliers reduced payment terms.
The change in the headline ratio identifies where to investigate; the components explain why.
Can the Cash Conversion Cycle Be Negative?
Yes.
A negative cash conversion cycle occurs when DPO exceeds the combined inventory and receivable period.
For example:
DIO = 20 days
DSO = 5 days
DPO = 40 days
CCC = 20 + 5 − 40
CCC = −15 days
Under this simplified example, the company collects cash approximately 15 days before paying its suppliers.
This structure can occur in businesses where inventory sells quickly, customers pay immediately, and suppliers provide extended payment terms.
A negative CCC can provide favorable working-capital economics, but it should not automatically be assumed to mean the entire business is financially superior.
Margins, supplier dependence, inventory availability, leverage, and other risks still matter.
Is a Negative Cash Conversion Cycle Good?
It can be financially advantageous because the operating model may generate customer cash before supplier payments become due.
That reduces the amount of the company’s own capital required to finance working capital.
However, sustainability matters.
If negative CCC depends on unusually generous supplier terms, the economics could change if vendors tighten credit.
Likewise, extreme inventory reduction might improve the ratio temporarily while creating stockouts.
The quality of the operating model matters more than achieving a negative number by itself.
Cash Conversion Cycle and Inventory Turnover
Inventory frequently represents the largest controllable element of the CCC for retailers, manufacturers, wholesalers, and distributors.
Inventory turnover measures how frequently inventory moves through the business.
A simplified relationship is:
Inventory Turnover = Cost of Goods Sold ÷ Average Inventory
DIO expresses similar information in days.
When inventory turnover rises, DIO generally declines.
Suppose average inventory falls from $1 million to $750,000 while cost of goods sold remains constant. Inventory days should decline, helping shorten the cash conversion cycle.
But the business should determine whether the reduction comes from better forecasting and supply management or from insufficient stock.
Cash Conversion Cycle and Accounts Receivable
Receivables represent revenue that has been recognized or billed but not yet collected in cash under the company’s accounting and sales arrangements.
If receivables grow faster than sales, DSO may increase.
That can lengthen the cash conversion cycle.
Several causes are possible: customers may be paying late, the company may have deliberately offered longer terms, disputes may have increased, or sales may have shifted toward customers that purchase on credit.
Improving collections can shorten the CCC without requiring higher revenue.
For this reason, DSO and receivables aging should be reviewed together rather than relying solely on the overall cycle.
Cash Conversion Cycle and Supplier Terms
Supplier credit effectively finances part of the operating cycle.
Longer legitimate payment terms can increase DPO and shorten the CCC.
Suppose DIO and DSO together equal 70 days.
At 30 days of DPO:
CCC = 70 − 30 = 40 days
At 45 days of DPO:
CCC = 70 − 45 = 25 days
The additional supplier credit reduces the modeled cash financing period by 15 days.
However, deliberately paying invoices late is not the same as negotiating better payment terms.
Chronic late payment can lead to fees, weaker supplier relationships, supply restrictions, lost discounts, or tighter future terms.
The goal is sustainable working-capital management, not simply delaying obligations.
How Revenue Growth Can Increase the Cash Conversion Cycle Burden
Growth often increases working-capital needs before it improves available cash.
Suppose a manufacturer receives a major increase in customer orders.
It may need to purchase more raw material first. Inventory rises.
After completing and shipping the orders, customers may have 30- or 60-day payment terms. Accounts receivable then rises.
Revenue and gross profit can increase while available cash temporarily declines.
If suppliers require payment before customers settle their invoices, growth creates a financing gap.
This is one reason strong sales growth does not automatically translate into stronger liquidity.
Cash Conversion Cycle and Profitability
CCC is an operating liquidity measure, not a profit measure.
A company with an efficient cash conversion cycle can still have weak margins.
A business with a longer cycle may generate strong gross margin and net profit.
The metrics answer different questions.
Profitability asks how much economic income remains after costs.
Cash conversion examines how quickly operating capital moves through inventory, receivables, and payables.
Both matter because a profitable business still needs sufficient cash to finance the time between spending and collection.
Cash Conversion Cycle and Free Cash Flow
Working-capital changes can affect free cash flow.
If inventory and accounts receivable expand materially while accounts payable does not provide an offset, additional cash becomes tied up in operations.
That can reduce operating cash flow even if reported profit rises.
Conversely, releasing excess inventory or collecting overdue receivables can improve cash generation.
A shorter cash conversion cycle can therefore support stronger cash flow, but the relationship should be understood through the actual balance-sheet movements rather than assuming every one-day CCC reduction translates into a fixed cash amount.
Cash Conversion Cycle and Burn Rate
For companies currently consuming cash, working-capital efficiency can influence burn rate.
Suppose a growing startup sells physical products.
Even if customer demand improves, the business may continue burning substantial cash because it must finance inventory and wait for customer payments.
Reducing inventory days or improving collections can lower cash consumption without cutting productive operating expenses.
That makes the CCC particularly relevant when burn is driven partly by operating timing rather than only by an unprofitable cost structure.
Cash Conversion Cycle and Cash Runway
A company with limited cash runway may need to understand how working-capital movements affect the timing of its cash needs.
Imagine a business with six months of modeled runway.
If a seasonal inventory build requires a major upfront cash commitment, actual liquidity could become tight earlier than the simple runway calculation implies.
Likewise, collecting a large receivable sooner than expected can extend available operating time.
Cash runway and CCC therefore complement one another: runway focuses on available cash relative to consumption, while the cash conversion cycle explains part of the operating timing behind that cash consumption.
Cash Conversion Cycle and the Cash Ratio
The cash ratio measures the relationship between highly liquid cash resources and current liabilities.
The cash conversion cycle instead measures operating timing.
A business might have a low cash ratio but a very efficient CCC that consistently converts sales into cash before supplier obligations become due.
Another business may hold substantial cash while operating with slow-moving inventory and overdue receivables.
Neither metric should replace the other.
Liquidity is best understood from both balance-sheet capacity and operating cash behavior.
Cash Conversion Cycle by Industry
Industry structure strongly influences normal cash conversion cycles.
A retailer that sells inventory immediately to customers paying by card can have very low DSO.
A manufacturer may have longer DIO because production and storage require time.
A business selling large projects on 60-day credit terms may naturally have higher DSO.
Service companies with little or no inventory may find DIO irrelevant, making the traditional CCC less useful.
This is why cross-industry comparisons can be misleading.
The strongest benchmark is usually the company’s own history combined with genuinely comparable competitors.
Seasonal Businesses
Seasonality can distort a single-period cash conversion cycle.
A retailer may intentionally build inventory months before a major holiday season. DIO may increase before the corresponding sales occur.
After the sales period, inventory falls rapidly and receivables may convert into cash.
Calculating the ratio at only one balance-sheet date can therefore produce a misleading picture.
Average balances and multi-period trends are particularly useful for seasonal companies.
Cash flow forecasting should also model the timing of these seasonal working-capital requirements directly.
How to Improve the Cash Conversion Cycle
A company can shorten its CCC by reducing inventory days, collecting receivables faster, obtaining longer legitimate supplier terms, or combining improvements across all three components.
Inventory improvements may come from better demand forecasting, purchasing discipline, production scheduling, product rationalization, or supplier coordination.
Receivables improvements may involve clearer credit policies, accurate invoices, earlier dispute resolution, payment reminders, deposits, or more appropriate customer terms.
Payables improvements can involve negotiating supplier terms that better match the company’s operating cycle.
The best change is not always the one that produces the largest ratio reduction. Each improvement should preserve the commercial relationships and operating capability needed to run the business.
How Much Cash Can a Shorter Cycle Release?
A shorter CCC can reduce working-capital requirements, but translating days into cash requires examining the component that changed.
Suppose annual credit sales are $7.3 million.
Average daily credit sales are:
Average Daily Credit Sales = $7,300,000 ÷ 365
Average Daily Credit Sales = $20,000
If DSO falls by five days, the approximate reduction in receivables under stable sales can be:
Estimated Receivables Reduction = $20,000 × 5
Estimated Receivables Reduction = $100,000
That does not mean every five-day CCC improvement creates $100,000 of cash.
If the improvement came from inventory instead, the relevant daily cost base would differ. If DPO changed, the effect would arise through supplier obligations.
The component matters.
Cash Conversion Cycle Trend Analysis
A single CCC result has limited context.
Suppose a company’s cycle moves:
Year 1: 62 days
Year 2: 54 days
Year 3: 47 days
The downward trend suggests improved working-capital efficiency.
Management should then determine which component created the improvement.
If DSO fell because collections improved while DIO and DPO remained stable, that is different from a decline caused by stretching supplier payments.
Likewise, a rising CCC is not automatically negative if it reflects a temporary strategic inventory investment.
Trend analysis works best when the underlying operating reason is understood.
Common Cash Conversion Cycle Mistakes
One mistake is using inconsistent periods.
Annual revenue should not be combined casually with a one-month balance that is highly seasonal.
Another is using ending inventory, receivables, or payables when balances changed significantly during the period. Average balances can provide a better representation.
Analysts may also use total revenue for DSO when a large portion of sales is cash-based, which can distort the collection-period estimate.
DPO can become inaccurate when cost of goods sold differs materially from purchasing activity.
The broadest mistake is treating a lower CCC as inherently superior without checking what changed operationally.
Cash Conversion Cycle Limitations
The CCC simplifies complex working-capital behavior into three average measures.
It does not capture every operating cash flow.
Payroll, taxes, capital expenditure, financing payments, prepaid expenses, deferred revenue, and other items can materially influence liquidity without appearing directly in the formula.
Average balances can also conceal volatility.
Two companies might report identical annual-average DSO even though one collects consistently while the other experiences severe month-to-month swings.
The cash conversion cycle should therefore be used as a diagnostic tool within a broader financial analysis rather than as a complete cash-flow model.
How to Analyze the Cash Conversion Cycle Properly
Start with the overall CCC, but do not stop there.
Separate it into DIO, DSO, and DPO.
Compare each component with prior periods and appropriate peers.
Then examine the underlying accounts: inventory composition, receivables aging, supplier terms, purchasing patterns, seasonal effects, and disputed balances.
Finally, connect those operational findings with liquidity and financial performance.
A changing CCC matters because of what it reveals about cash, not because the number itself needs to be optimized.
Frequently Asked Questions
What is the cash conversion cycle?
The cash conversion cycle measures the approximate number of days between committing cash to operating resources and recovering cash from customers after considering supplier payment timing.
What is the cash conversion cycle formula?
Cash Conversion Cycle = DIO + DSO − DPO
DIO is Days Inventory Outstanding, DSO is Days Sales Outstanding, and DPO is Days Payable Outstanding.
What does a 45-day cash conversion cycle mean?
A 45-day CCC means the company’s modeled operating cash remains tied up for approximately 45 days after accounting for inventory holding, customer collection, and supplier payment timing.
Is a lower cash conversion cycle better?
Generally, a shorter sustainable cycle means less capital is tied up in operations. However, excessively reducing inventory or stretching suppliers can create operational or commercial problems.
Can the cash conversion cycle be negative?
Yes. A negative cycle can occur when the company receives customer cash quickly while paying suppliers later.
What does a negative CCC mean?
It means the modeled supplier-payment period exceeds the combined inventory and customer-collection period. The company may therefore receive cash from customers before paying suppliers.
What increases the cash conversion cycle?
Higher inventory days, slower customer collections, or shorter supplier-payment periods can increase CCC.
What decreases the cash conversion cycle?
Faster inventory movement, quicker collections, or longer legitimate supplier terms can reduce the cycle.
Is CCC the same as working capital?
No. Working capital measures current assets minus current liabilities. CCC measures how quickly important operating working-capital accounts cycle through the business.
Is cash conversion cycle the same as operating cycle?
No. The operating cycle is commonly DIO plus DSO. The cash conversion cycle subtracts DPO to reflect supplier payment timing.
Does cash conversion cycle measure profitability?
No. CCC measures operating cash timing. A company can have a short cycle and weak profitability, or a longer cycle and strong margins.
What is a good cash conversion cycle?
There is no universal target. A useful benchmark depends on the industry, business model, supplier terms, customer payment patterns, inventory requirements, and the company’s own historical performance.
Final Perspective
The cash conversion cycle turns three working-capital relationships into one operating timeline:
Cash Conversion Cycle = DIO + DSO − DPO
DIO measures how long inventory remains in the business.
DSO measures how long customers take to pay.
DPO measures how long the company takes to pay suppliers.
The result helps answer an important financial question:
How long does the business need to finance its operating cycle before cash comes back?
That question becomes particularly important when a company is growing.
More sales can require more inventory and create more receivables before the related cash arrives. Without sufficient working capital, profitable growth can still produce a liquidity problem.
A useful CCC analysis therefore does not chase the lowest possible number. It identifies where cash is tied up, why it is tied up, and whether inventory, collections, and supplier terms are working together efficiently enough to support the business.




