


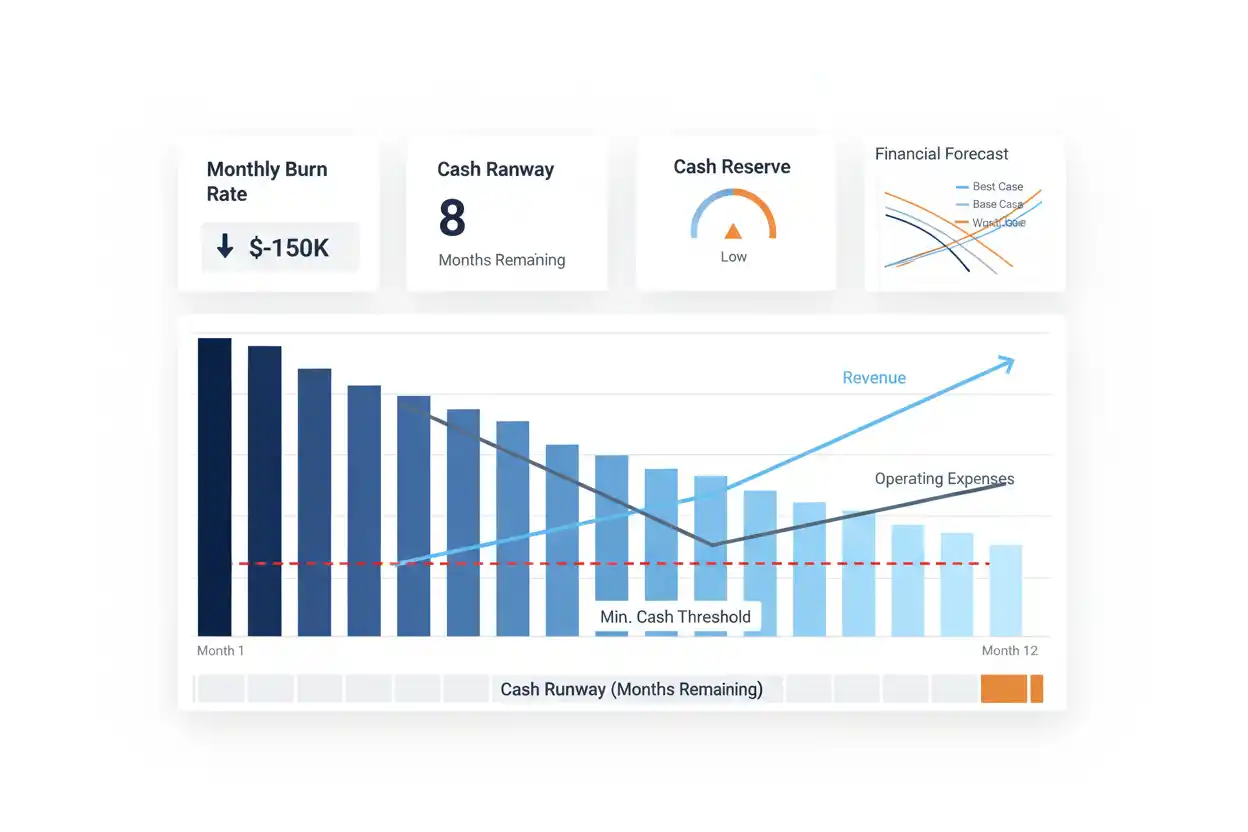
Burn rate measures how quickly a business is spending or losing cash over a defined period, usually expressed as an amount per month. It is particularly useful for startups and other companies operating with negative cash flow because it helps management understand how rapidly available cash is being consumed.
If a company starts a month with $900,000 in cash and finishes with $825,000 without receiving new financing, its net cash consumption for that month is $75,000.
Monthly Net Burn Rate = Beginning Cash − Ending Cash
Monthly Net Burn Rate = $900,000 − $825,000 = $75,000
Burn rate becomes more useful when combined with revenue, expenses, cash reserves, forecasts, and expected financing. It should therefore be treated as part of business finance rather than as a standalone measure of whether a company is healthy.
What Is Burn Rate?
Burn rate is the pace at which a company consumes cash.
In startup finance, the term commonly describes the amount of cash a company is using while its cash outflows exceed its cash inflows. A business spending $180,000 per month while collecting $120,000 has a different cash position from a business spending the same $180,000 while collecting only $30,000.
That distinction produces two useful versions of the metric: gross burn and net burn.
Gross burn focuses on cash operating outflows.
Net burn focuses on the amount by which cash outflows exceed cash inflows during the period.
For runway planning, net burn is generally the more direct measure because it shows how much the cash balance is actually declining under the assumptions used.
Burn Rate Formula
A simple net burn rate can be calculated from the decline in cash over a period.
Net Burn Rate = (Beginning Cash Balance − Ending Cash Balance) ÷ Number of Months
Suppose a startup begins a three-month period with $1,500,000 and ends with $1,230,000.
Net Cash Burn = $1,500,000 − $1,230,000 = $270,000
Average Monthly Net Burn Rate = $270,000 ÷ 3 = $90,000
The company consumed an average of $90,000 of cash per month during the period.
A second method calculates net burn from operating cash inflows and cash outflows.
Net Burn Rate = Monthly Cash Outflows − Monthly Cash Inflows
If monthly outflows are $240,000 and monthly inflows are $155,000:
Net Burn Rate = $240,000 − $155,000 = $85,000 per month
The appropriate calculation depends on what management is trying to understand and how consistently cash movements are classified.
Gross Burn Rate
Gross burn rate generally focuses on how much cash the business spends during the period before offsetting those expenditures with incoming operating cash.
A simplified calculation is:
Gross Burn Rate = Total Cash Operating Outflows ÷ Number of Months
Suppose a startup spends $750,000 over five months.
Average Monthly Gross Burn = $750,000 ÷ 5
Average Monthly Gross Burn = $150,000
Gross burn helps management understand the scale of the company’s spending base.
However, it does not show whether revenue or other operating inflows are offsetting those expenditures.
A company with $150,000 of gross burn and $140,000 of monthly operating cash inflows is in a very different position from a company with the same gross burn and only $20,000 of inflows.
Net Burn Rate
Net burn rate measures the amount of cash being consumed after cash inflows are considered.
A simplified operating version is:
Net Burn Rate = Gross Cash Outflows − Cash Inflows
Suppose monthly cash outflows are $200,000 while operating inflows are $125,000.
Net Burn Rate = $200,000 − $125,000
Net Burn Rate = $75,000 per month
If the company maintains the same pattern, its cash balance will decline by approximately $75,000 each month before considering financing, investing transactions, unusual payments, or other cash movements outside the simplified model.
Net burn is closely related to cash flow forecasting because the historical number alone cannot tell management what the company will consume next month.
Gross Burn vs Net Burn
Gross burn and net burn answer different questions.
Gross burn asks:
How much cash is the business spending?
Net burn asks:
How quickly is the business’s cash balance being depleted after inflows?
Imagine two startups that each spend $300,000 per month.
Company A earns $250,000 of monthly cash inflows.
Company A Net Burn = $300,000 − $250,000 = $50,000
Company B generates only $80,000.
Company B Net Burn = $300,000 − $80,000 = $220,000
Both companies have the same gross burn, but Company B is consuming available financing more than four times as quickly on a net basis.
This is why using the phrase “our burn is $300,000” without explaining whether it refers to gross or net burn can create confusion.
Burn Rate Example
Suppose a software company begins January with $2 million in available cash.
During the month, it receives $180,000 from customers and spends $320,000 on payroll, infrastructure, marketing, administration, and other cash operating expenses.
Gross burn is approximately:
Gross Burn = $320,000
Net burn is:
Net Burn = $320,000 − $180,000
Net Burn = $140,000
The company therefore ends the month with approximately:
Ending Cash = $2,000,000 − $140,000
Ending Cash = $1,860,000
The result provides a useful snapshot, but one month may not represent the company’s normal cash pattern.
Annual insurance payments, bonuses, tax payments, equipment purchases, seasonal collections, or customer prepayments can produce unusual monthly movements.
For that reason, an average over several representative months may provide a better operating baseline.
Burn Rate and Cash Runway
Burn rate becomes especially useful when converted into cash runway.
Cash runway estimates how long a business can continue consuming cash at a specified net burn rate before its available cash reserve is exhausted.
Cash Runway = Available Cash ÷ Monthly Net Burn Rate
Suppose a startup has $1.2 million of available cash and burns $100,000 per month.
Cash Runway = $1,200,000 ÷ $100,000
Cash Runway = 12 months
The company has approximately 12 months of runway if its cash balance and burn assumptions remain unchanged.
A dedicated cash runway analysis should go further by incorporating changing revenue, expenses, financing plans, restricted cash, minimum operating reserves, and scenario assumptions.
Runway is therefore an estimate, not an expiration date.
Burn Rate Changes Runway Quickly
The relationship between burn rate and runway is nonlinear from a management perspective because relatively modest spending changes can add or remove months of operating time.
Suppose available cash is $900,000.
At a net burn of $150,000 per month:
Runway = $900,000 ÷ $150,000 = 6 months
If net burn falls to $100,000:
Runway = $900,000 ÷ $100,000 = 9 months
Reducing monthly net burn by $50,000 adds three months of modeled runway.
If burn rises to $180,000:
Runway = $900,000 ÷ $180,000 = 5 months
The same cash reserve can therefore support dramatically different operating timelines depending on spending and inflows.
Is Burn Rate the Same as Expenses?
No.
Expenses are accounting costs recognized during a reporting period. Burn rate concerns cash consumption.
The two can be similar in some businesses, but they do not have to match.
Depreciation, for example, can reduce accounting earnings without representing a current cash payment. Conversely, buying equipment may create a substantial current cash outflow even though accounting expense is recognized over several periods through depreciation.
Timing also matters. A company might recognize an expense before or after the corresponding cash payment depending on its accounting method and transaction structure.
Burn rate should therefore be calculated from cash information when the objective is to understand liquidity.
Burn Rate Is Not the Same as Net Loss
A startup that reports a monthly accounting loss of $100,000 does not necessarily have a $100,000 burn rate.
Accounting profit and cash flow measure different things.
Receivables, payables, deferred revenue, inventory, depreciation, capital expenditures, financing transactions, and other balance-sheet movements can create differences between reported earnings and actual cash movement.
This is why net profit should not be substituted directly for burn rate.
A company can report a loss but consume relatively little cash during a particular period. Another can report modest profit while experiencing a cash squeeze because customers have not paid yet or because substantial cash has been invested elsewhere.
Burn Rate vs Cash Flow
Cash flow describes cash entering and leaving the business.
Burn rate is a narrower management measure that emphasizes the pace of cash consumption.
If a company’s operating inflows exceed its relevant outflows, it may have positive cash generation rather than net burn.
A company can therefore move from a positive burn rate to zero net burn and eventually to net cash generation as revenue and collections increase relative to spending.
Cash flow forecasting is essential because burn rate calculated from historical results is backward-looking.
Management needs to know not just what the company burned last month, but what it expects to burn over the next several months.
Burn Rate and Revenue Growth
Rising revenue can reduce net burn if the additional sales produce sufficient cash inflows without creating even larger outflows.
Suppose gross monthly burn remains $250,000.
At $100,000 of cash inflows:
Net Burn = $250,000 − $100,000 = $150,000
If inflows rise to $175,000:
Net Burn = $250,000 − $175,000 = $75,000
The company’s gross spending did not change, yet net burn fell by half.
Revenue growth is not automatically enough, however.
If generating the additional revenue requires large commissions, advertising costs, inventory, fulfillment expenses, or support resources, gross burn can rise at the same time.
That is why profit and contribution economics matter alongside headline revenue growth.
Burn Rate and Contribution Margin
A company can reduce net burn by growing sales, but the impact depends partly on how much each additional sale contributes after variable costs.
Contribution margin measures the amount remaining after relevant variable costs.
Suppose each additional $100 of sales requires $70 of variable costs.
Only $30 remains to contribute toward the company’s fixed spending base.
A business with stronger contribution economics may reduce burn faster as revenue grows than another company generating similar revenue with much thinner margins.
Burn analysis should therefore ask not simply whether revenue is increasing, but whether the revenue is improving the company’s cash economics.
Burn Rate and Break-Even
A cash-burning business often wants to understand what operating change would eliminate its ongoing loss or negative cash pattern.
Break-even analysis can help estimate the sales level required for contribution to cover fixed operating costs under a defined model.
Burn rate and break-even are related, but they are not the same metric.
Break-even analysis usually models the relationship among selling price, variable costs, fixed costs, and profit.
Burn rate focuses on cash depletion.
A business could reach accounting break-even yet still experience cash pressure from working capital, debt repayment, or capital expenditures.
Burn Rate and EBITDA
EBITDA is sometimes discussed alongside startup burn because both can provide views of operating performance, but they measure different things.
EBITDA is an earnings measure before interest, taxes, depreciation, and amortization.
Burn rate is concerned with actual cash consumption under the definition being used.
A company may report negative EBITDA while its monthly cash burn differs substantially because of working-capital movements, capital expenditures, financing costs, taxes, or noncash expenses.
Burn rate should therefore not be estimated mechanically from EBITDA without reconciling the relevant cash movements.
Burn Rate and Working Capital
Growing businesses can consume cash even when customer demand is strong because operating growth may require working capital.
A retailer may need to purchase inventory before selling it. A business selling on credit may record revenue weeks before receiving customer cash. Suppliers may require payment before customers settle invoices.
These timing relationships affect working capital and can materially influence cash burn.
For example, rapid revenue growth can increase accounts receivable faster than collections arrive, temporarily increasing financing needs.
A company that looks only at its income statement may miss that cash pressure.
Burn Rate and the Cash Conversion Cycle
The cash conversion cycle helps explain how long operating cash can remain tied up in inventory and receivables after considering supplier payment timing.
Slow customer collections can increase cash consumption even when reported revenue is healthy.
Days sales outstanding can help identify whether customers are taking longer to pay.
For inventory-heavy businesses, days inventory outstanding can reveal whether more cash is becoming trapped in stock.
Improving these operating cycles can sometimes reduce cash burn without cutting productive investment.
Burn Rate and Accounts Payable
Supplier payment timing can influence short-term cash consumption.
If a company pays vendors immediately but collects from customers 60 days later, the timing gap requires financing.
Extending supplier terms may temporarily preserve cash, but delaying obligations is not equivalent to structurally lowering operating costs.
A business should not interpret a temporary improvement in cash balance caused by unpaid liabilities as a permanent reduction in underlying burn.
Liquidity analysis using the current ratio and quick ratio can provide additional context about short-term obligations and available current assets.
How to Calculate Average Burn Rate
One month’s burn can be distorted by unusual payments or receipts.
An average across several representative months can reduce that noise.
Suppose monthly net burn is:
January: $90,000
February: $110,000
March: $70,000
April: $130,000
Total burn over four months is:
Total Burn = $90,000 + $110,000 + $70,000 + $130,000
Total Burn = $400,000
Average monthly burn is:
Average Monthly Burn = $400,000 ÷ 4
Average Monthly Burn = $100,000
The average gives management a useful baseline, but it should not conceal a meaningful trend.
If burn is rising every month because hiring or marketing is accelerating, the latest operating plan may be more relevant than the historical average.
Burn Rate Trend
A single burn-rate number says less than its direction.
Suppose monthly net burn changes from $80,000 to $100,000, then $125,000, and finally $160,000.
Management should determine why cash consumption is accelerating.
The increase might reflect planned hiring before a product launch, a temporary marketing campaign, investment in growth, weaker collections, higher operating costs, or declining revenue.
Those explanations have very different implications.
Likewise, declining burn is not automatically positive. A company can reduce burn by cutting the product development or sales activity required to reach future milestones.
Financial discipline is about allocating cash effectively, not minimizing every expenditure.
What Is a Good Burn Rate?
There is no universal burn rate that is good for every company.
A $500,000 monthly burn may be unsustainable for a company with $1 million of cash and little revenue. The same burn could be manageable for a company holding $50 million in cash with strong revenue growth and access to capital.
The important relationships include available liquidity, cash runway, revenue growth, contribution margin, financing availability, business milestones, and the expected return from current spending.
Burn rate should therefore be evaluated relative to the company’s resources and plan rather than against an arbitrary dollar benchmark.
When Is Burn Rate Too High?
Burn becomes concerning when the business is consuming cash faster than its strategy, financing capacity, or operating milestones can support.
Suppose a startup has eight months of runway but expects the next major commercial milestone to take twelve months.
Its current burn may be incompatible with the plan.
Management then faces several options: reduce spending, increase revenue or collections, change the operating plan, obtain financing earlier, or alter the milestone schedule.
The conclusion comes from the relationship between burn and available time—not simply from whether the monthly amount looks large.
Burn Rate and Fundraising
Burn rate can affect when a cash-consuming company needs additional financing.
If management waits until cash is almost exhausted before pursuing funding, its negotiating position and operating flexibility can deteriorate.
Suppose a company has $2.4 million in available cash and monthly net burn of $200,000.
Runway = $2,400,000 ÷ $200,000 = 12 months
That does not necessarily mean management can postpone financing decisions for twelve months.
Fundraising may require preparation, due diligence, negotiation, documentation, and time for the transaction to close. The company may also want to maintain a minimum cash reserve rather than operate toward zero.
Burn rate should therefore be incorporated into financing planning well before the theoretical end of runway.
Burn Rate and Startup Valuation
Burn rate does not directly determine what a startup is worth.
However, cash consumption can influence the financing situation surrounding a valuation.
A company with rapid burn and little runway may have less flexibility over when it needs capital. A business with a stronger cash position may be able to continue operating longer before raising another round.
Startup valuation depends on a much broader set of assumptions, including the business model, growth, market opportunity, financial performance, risk, ownership structure, and transaction terms.
Burn is therefore an input into financial context—not a standalone valuation formula.
Burn Rate and Business Valuation
For established companies, business valuation typically considers earnings, cash flows, assets, comparable transactions, market multiples, risk, or combinations of these factors.
Persistent cash burn can matter because a business that continually consumes external capital has different economics from one that consistently generates cash.
However, temporary burn may result from expansion or major investment intended to produce future returns.
A company building a new facility and a company losing customers can both experience negative cash movement for very different reasons.
Understanding the cause of burn matters more than simply labeling all cash consumption as bad.
Burn Rate and Business Loans
A company may use debt to extend its available liquidity, but borrowing does not eliminate the underlying economics causing burn.
A new loan increases cash when funded, which can make the bank balance rise even while operations continue consuming money.
The loan also creates future payment obligations.
A business loan payment analysis should therefore be separated from the underlying operating burn calculation.
Management should ask whether borrowed funds finance a temporary, productive gap or merely postpone an unresolved operating deficit.
Burn Rate and Budgeting
A budget establishes expected spending and revenue, while burn rate shows the resulting cash-consumption pace when outflows exceed inflows.
A useful operating budget can therefore be translated into expected monthly burn.
Suppose a startup forecasts $400,000 of monthly operating cash outflows and $250,000 of collections.
Forecast Net Burn = $400,000 − $250,000 = $150,000
Management can compare that forecast with its cash balance and financing plan.
If actual burn later reaches $210,000, the variance should be investigated.
The change may come from higher expenses, delayed revenue, slower collections, or a combination of factors.
Burn Rate Forecast
Historical burn tells management what happened. Forecast burn estimates what may happen next.
A useful forecast does not assume that every month will equal the current month.
Payroll may increase after planned hiring. Marketing may rise around a launch. Revenue may ramp gradually. Annual expenses may fall in specific months. Customer collections may change with seasonality.
Suppose management expects burn of $150,000 for three months, then $100,000 for three months, followed by $50,000 for another three months.
Using one flat average would hide that planned improvement.
A detailed cash flow forecast provides the better framework when burn is expected to change materially.
How to Reduce Burn Rate
Reducing burn should begin with understanding what is consuming cash.
Broad, indiscriminate cost cutting can damage the activity needed to generate future revenue. Instead, management can separate essential operating costs, growth investments, low-return spending, timing problems, and one-time expenditures.
A business might improve collections, eliminate unused software, renegotiate supplier terms, reduce low-performing acquisition spending, delay nonessential purchases, adjust hiring timing, or improve inventory management.
Revenue improvements can also lower net burn without reducing gross spending.
The objective is not necessarily the lowest possible burn. It is to create enough financial runway while preserving the activities most likely to produce sustainable value.
Cutting Burn vs Growing Revenue
There are two broad routes toward lower net burn: reduce cash outflows or increase cash inflows.
Suppose gross burn is $300,000 and inflows are $100,000.
Net Burn = $200,000
Management could cut spending to $250,000:
New Net Burn = $250,000 − $100,000 = $150,000
Alternatively, if spending remains $300,000 but inflows increase to $150,000:
New Net Burn = $300,000 − $150,000 = $150,000
Both paths produce the same net burn, but their strategic consequences may be very different.
The appropriate choice depends on customer economics, operating capacity, available financing, and the expected return on spending.
Burn Multiple and Burn Rate Are Different
Burn rate measures how much cash a company consumes over time.
A burn multiple, where used in startup analysis, attempts to relate cash consumption to a measure of growth such as incremental recurring revenue.
The metrics answer different questions.
Burn rate asks how quickly cash is disappearing.
A growth-efficiency metric asks what the company is obtaining in exchange for that consumption.
The Logic Library treats these as separate analytical intents so that the basic burn-rate calculation does not become overloaded with specialized SaaS metrics.
Common Burn Rate Mistakes
A major mistake is failing to specify whether a number represents gross burn or net burn.
Another is mixing financing inflows with operating performance. Raising $5 million can increase the cash balance dramatically, but the financing event does not mean the company’s underlying operating burn has improved.
Companies may also calculate burn from one unusual month and assume it represents normal operations.
Ignoring capital expenditures, working-capital timing, or large annual payments can distort runway estimates as well.
Finally, reducing burn at any cost can be a mistake. Eliminating spending that creates strong future returns can improve the short-term cash number while weakening the company.
How Often Should Burn Rate Be Reviewed?
A company with limited runway may need to monitor cash and expected burn frequently.
A stable business with substantial reserves and predictable cash flows may require less intensive monitoring.
Monthly analysis is common because budgets, management accounts, and forecasts are often organized by month, but the right frequency depends on the company’s financial risk and payment cycle.
The most useful process compares actual cash movement with the forecast and then updates future assumptions.
That approach turns burn rate from a historical statistic into an operating decision tool.
Frequently Asked Questions
What is burn rate?
Burn rate measures the pace at which a business consumes cash over a specified period. It is commonly expressed as a monthly amount.
What is the burn rate formula?
A simple cash-balance approach is:
Burn Rate = (Beginning Cash − Ending Cash) ÷ Number of Months
This calculation works when the cash decline represents the consumption being measured and financing or other unusual transactions are handled appropriately.
What is gross burn rate?
Gross burn generally describes the company’s total relevant cash spending during a period before cash inflows are deducted.
What is net burn rate?
Net burn measures cash consumption after relevant cash inflows are considered.
Net Burn = Cash Outflows − Cash Inflows
What is the difference between burn rate and cash runway?
Burn rate measures the pace of cash consumption. Cash runway estimates how long available cash can support that burn.
Cash Runway = Available Cash ÷ Monthly Net Burn
Is burn rate the same as net loss?
No. Net loss is an accounting measure, while burn rate focuses on cash consumption. Noncash expenses and changes in working capital can cause the two figures to differ.
Is burn rate the same as expenses?
No. Accounting expenses and cash payments can occur at different times, and some expenses are noncash.
Is a high burn rate always bad?
No. High burn may reflect deliberate investment in productive growth. It becomes problematic when the resulting cash consumption is not supported by adequate liquidity, financing capacity, expected returns, or progress toward meaningful business milestones.
What is a good monthly burn rate?
There is no universal benchmark. Burn should be evaluated relative to available cash, runway, revenue, margins, financing access, operating milestones, and the purpose of the spending.
Can a profitable business have cash burn?
Yes. Timing differences, inventory investment, receivables, capital expenditure, debt repayments, and other cash movements can cause cash to decline even when accounting profit is positive.
How can a startup reduce burn rate?
A startup can reduce unnecessary spending, improve collections, change hiring timing, improve customer economics, renegotiate costs, manage working capital more efficiently, or grow cash inflows. Cuts should be evaluated for their impact on future growth and operating capability.
Why should burn rate be averaged over several months?
One month may contain unusual receipts or payments. A multi-month average can provide a more representative baseline, although management should still investigate meaningful trends.
Final Perspective
Burn rate answers a practical liquidity question:
How quickly is the business consuming its available cash?
For net burn:
Net Burn Rate = Cash Outflows − Cash Inflows
For a multi-month cash-balance approach:
Average Monthly Burn = (Beginning Cash − Ending Cash) ÷ Number of Months
Burn becomes more informative when connected with runway:
Cash Runway = Available Cash ÷ Monthly Net Burn Rate
None of these formulas should be interpreted mechanically.
A rising burn rate can signal deteriorating economics, but it can also reflect deliberate investment. A falling burn rate can strengthen liquidity, but it may also result from cuts that weaken future growth.
The useful analysis asks what is driving the cash consumption, how long available liquidity can support it, and whether current spending is moving the business toward stronger economics before its financing options narrow.




