


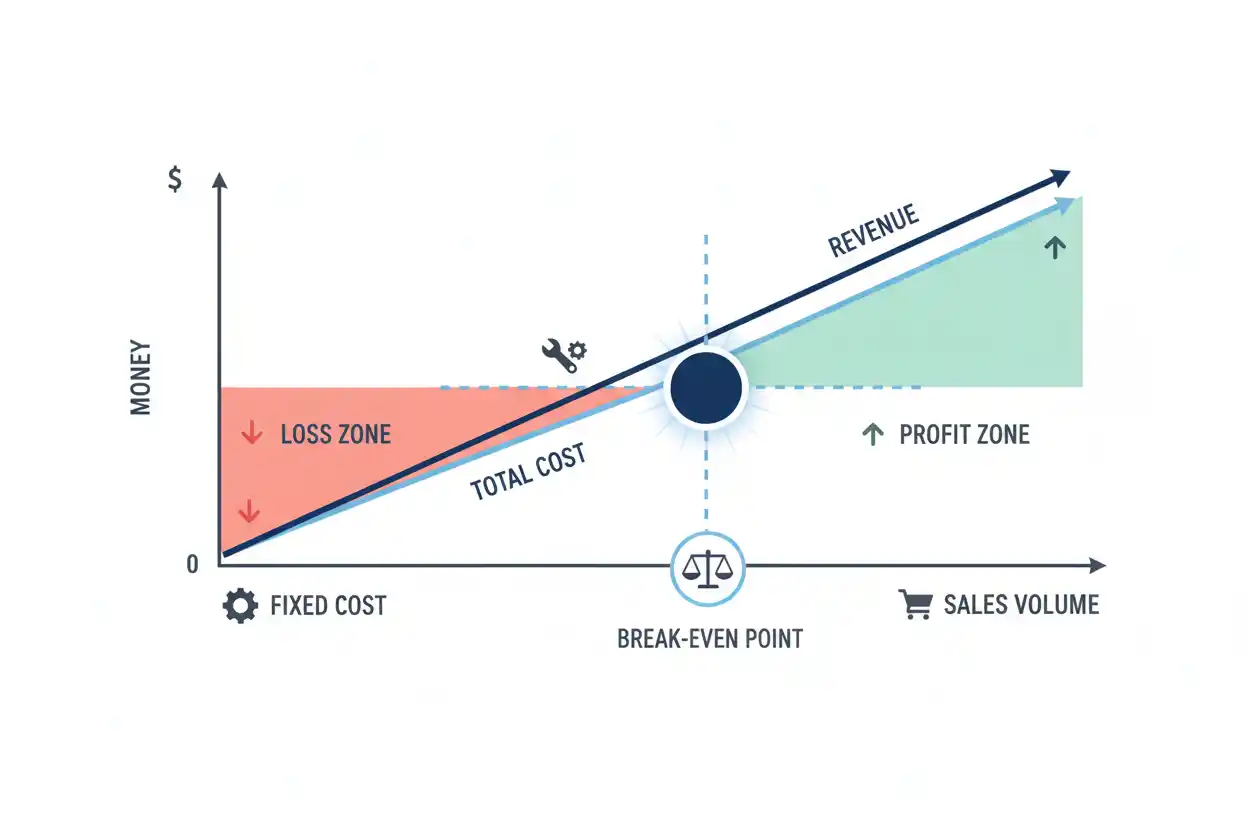
The break-even point is the sales level at which a business covers the costs included in its model without producing a profit or loss.
In unit terms, it tells you how many products, subscriptions, billable hours, appointments, or other units must be sold before contribution covers fixed costs.
The basic calculation is:
Break-Even Point in Units = Fixed Costs ÷ (Selling Price per Unit − Variable Cost per Unit)
The amount in parentheses is the contribution margin per unit.
If a product sells for $75, costs $45 per unit to supply, and the business has $60,000 of fixed costs:
Contribution Margin per Unit = $75 − $45 = $30
Break-Even Point = $60,000 ÷ $30 = 2,000 units
The company therefore needs to sell 2,000 units during the modeled period to cover those costs.
This page focuses specifically on finding and interpreting the break-even point. For broader scenario modeling involving price changes, cost changes, sales mix, target profit, and sensitivity testing, see break-even analysis.
What Is the Break-Even Point?
The break-even point is where total contribution generated by sales equals the fixed costs included in the calculation.
Below break-even, the model produces an operating loss. At break-even, modeled profit is zero. Above break-even, additional contribution can generate profit.
The concept is easier to understand when revenue is separated into two parts.
One part pays variable costs associated with making or delivering each sale. Whatever remains is contribution margin.
That contribution first covers fixed costs. Once fixed costs have been covered, additional contribution can increase operating profit.
This makes the break-even point an important connection between business finance, pricing, costs, sales volume, and profitability.
Break-Even Point Formula
For a single product or service, use:
Break-Even Point in Units = Fixed Costs ÷ Contribution Margin per Unit
Contribution margin per unit is:
Contribution Margin per Unit = Selling Price per Unit − Variable Cost per Unit
The formulas can therefore be combined:
Break-Even Point in Units = Fixed Costs ÷ (Selling Price per Unit − Variable Cost per Unit)
The formula requires three inputs: fixed costs for the period, selling price per unit, and variable cost per unit.
If those inputs describe different periods or use inconsistent definitions, the result will not be meaningful.
Break-Even Point Example
Suppose a business sells a product for $120.
Variable cost is $70 per unit, while monthly fixed costs total $85,000.
First calculate contribution margin.
Contribution Margin per Unit = $120 − $70
Contribution Margin per Unit = $50
Now calculate the break-even point.
Break-Even Point = $85,000 ÷ $50
Break-Even Point = 1,700 units
The business must sell 1,700 units per month under these assumptions to cover the modeled fixed costs.
At 1,700 units, revenue would be:
Break-Even Revenue = 1,700 × $120 = $204,000
The $204,000 is not profit. It is the amount of revenue associated with the 1,700-unit break-even level.
How to Calculate Break-Even Point Step by Step
Start by choosing the period you want to analyze. Monthly costs require a monthly break-even calculation; annual fixed costs require an annual model.
Next, identify fixed costs. Then determine variable cost per unit and selling price per unit.
Calculate contribution margin:
Contribution Margin = Selling Price − Variable Cost
Finally:
Break-Even Point = Fixed Costs ÷ Contribution Margin per Unit
Suppose fixed costs are $30,000, the product sells for $50, and variable cost is $35.
Contribution Margin = $50 − $35 = $15
Break-Even Point = $30,000 ÷ $15 = 2,000 units
A business selling fewer than 2,000 units would remain below the modeled break-even point. Selling more than 2,000 would place it above break-even, assuming the inputs remain valid.
What Are Fixed Costs?
Fixed costs remain relatively unchanged as sales volume changes within the period and operating range being modeled.
They may include rent, certain salaries, insurance, software subscriptions, administrative expenses, equipment leases, or other costs that are not directly incurred with each additional sale.
Suppose monthly fixed costs include $12,000 of rent, $24,000 of qualifying salaries, $3,000 of insurance, and $6,000 of other fixed overhead.
Total Fixed Costs = $12,000 + $24,000 + $3,000 + $6,000
Total Fixed Costs = $45,000
The contribution generated from sales must first cover that $45,000 before the modeled operation moves above break-even.
Fixed does not mean permanent. Rent can rise, another employee may be required, or a second facility may become necessary when volume exceeds existing capacity.
The break-even point should therefore be recalculated when the cost structure changes.
What Are Variable Costs?
Variable costs change as units are produced, sold, or delivered.
Examples can include materials, product packaging, sales commissions, per-order fulfillment charges, transaction fees, and other expenses directly associated with additional sales.
Suppose a product requires $18 of materials, $4 of packaging, $3 of transaction charges, and $5 of fulfillment cost.
Variable Cost per Unit = $18 + $4 + $3 + $5
Variable Cost per Unit = $30
If the selling price is $70:
Contribution Margin per Unit = $70 − $30 = $40
That $40 contribution is the amount available from each sale to cover fixed costs and, after break-even, contribute toward profit.
What Is Contribution Margin?
Contribution margin is the amount of sales revenue remaining after variable costs.
For an individual unit:
Contribution Margin per Unit = Selling Price − Variable Cost per Unit
If something sells for $100 and carries $65 of variable costs:
Contribution Margin = $100 − $65 = $35
Each unit therefore contributes $35 toward fixed costs.
If fixed costs equal $70,000:
Break-Even Point = $70,000 ÷ $35 = 2,000 units
Contribution margin matters more to the unit break-even calculation than the selling price alone.
A product with a high selling price can still have a high break-even point if its variable costs consume most of that price.
Break-Even Point in Sales Dollars
Not every business wants to plan around units.
A company offering several products or services may find a sales-revenue break-even point more useful.
First calculate the contribution margin ratio:
Contribution Margin Ratio = Contribution Margin ÷ Sales Revenue
Then:
Break-Even Sales Revenue = Fixed Costs ÷ Contribution Margin Ratio
Suppose a company generates $400,000 of revenue and $160,000 of contribution margin.
Contribution Margin Ratio = $160,000 ÷ $400,000 = 0.40
The contribution margin ratio is 40%.
If fixed costs equal $100,000:
Break-Even Sales Revenue = $100,000 ÷ 0.40
Break-Even Sales Revenue = $250,000
The company therefore needs approximately $250,000 of sales revenue to cover the costs represented in this model.
Break-Even Point vs Break-Even Analysis
The terms are closely related but have different scopes.
The break-even point is the threshold itself: a quantity of units or amount of revenue at which modeled profit equals zero.
Break-even analysis is the broader process of studying that threshold and how it changes.
For example, calculating that a company breaks even at 4,000 units is a break-even point calculation.
Testing what happens at different prices, supplier costs, fixed expenses, sales mixes, or capacity levels is break-even analysis.
Keeping these intents separate allows the break-even point page to answer a direct calculation query without duplicating the broader analytical guide.
How Selling Price Changes the Break-Even Point
When variable cost and fixed cost remain constant, a higher selling price increases contribution per unit and reduces the number of units required to break even.
Suppose:
Selling price = $80
Variable cost = $50
Fixed costs = $90,000
Contribution Margin = $80 − $50 = $30
Break-Even Point = $90,000 ÷ $30 = 3,000 units
Now increase the price to $95.
New Contribution Margin = $95 − $50 = $45
New Break-Even Point = $90,000 ÷ $45 = 2,000 units
The break-even point falls from 3,000 to 2,000 units.
That calculation does not predict whether customers will continue buying at $95. Price changes can affect demand, competitive positioning, and conversion rates.
The formula measures the financial effect if the stated assumptions hold.
For broader pricing decisions, cost-plus pricing and target pricing address related but different questions.
How Discounts Change the Break-Even Point
Discounting reduces contribution margin unless the discount is accompanied by an offsetting reduction in variable cost.
Consider a $100 product with $60 of variable cost.
Original Contribution Margin = $100 − $60 = $40
With $80,000 of fixed costs:
Original Break-Even Point = $80,000 ÷ $40 = 2,000 units
Now apply a 10% discount, reducing the price to $90.
Discounted Contribution Margin = $90 − $60 = $30
New Break-Even Point = $80,000 ÷ $30 ≈ 2,667 units
The company now needs approximately 667 additional sales to reach break-even.
A 10% reduction in selling price caused the required unit volume to rise by roughly one-third in this example because the discount reduced contribution from $40 to $30.
This is why discounts should be evaluated in terms of contribution rather than price reduction alone.
How Variable Costs Change the Break-Even Point
Higher variable cost reduces contribution margin when selling price remains constant.
Suppose the selling price is $75 and variable cost is initially $45.
Contribution Margin = $75 − $45 = $30
With $60,000 of fixed costs:
Break-Even Point = $60,000 ÷ $30 = 2,000 units
Now suppose variable cost rises to $55.
New Contribution Margin = $75 − $55 = $20
New Break-Even Point = $60,000 ÷ $20 = 3,000 units
A $10 increase in variable cost raises break-even volume by 1,000 units.
This illustrates why supplier prices, fulfillment charges, commissions, and other unit-level expenses can materially affect business profitability.
How Fixed Costs Change the Break-Even Point
Higher fixed costs increase the break-even point when contribution margin remains unchanged.
Suppose contribution is $25 per unit and fixed costs are $50,000.
Break-Even Point = $50,000 ÷ $25 = 2,000 units
If fixed costs rise to $75,000:
New Break-Even Point = $75,000 ÷ $25 = 3,000 units
This can occur when a business moves to larger premises, adds salaried staff, acquires additional systems, or expands capacity.
The additional fixed cost may support greater future sales, but it increases the amount of contribution required before the business reaches break-even.
Break-Even Point and Profit
At break-even, modeled operating profit is zero.
Above break-even, profit can be estimated from contribution remaining after fixed costs.
Operating Profit = Total Contribution Margin − Fixed Costs
Suppose a business sells 3,500 units with a $30 contribution margin per unit.
Total Contribution = 3,500 × $30 = $105,000
If fixed costs equal $75,000:
Operating Profit = $105,000 − $75,000 = $30,000
The company’s break-even point would have been:
Break-Even Point = $75,000 ÷ $30 = 2,500 units
The additional 1,000 units generated $30,000 of contribution above fixed costs under the model.
For broader distinctions among revenue, costs, and earnings, see profit explained and net profit.
Break-Even Point and Margin of Safety
Once break-even is known, margin of safety shows how far actual or forecast sales are above that threshold.
Suppose break-even sales are $300,000 while actual sales are $400,000.
Margin of Safety = Actual Sales − Break-Even Sales
Margin of Safety = $400,000 − $300,000 = $100,000
As a percentage:
Margin of Safety % = ($100,000 ÷ $400,000) × 100 = 25%
Sales could therefore decline by $100,000, or 25% of the current $400,000 level, before reaching the modeled break-even threshold.
Margin of safety adds context that the break-even number alone cannot provide.
Break-Even Point and Gross Margin
Gross margin and contribution margin should not automatically be treated as the same figure.
Gross margin generally relates revenue to cost of goods sold.
Break-even calculations are based on the behavior of fixed and variable costs.
Some expenses classified in cost of goods sold may not change proportionally with each sale, while some variable selling expenses may sit outside cost of goods sold.
The correct break-even model therefore depends on understanding cost behavior rather than simply copying the reported gross margin percentage.
Break-Even Point for a Service Business
A service does not need to be a physical product to have a break-even unit.
The unit can be an appointment, consultation, billable hour, subscription, customer, project, room night, seat, or another measurable unit.
Suppose a consultant charges $200 per billable hour and incurs $40 of variable delivery cost per hour.
Contribution Margin per Hour = $200 − $40 = $160
If fixed monthly costs are $32,000:
Break-Even Point = $32,000 ÷ $160
Break-Even Point = 200 billable hours
The service business must generate 200 billable hours during the modeled month to cover its fixed costs.
Management should then check whether 200 hours are realistically available given staffing and capacity.
Break-Even Point for a Subscription Business
A subscription company can treat one active paying subscription as a unit if its economics support that approach.
Suppose the subscription price is $50 per month and variable servicing cost is $10.
Contribution Margin per Subscription = $50 − $10 = $40
With $120,000 of monthly fixed costs:
Break-Even Subscriptions = $120,000 ÷ $40
Break-Even Subscriptions = 3,000
Under this simplified model, 3,000 active subscriptions are required to cover fixed monthly costs.
Actual subscription economics may also depend on customer acquisition costs, churn, payment failures, plan differences, support usage, and annual versus monthly billing.
The basic break-even point remains useful, but the model should reflect the way the business actually earns and spends money.
Break-Even Point for Multiple Products
A simple unit break-even formula assumes one contribution margin.
Companies selling multiple products may have different contribution margins for each product.
If the sales mix is stable, a weighted-average contribution margin can be used.
Suppose Product A contributes $20 and represents 70% of sales volume, while Product B contributes $50 and represents 30%.
Weighted Contribution Margin = ($20 × 70%) + ($50 × 30%)
Weighted Contribution Margin = $14 + $15 = $29
If fixed costs equal $116,000:
Composite Break-Even Units = $116,000 ÷ $29 = 4,000
The result depends on the assumed sales mix. If buyers shift toward the lower-contribution product, the actual break-even requirement increases.
This complexity belongs to broader break-even analysis rather than a simple single-product calculation.
Break-Even Point and Operating Leverage
A company’s fixed-versus-variable cost structure affects how its profits respond to changing sales.
Businesses with substantial fixed costs may have relatively high break-even requirements, particularly before they reach efficient utilization.
Once break-even has been crossed, however, a large portion of additional contribution may translate into operating profit while fixed costs remain stable.
This relationship is explored more fully in operating leverage.
The break-even point identifies the threshold. Operating leverage helps explain what can happen to profit as revenue moves above or below that threshold.
Break-Even Point and Budgeting
A budget establishes expected revenue and expenses.
The break-even point gives the budget an important reference level.
Suppose a company’s annual budget assumes sales of 50,000 units while its break-even point is 47,000.
The business has only a 3,000-unit cushion before modeled profit falls to zero.
Another company may budget 50,000 units against a 30,000-unit break-even point, giving it substantially more operating room under those assumptions.
The break-even point therefore helps management evaluate how much downside a budget can tolerate.
Break-Even Point Is Not the Same as Cash Flow
A business can reach its accounting or operating break-even point and still face cash pressure.
Customers may pay after the sale occurs. Inventory may need to be purchased first. Loan principal payments may consume cash. Equipment investments may create large outflows.
That is why break-even calculations should not replace cash flow forecasting.
Similarly, working capital and the cash conversion cycle help explain how quickly operating activity becomes available cash.
Break-even answers a profitability-threshold question. Cash-flow analysis answers a liquidity question.
Break-Even Point vs Payback Period
The break-even point and payback period measure different things.
Break-even determines the sales activity required to cover the modeled operating cost structure.
Payback period estimates how long it takes to recover an initial investment from specified cash inflows or savings.
A new machine may lower variable cost and therefore reduce the operating break-even point. However, the business may still want to know how many years of savings are needed to recover the purchase price.
Both calculations may be useful, but they should not be substituted for one another.
Break-Even Point vs ROI
ROI evaluates return relative to an investment under the selected ROI calculation.
The break-even point identifies where modeled profit reaches zero.
Crossing break-even does not automatically mean an investment is attractive.
A project could produce a small profit while tying up substantial capital. Another may have a relatively high break-even point but generate an attractive return once it reaches normal operating volume.
Investment decisions therefore need more than the break-even threshold alone.
When Is a Break-Even Point Too High?
A high break-even point becomes problematic when realistic demand or operating capacity cannot reach it.
Suppose a workshop can produce at most 4,000 units per month but requires 4,500 sales to break even.
The economics do not work under the current assumptions because required volume exceeds available capacity.
Management would need to change one or more inputs: selling price, variable cost, fixed cost, contribution margin, production capacity, or business model.
The break-even point is particularly valuable in situations like this because it exposes an incompatibility between financial requirements and operational reality.
What Is a Good Break-Even Point?
There is no universal number that defines a good break-even point.
A business selling millions of low-margin units operates differently from a specialist company selling a small number of high-margin products.
Instead of asking whether the raw break-even figure is good, compare it with expected sales and capacity.
If break-even is 20,000 units and realistic demand is 60,000 units, the business has considerable room above the threshold under the stated assumptions.
If break-even is 20,000 units and credible demand is only 21,000, the operation has far less tolerance for a sales decline or cost increase.
The relationship between break-even and realistic sales matters more than the number by itself.
Common Break-Even Point Mistakes
A frequent mistake is dividing fixed costs by selling price instead of contribution margin.
The full selling price cannot cover fixed costs because variable costs must also be paid.
Another error is mixing time periods—for example, dividing annual fixed costs by monthly contribution without converting the figures to the same basis.
Businesses can also underestimate variable costs by leaving out transaction fees, commissions, fulfillment, packaging, or other unit-dependent expenses.
Using an average selling price that does not reflect discounts can create another distortion.
Finally, the formula should not be treated as a demand forecast. It identifies required volume; it does not guarantee that customers will buy that amount.
When Should the Break-Even Point Be Recalculated?
Recalculate the break-even point when a material input changes.
A price increase changes contribution margin. A supplier increase changes variable cost. A new lease changes fixed cost. Hiring salaried employees can change fixed expenses. New commissions can alter unit economics.
Discount programs, new products, changes in product mix, automation, outsourcing, and expansion can also justify a new calculation.
A break-even point based on outdated costs can give management a false picture of current profitability.
Frequently Asked Questions
What is the break-even point?
The break-even point is the sales volume or revenue level at which the contribution generated by sales covers the fixed costs included in the model, resulting in zero modeled profit or loss.
What is the break-even point formula?
Break-Even Point in Units = Fixed Costs ÷ (Selling Price per Unit − Variable Cost per Unit)
The denominator is contribution margin per unit.
How do you calculate break-even sales?
For sales dollars:
Break-Even Sales = Fixed Costs ÷ Contribution Margin Ratio
What does a break-even point of 1,000 units mean?
It means the business needs to sell 1,000 units during the modeled period for contribution to cover the fixed costs represented in the calculation.
Is break-even the same as profit?
No. At break-even, modeled profit is zero. Profit begins when contribution exceeds the fixed costs included in the model.
Does a lower break-even point mean a better business?
Not automatically. A lower threshold can provide more flexibility, but profitability, demand, capacity, growth, cash flow, investment requirements, and long-term economics also matter.
What causes the break-even point to increase?
Higher fixed costs, higher variable costs, or a lower selling price can increase break-even volume if other inputs remain unchanged.
What causes the break-even point to decrease?
Lower fixed costs, lower variable costs, or a higher selling price can decrease required break-even volume when other assumptions remain constant.
Can a service business calculate a break-even point?
Yes. The unit can be a billable hour, appointment, project, customer, subscription, consultation, or another measurable service unit.
Can a business be above break-even but short of cash?
Yes. Break-even concerns the relationship between modeled revenue and costs, while cash depends on the timing of collections, payments, financing, inventory, capital expenditure, and other cash movements.
Is gross margin used to calculate break-even?
Contribution margin is the appropriate concept for the standard break-even calculation. Gross margin and contribution margin may differ because they classify costs differently.
How often should a business calculate its break-even point?
The calculation should be revisited whenever selling price, variable cost, fixed costs, product mix, capacity, or another material assumption changes.
Final Perspective
The break-even point gives a business a specific threshold to compare with its expected sales.
For units:
Break-Even Point = Fixed Costs ÷ Contribution Margin per Unit
For revenue:
Break-Even Sales = Fixed Costs ÷ Contribution Margin Ratio
The calculation becomes useful when its assumptions are realistic.
Selling price must reflect what customers actually pay. Variable cost must include the expenses that truly change with sales. Fixed costs must match the period being analyzed.
Once those inputs are sound, the break-even point answers one of the most practical questions in business finance:
How much must we sell before the modeled operation stops losing money?




