


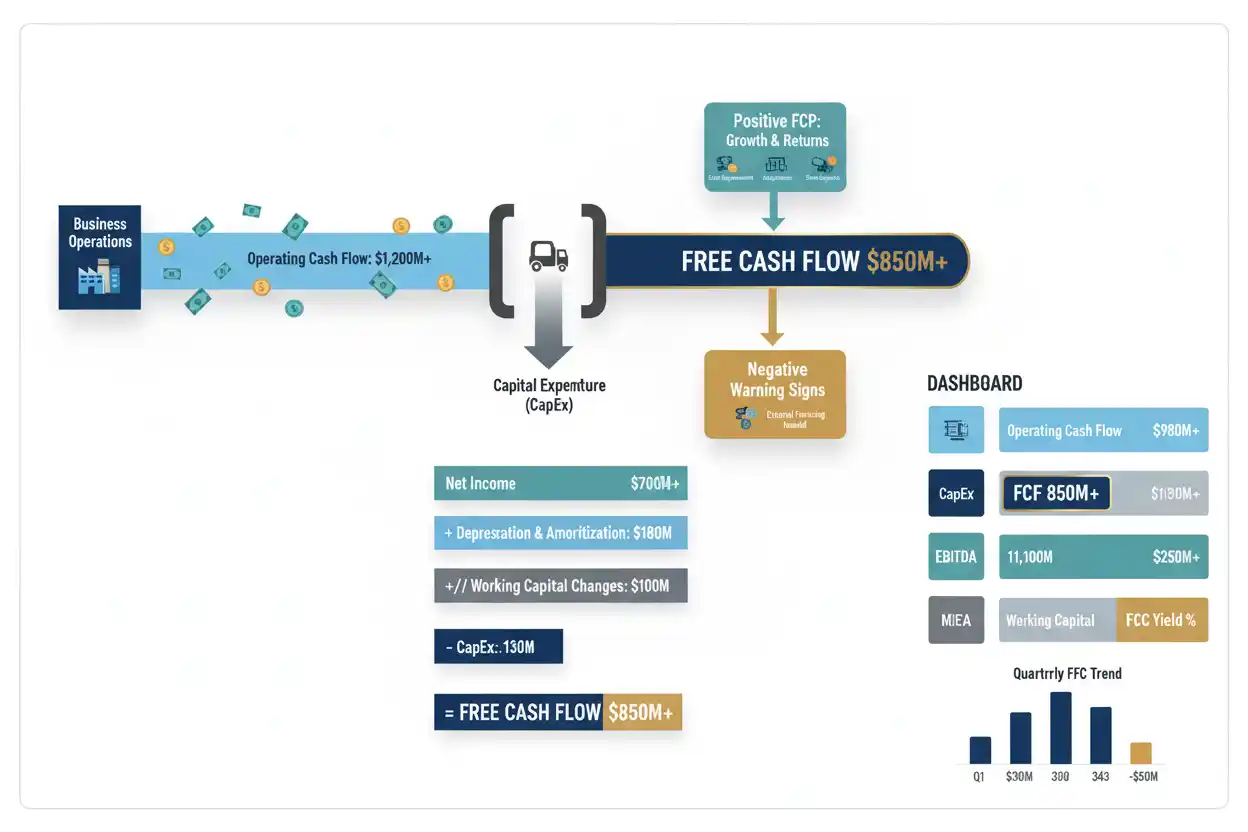
Free cash flow, usually abbreviated FCF, measures cash generated by a business after accounting for the capital expenditures required under the chosen calculation.
A widely used formula is:
Free Cash Flow = Operating Cash Flow − Capital Expenditures
Suppose a company generates $3 million of cash from operating activities and spends $1.2 million on property, equipment, and other capital expenditures included in its FCF definition.
Free Cash Flow = $3,000,000 − $1,200,000
Free Cash Flow = $1,800,000
The business generated $1.8 million of free cash flow under that calculation.
FCF is useful because accounting profit alone does not show how much cash remains after a company funds the investments necessary to operate or expand its asset base.
A business can report strong net income or EBITDA while producing weak free cash flow because customers have not paid, inventory is growing, or capital expenditure is substantial.
Conversely, free cash flow can sometimes exceed accounting profit because noncash expenses reduce reported earnings without creating an equivalent current-period cash outflow.
Within business finance, free cash flow connects profitability with liquidity, investment requirements, debt capacity, capital allocation, and business value.
What Is Free Cash Flow?
Free cash flow represents cash generated after the company funds specified capital expenditures.
The simplest interpretation is:
How much cash did operations produce after the business spent money on long-lived operating assets included in the calculation?
That remaining cash can potentially support debt repayment, acquisitions, dividends, share repurchases, additional investment, or an increase in cash reserves.
However, the word free should not be interpreted as “cash with no obligations attached.”
A company may still face debt maturities, taxes, acquisition commitments, lease payments, legal obligations, pension requirements, or other demands not captured by a particular FCF definition.
Free cash flow is therefore a financial measure, not a literal statement that every remaining dollar is discretionary.
Free Cash Flow Formula
A common formula is:
FCF = Operating Cash Flow − Capital Expenditures
Suppose:
Operating cash flow = $5,000,000
Capital expenditures = $1,750,000
Then:
FCF = $5,000,000 − $1,750,000
FCF = $3,250,000
The company generated $3.25 million of free cash flow.
This formula is widely used because it begins with actual cash generated by operating activities rather than an accounting earnings subtotal.
The exact definition of capital expenditure should still be checked before comparing companies.
Free Cash Flow Example
Consider a company that reports:
Net income = $2,000,000
Depreciation and amortization = $600,000
Increase in working capital = $300,000
Other operating cash adjustments = $100,000
Capital expenditures = $900,000
A simplified operating cash flow bridge is:
Operating Cash Flow = $2,000,000 + $600,000 − $300,000 + $100,000
Operating Cash Flow = $2,400,000
Now deduct capital expenditure:
Free Cash Flow = $2,400,000 − $900,000
Free Cash Flow = $1,500,000
Although the company earned $2 million of net income, it generated only $1.5 million of free cash flow under this example.
The difference comes from working-capital investment, noncash expenses, other cash-flow adjustments, and capital spending.
Free Cash Flow From the Cash Flow Statement
The most direct route usually begins with operating cash flow.
Locate cash generated by operating activities on the statement of cash flows.
Then identify capital expenditures within investing activities.
A simplified calculation is:
Free Cash Flow = Net Cash Provided by Operating Activities − Capital Expenditures
Suppose the statement of cash flows reports:
Net cash provided by operating activities = $8.4 million
Purchases of property and equipment = $2.6 million
FCF = $8.4 million − $2.6 million
FCF = $5.8 million
This approach makes the cash-flow statement the starting point rather than trying to estimate FCF solely from the income statement.
What Counts as Capital Expenditure?
Capital expenditure, or CapEx, generally refers to cash invested in qualifying long-lived assets rather than expenses consumed immediately.
Examples can include purchases of machinery, equipment, buildings, infrastructure, technology hardware, and certain capitalized software or intangible investments depending on the company’s accounting and FCF definition.
The treatment matters because different companies can define free cash flow differently.
One company may subtract only purchases of property and equipment.
Another may also subtract capitalized software or other long-term investments.
Before comparing two FCF figures, check exactly what each calculation deducts.
Free Cash Flow vs Operating Cash Flow
Operating cash flow measures cash generated or consumed by operating activities.
Free cash flow goes one step further by deducting capital expenditure.
Suppose:
Operating cash flow = $6 million
Capital expenditure = $2 million
Free Cash Flow = $4 million
Operating cash flow answers:
How much cash did operations generate?
Free cash flow asks:
How much remains after the capital spending included in the FCF definition?
That distinction is especially important for businesses requiring substantial recurring investment.
Free Cash Flow vs Net Income
Net profit is an accounting earnings measure.
Free cash flow is cash-based.
The two can differ because net income includes noncash expenses and accounting accruals, while FCF reflects working-capital movements and capital expenditures.
Suppose:
Net income = $4 million
Operating cash flow = $5 million
Capital expenditure = $3 million
FCF = $2 million
The company reports $4 million of profit but only $2 million of free cash flow.
Another company can show the opposite pattern.
Net income might be $2 million while FCF is $3 million because depreciation or other noncash expenses reduce accounting profit more than the associated current cash requirements.
Neither measure replaces the other.
Free Cash Flow vs EBITDA
EBITDA measures earnings before interest, taxes, depreciation, and amortization.
FCF measures cash after specified capital expenditure.
Suppose:
EBITDA = $10 million
Operating cash flow = $7 million
Capital expenditure = $4 million
FCF = $3 million
The company produces $10 million of EBITDA but only $3 million of free cash flow.
The difference can reflect taxes, interest treatment within cash flow, working-capital movements, capital spending, and other items.
This is why EBITDA should not be treated automatically as cash available to investors.
Free Cash Flow vs EBIT
EBIT measures earnings before interest and taxes while retaining depreciation and amortization under the conventional relationship.
Free cash flow instead tracks cash.
A company can generate healthy EBIT yet consume cash because receivables and inventory increase or major capital investments occur.
Alternatively, strong cash collection and modest capital expenditure can produce substantial FCF even when EBIT growth is limited.
EBIT measures operating accounting profitability.
FCF measures cash economics after specified investment.
Why Depreciation Does Not Equal Capital Expenditure
Depreciation is an accounting allocation of historical asset cost.
Capital expenditure is an actual cash investment in assets.
The two amounts can be very different.
Suppose annual depreciation is $1 million.
The company spends $3 million replacing equipment and expanding capacity.
FCF uses the actual capital expenditure:
FCF = Operating Cash Flow − $3 million CapEx
It does not simply subtract $1 million of depreciation again.
This distinction is especially important for businesses with expanding or aging asset bases.
Free Cash Flow and Fixed Costs
The preceding fixed costs article explains expenses that remain stable within a relevant operating range.
Fixed costs can affect FCF when they require recurring cash payments.
Rent, salaried payroll, insurance, and software commitments can reduce operating cash generation.
Depreciation can behave as a fixed accounting cost without representing a current-period cash payment.
Therefore, fixed cost and cash cost should not be treated as identical concepts.
Free Cash Flow and Gross Margin
Gross margin influences the amount of gross profit available to support operating expenses and eventually cash generation.
Suppose a company improves gross margin from 30% to 40% without increasing working-capital requirements or capital expenditure.
More operating profit can potentially convert into higher FCF.
However, the conversion is not automatic.
If customers pay much later or inventory expands aggressively, additional gross profit can remain tied up in working capital rather than reaching cash.
Free Cash Flow and Gross Profit
Gross profit sits much earlier in the financial chain.
A company can generate substantial gross profit while producing negative FCF because fixed overhead, taxes, working-capital investment, and capital expenditure consume the resulting cash.
This is why gross-profit growth should not be treated as proof of stronger liquidity.
The path from gross profit to free cash flow contains several additional economic steps.
Free Cash Flow and Net Profit Margin
Net profit margin shows how much net accounting income remains from each dollar of revenue.
FCF margin instead measures free cash flow relative to revenue.
A useful management calculation is:
Free Cash Flow Margin = Free Cash Flow ÷ Revenue × 100
Suppose:
Revenue = $20 million
FCF = $3 million
FCF Margin = $3 million ÷ $20 million × 100
FCF Margin = 15%
This means the company generated approximately 15 cents of FCF for every dollar of revenue under its chosen FCF definition.
Free Cash Flow Margin
Free cash flow margin can make businesses of different sizes easier to compare.
Suppose Company A generates $2 million of FCF on $10 million of revenue.
FCF Margin = 20%
Company B generates $5 million on $50 million of revenue.
FCF Margin = 10%
Company B produces more absolute cash.
Company A converts a larger percentage of revenue into FCF.
Both perspectives can matter.
What Is a Good Free Cash Flow Margin?
There is no universal good FCF margin.
Capital intensity, business model, growth stage, margins, working-capital requirements, and investment cycles differ substantially.
A mature software business and a growing industrial manufacturer can have dramatically different FCF conversion.
The useful comparison is with the company’s historical performance and genuinely comparable businesses using consistent definitions.
Free Cash Flow and Working Capital
Working capital is one of the major reasons cash flow diverges from accounting profit.
Suppose a company records a $1 million credit sale.
Revenue and profit can increase immediately under the applicable accounting treatment.
If the customer has not paid, accounts receivable increases.
Cash has not yet arrived.
Similarly, purchasing inventory can consume cash before the inventory is sold.
Accounts payable can temporarily preserve cash by delaying supplier payments according to agreed terms.
These movements are reflected in operating cash flow and therefore affect FCF.
Accounts Receivable and FCF
If days sales outstanding rises, customers are taking longer to pay relative to sales.
Accounts receivable can consume more working capital.
Suppose revenue and profit remain unchanged, but receivables increase by an additional $500,000.
All else equal, operating cash flow can be $500,000 lower than it otherwise would have been.
That reduction then flows through to free cash flow.
Faster collection can reverse part of the effect.
Inventory and FCF
A rising days inventory outstanding can indicate more capital tied up in inventory relative to cost flow.
Suppose the company builds an additional $1 million of inventory ahead of expected sales.
Cash may leave suppliers before the inventory generates revenue.
Operating cash flow can decline even though the inventory remains an asset on the balance sheet.
If that inventory later sells without needing to be replaced at the same level, cash can be released.
Accounts Payable and FCF
Days payable outstanding influences supplier-payment timing.
Suppose the company negotiates longer legitimate supplier terms.
Cash remains with the business for more days before payment.
That can improve near-term operating cash flow and FCF.
However, the benefit is primarily a timing effect.
The supplier obligation still needs to be settled according to the contract.
Continuously stretching payments cannot create sustainable free cash flow indefinitely.
Free Cash Flow and the Cash Conversion Cycle
The cash conversion cycle connects inventory, receivables, and payables.
CCC = DIO + DSO − DPO
Shortening the cash conversion cycle can improve the speed with which operating investment returns to cash.
If the company lowers inventory days and collection days without harming operations, less capital can remain tied up in working capital.
That can strengthen FCF.
However, pushing inventories too low or supplier payments too far can damage operations.
Cash optimization should preserve the economics that create the cash in the first place.
FCF Conversion
A company can compare free cash flow with an earnings measure to assess conversion.
One possible calculation is:
FCF Conversion = Free Cash Flow ÷ EBITDA × 100
Suppose:
FCF = $4 million
EBITDA = $5 million
FCF Conversion = $4 million ÷ $5 million × 100
= 80%
The company converted approximately 80% of EBITDA into FCF under the definitions used.
This ratio can vary dramatically because of working capital, taxes, capital spending, and company-specific FCF definitions.
It is therefore more useful as a trend or peer-comparison measure than as an absolute grading rule.
Why FCF Conversion Can Exceed 100%
Free cash flow can exceed EBITDA in a period.
Suppose a company collects substantial old receivables and reduces inventory.
Working capital releases cash.
At the same time, current capital expenditure is low.
Those factors can make operating cash flow unusually strong relative to current EBITDA.
A conversion rate above 100% is therefore mathematically possible.
It does not mean the business permanently converts more than all of its earnings into cash.
The working-capital release may not repeat.
Why FCF Conversion Can Be Low
Low conversion can result from increasing receivables, expanding inventory, reducing accounts payable, paying taxes, making heavy capital investments, or other cash requirements.
Some causes are negative.
Others represent productive investment.
Suppose a growing company builds a second factory.
FCF falls because capital expenditure rises.
If the new facility later produces attractive returns, the temporary FCF reduction can create long-term value.
Low current FCF should therefore be diagnosed rather than automatically condemned.
Positive Free Cash Flow
Positive FCF means operating cash flow exceeded the capital expenditure deducted by the chosen definition.
Suppose:
Operating cash flow = $7 million
CapEx = $5 million
FCF = $2 million
The business generated $2 million after the specified capital investment.
That generally provides more financial flexibility.
However, positive FCF does not automatically mean the company is financially healthy.
Large debt maturities or declining operations can still create serious risks.
Negative Free Cash Flow
Negative FCF means the deducted capital expenditure exceeds operating cash flow.
Suppose:
Operating cash flow = $4 million
CapEx = $6 million
FCF = −$2 million
The company consumed $2 million beyond internally generated operating cash under the calculation.
This can signal weak economics.
It can also reflect heavy investment.
A growing company constructing a highly productive facility can generate negative FCF temporarily while creating future capacity.
The reason matters.
Can a Profitable Company Have Negative Free Cash Flow?
Yes.
Suppose:
Net income = $3 million
Operating cash flow = $2 million
Capital expenditure = $5 million
FCF = −$3 million
The company reports positive accounting profit but negative FCF.
Perhaps it is investing heavily.
Perhaps receivables or inventory are absorbing cash.
Accounting profitability and free cash flow answer different questions.
Can a Company Have Positive FCF and a Net Loss?
Yes.
Suppose the company records significant depreciation, amortization, or another noncash accounting expense.
Net income can be negative while operating cash flow remains positive.
If capital expenditure is modest, FCF can also remain positive.
For example:
Net loss = $500,000
Depreciation and other noncash adjustments = $2 million
Operating cash flow = $1.2 million
Capital expenditure = $400,000
FCF = $800,000
The company lost money on an accounting basis while generating positive free cash flow.
The underlying reason still needs analysis.
Free Cash Flow and Growth
Growth can either strengthen or weaken FCF.
A business with a scalable model may increase revenue without proportionately increasing working capital or capital expenditure.
FCF can expand rapidly.
Another company may need substantial inventory, receivables, factories, equipment, or technology investment for every additional dollar of revenue.
Growth then consumes cash before it produces returns.
Therefore, revenue growth should always be considered alongside incremental cash requirements.
Growth Can Consume Free Cash Flow
Suppose annual revenue increases from $20 million to $30 million.
To support growth, the company requires:
Additional receivables = $1.5 million
Additional inventory = $2 million
New equipment = $3 million
The business may report stronger sales and earnings while absorbing $6.5 million in additional operating and investment cash requirements.
Fast growth is not automatically self-financing.
Growth Can Improve Free Cash Flow
Now consider a software business whose platform can serve substantially more customers without major capital investment.
Revenue increases by $5 million.
Incremental operating expenses are only $2 million.
Working-capital requirements remain modest.
Much of the additional contribution can convert into operating and free cash flow.
This is one reason scalable business models can produce strong cash economics after reaching sufficient volume.
Free Cash Flow and Capital Expenditure Cycles
FCF can be volatile when capital investment is irregular.
Suppose a company replaces expensive machinery every five years.
Annual FCF might look exceptionally strong during years with little capital expenditure and weak during the replacement year.
A single period can therefore misrepresent normalized cash generation.
Long-term analysis should examine capital expenditure over a full economic cycle.
Maintenance vs Growth Capital Expenditure
A useful conceptual distinction separates:
Maintenance CapEx — investment needed to sustain current operations.
Growth CapEx — investment intended to expand future capacity or capability.
Suppose FCF is negative because the company spends heavily on a new facility.
If most of the spending is genuinely growth-oriented, normalized cash generation from the existing business can be stronger than current headline FCF suggests.
However, the distinction is often judgmental.
Companies do not always provide a precise separation.
Analysts should avoid simply labeling undesirable capital spending “growth” to improve the narrative.
Free Cash Flow Before Growth CapEx
Management sometimes examines cash generation before discretionary growth investment.
A conceptual internal measure could be:
Cash After Maintenance Investment = Operating Cash Flow − Maintenance CapEx
Suppose:
Operating cash flow = $10 million
Maintenance CapEx = $3 million
Growth CapEx = $5 million
Cash after maintenance investment:
$10 million − $3 million = $7 million
Reported simple FCF after all $8 million of CapEx:
$10 million − $8 million = $2 million
Both numbers provide useful information, but they answer different questions and should be labeled clearly.
Free Cash Flow and Debt
The debt ratio tells how much debt exists relative to assets.
FCF provides information about the cash potentially available to reduce borrowing.
Suppose debt equals $20 million and sustainable annual FCF equals $5 million.
Ignoring interest, taxes, refinancing, and other uses for a simplified illustration:
Debt ÷ FCF = $20 million ÷ $5 million
= 4 years of FCF
This is not a standard repayment forecast, but it demonstrates why creditors care about cash-generation capacity in addition to balance-sheet leverage.
Free Cash Flow and Debt-to-Equity
The debt-to-equity ratio describes debt relative to shareholder capital.
Two companies can report the same D/E ratio but generate very different FCF.
The company producing more sustainable FCF generally has more internal capacity to service or reduce debt.
Capital structure tells us how the business is financed.
Cash flow tells us how much financial flexibility the business is generating.
Free Cash Flow and Interest Coverage
Interest coverage commonly compares EBIT with interest expense.
FCF addresses a different layer.
Even strong interest coverage does not guarantee that the company has enough cash to repay principal, fund capital expenditure, or satisfy other obligations.
Conversely, a business can generate healthy FCF while reporting temporarily weaker accounting coverage due to noncash charges.
The two measures should be read together.
Free Cash Flow and Financial Leverage
The preceding financial leverage article explains how fixed financing obligations magnify shareholder outcomes.
FCF determines whether the company generates actual cash after investment that can help support those obligations.
A highly leveraged company with durable FCF can have more financing flexibility than an equally leveraged company with chronically negative FCF.
Leverage ratios identify financial commitments.
Cash generation determines how manageable those commitments may be.
Free Cash Flow and the Equity Multiplier
The equity multiplier measures assets relative to shareholder equity.
A company can expand its asset base through leverage and increase its multiplier.
If the new assets generate strong FCF, the financing can potentially support shareholder returns.
If they consume cash without adequate economic returns, the larger asset base simply increases financial exposure.
Asset growth and cash generation should therefore be analyzed together.
Free Cash Flow and Economic Value Added
Economic value added asks whether operating returns exceed the cost of invested capital.
FCF measures cash after specified investment.
A company can show temporarily weak FCF while investing heavily in projects expected to generate strongly positive economic returns.
Another can produce positive FCF by underinvesting in the business, allowing assets and competitive capability to deteriorate.
Sustainable value requires both disciplined investment and adequate return on that investment.
Free Cash Flow and Return on Invested Capital
Return on invested capital adds capital efficiency to the analysis.
Suppose a company generates $5 million of FCF but requires $200 million of invested capital.
Another generates $4 million using only $25 million of capital.
Absolute FCF alone does not identify which business uses capital more efficiently.
FCF measures cash generation.
ROIC evaluates the returns associated with the capital supporting operations.
Free Cash Flow and Return on Assets
Return on assets compares profitability with the asset base.
High reported ROA can coexist with weak FCF when receivables, inventory, or capital expenditure absorb cash.
Likewise, low current ROA can coexist with improving FCF after a company releases working capital or reduces investment.
The measures examine different dimensions of performance.
Free Cash Flow and Asset Turnover
Asset turnover measures revenue generated from assets.
A company can improve FCF by using existing assets more productively rather than continually adding new capacity.
Suppose revenue rises while the asset base and capital expenditure remain relatively stable.
Operating cash generation can improve without major incremental investment.
That can create strong FCF scalability.
Free Cash Flow and Break-Even
Break-even analysis determines the operating level required to cover costs under its chosen model.
Cash break-even can differ.
A business may reach accounting break-even while still producing negative FCF because capital expenditure or working-capital investment remains high.
Conversely, depreciation can make accounting profit lower without an equivalent current cash outflow.
Profit break-even and cash break-even should therefore not be treated as identical thresholds.
Free Cash Flow and Contribution Margin
Contribution margin determines how much incremental sales revenue remains after variable costs to support fixed expenses and profit.
Strong contribution economics can eventually support higher operating cash flow.
Yet the company must still collect the revenue and fund any associated inventory or capital expenditure.
A profitable sale that is collected a year later can place more short-term pressure on cash than the income statement initially suggests.
Free Cash Flow and Cash Flow Forecasting
Cash flow forecasting addresses timing that annual FCF cannot show.
Suppose a company expects $4 million of positive full-year FCF.
It still might face a severe cash shortage in the second quarter because customer collections arrive late and a major equipment payment occurs early.
Annual FCF can be positive while intra-year liquidity becomes tight.
Cash forecasts therefore remain necessary.
Free Cash Flow and Burn Rate
For cash-consuming businesses, burn rate and negative FCF can overlap but are not always identical.
Burn rate usually focuses on the rate at which available cash is being consumed.
FCF uses a defined operating-cash-flow-minus-capital-expenditure framework.
A startup can have negative FCF because it invests heavily in growth assets even when core operations approach cash break-even.
Understanding the cause of cash consumption matters more than the label.
Free Cash Flow and Cash Runway
Cash runway estimates how long available cash can support net cash consumption.
Suppose available cash equals $6 million and annual negative FCF is $3 million, occurring relatively evenly for a simplified illustration.
Approximate Annualized Runway = $6 million ÷ $3 million
= 2 years
Actual runway should use realistic timing, financing obligations, restricted cash, and forecast burn rather than annual FCF alone.
Still, persistent negative FCF is an important warning when liquidity is finite.
Free Cash Flow and Business Valuation
Business valuation frequently focuses on expected future cash flows because value ultimately depends on the economic cash benefits investors expect to receive.
A company generating strong sustainable FCF may be worth more than another with similar accounting profit but much heavier investment requirements.
However, current FCF should not simply be multiplied by an arbitrary number.
Growth, risk, capital structure, reinvestment needs, cyclicality, and return on capital all influence value.
Free Cash Flow Yield
A common investor-oriented metric is free cash flow yield.
For an equity-based FCF definition, a simplified calculation can be:
FCF Yield = Free Cash Flow ÷ Equity Value × 100
Suppose:
Free cash flow = $5 million
Equity value = $50 million
FCF Yield = $5 million ÷ $50 million × 100
= 10%
The company produces FCF equal to 10% of the equity value used in the calculation.
However, the numerator and valuation basis must be matched correctly.
Enterprise-level and equity-level cash flows should not be mixed casually.
Free Cash Flow Growth
Suppose FCF changes:
Year 1 = $2 million
Year 2 = $3 million
Year 3 = $4.5 million
That is strong growth.
The next question is why.
Operating margins may be improving.
Working capital may be releasing cash.
Capital expenditure may have declined.
A temporary tax benefit may exist.
The company may be underinvesting.
Cash-flow growth should be decomposed before being treated as sustainable.
Sustainable vs Temporary Free Cash Flow
Some FCF improvements repeat.
Others do not.
Collecting an unusually large receivable can increase one period’s operating cash flow.
Reducing excessive inventory can release substantial cash.
Selling down working capital can help once, but inventory cannot be reduced below operational needs indefinitely.
Similarly, postponing capital expenditure can temporarily increase FCF but create larger spending requirements later.
Sustainable FCF comes from durable operating economics and disciplined investment.
Normalized Free Cash Flow
Analysts sometimes estimate normalized FCF by smoothing temporary working-capital changes, unusual capital expenditure, or other nonrecurring cash effects.
This can improve long-term analysis.
It can also become subjective.
Every adjustment should have a defensible economic reason.
A weak business should not be turned into a strong cash generator simply by labeling recurring cash costs “unusual.”
Adjusted Free Cash Flow
Companies may present adjusted FCF measures that add back or exclude particular cash items.
Those adjustments can include restructuring payments, acquisition-related costs, or other company-defined items.
Adjusted figures can help understand underlying operations when the exclusions are genuinely unusual.
However, they reduce comparability.
Standard FCF and the underlying statement of cash flows should remain visible.
Free Cash Flow Is Not Fully Standardized
A major analytical issue is that FCF is not defined identically by every company.
One business may calculate:
Operating Cash Flow − Property and Equipment Purchases
Another may also deduct purchases of intangible assets.
A third may net asset-sale proceeds against capital expenditure.
Adjusted versions may exclude restructuring or transaction costs.
Therefore, comparing headline FCF figures without reading the definition can produce false precision.
Free Cash Flow and Acquisitions
Acquisition spending is often excluded from the simple operating-cash-flow-minus-CapEx FCF calculation.
That means a company can report healthy FCF while spending large amounts of cash buying other businesses.
Acquisitions are still real capital-allocation decisions.
When evaluating total cash demands, analysts should inspect investing activities beyond ordinary CapEx.
Free Cash Flow and Dividends
Positive FCF can support dividend payments.
Suppose sustainable FCF equals $10 million and annual dividends equal $4 million.
A simplified FCF dividend coverage relationship is:
FCF After Dividends = $10 million − $4 million
= $6 million
The company retains substantial cash after the distribution.
However, dividends should not be assumed safe merely because one year’s FCF covers them.
Cyclicality, debt, investment requirements, and future cash generation matter.
Free Cash Flow and Share Repurchases
Companies can also use FCF for share repurchases.
A repurchase can reduce shares outstanding and return capital to shareholders.
However, buying shares does not automatically create value.
The economic result depends partly on the price paid relative to the company’s value and competing uses for the cash.
Strong FCF provides capacity for capital allocation; it does not determine the best allocation.
Free Cash Flow and Debt Repayment
Debt repayment is another possible use of FCF.
Suppose annual FCF equals $6 million and management allocates $4 million to debt reduction.
Debt can decline while the company retains $2 million for other uses.
Consistent FCF generation can therefore strengthen the balance sheet over time.
However, principal repayment is generally a financing cash flow rather than part of the basic FCF formula.
Free Cash Flow and Cash Reserves
Management may choose to retain FCF rather than distribute it.
The cash balance grows.
This can support resilience, acquisitions, investment, or future debt repayment.
Yet excess cash with no productive use can reduce capital efficiency.
The appropriate reserve depends on operating volatility, financing access, strategic opportunities, and risk.
How to Improve Free Cash Flow
Free cash flow can improve through stronger operating profit, better collection, more efficient inventory, appropriate supplier terms, disciplined operating expenses, and productive capital allocation.
A company can also improve short-term FCF by reducing CapEx.
That strategy becomes harmful if it starves necessary maintenance or profitable investment.
The best FCF improvement strengthens cash generation without damaging the assets, customers, employees, or capabilities required for future performance.
Improving FCF Through Receivables
Suppose annual sales equal $36.5 million.
Average daily sales equal:
$36.5 million ÷ 365 = $100,000 per day
If collections improve enough to reduce receivables by the equivalent of five days:
Approximate Cash Release = 5 × $100,000
= $500,000
That release can strengthen operating cash flow and therefore FCF, assuming the improvement does not require offsetting concessions.
Improving FCF Through Inventory
Suppose management safely removes $800,000 of unnecessary inventory while maintaining customer service.
The cash previously tied up in that inventory can be released as the working-capital position normalizes.
This can improve FCF.
However, aggressive inventory reduction can create stockouts or production interruptions.
Working-capital efficiency should be optimized, not minimized.
Improving FCF Through CapEx Discipline
Capital expenditure should be evaluated according to expected economic return.
A low-return project consuming $5 million can reduce FCF without creating adequate value.
Cancelling it can preserve cash.
A high-return project may also reduce current FCF by $5 million but substantially increase future cash generation.
Therefore, cutting CapEx merely to maximize current-year FCF can be shortsighted.
Common Free Cash Flow Mistakes
One common mistake is treating EBITDA as FCF.
Another is treating net income as cash.
Analysts can also ignore working-capital changes or assume depreciation equals capital expenditure.
Comparing company-defined FCF figures without checking their formulas creates another problem.
A temporary working-capital release can be mistaken for sustainable cash generation.
Similarly, cutting necessary capital expenditure can artificially boost current FCF.
Finally, positive FCF does not mean every dollar is available for dividends or buybacks.
Limitations of Free Cash Flow
Free cash flow depends on definition.
Capital expenditure can be volatile.
Working-capital timing can distort individual periods.
Management can delay spending.
Acquisitions can be excluded from standard calculations.
Debt principal payments may also sit outside FCF.
A growing business can look weak because investment is high, while a declining company can temporarily look strong by reducing working capital and investment.
FCF therefore needs multi-period analysis and business context.
How to Analyze Free Cash Flow Properly
Start with the statement of cash flows.
Identify net cash generated by operating activities.
Determine exactly what the company’s FCF calculation subtracts as capital expenditure.
Reconcile any adjusted version.
Then compare FCF with net income, EBIT, and EBITDA.
Review working-capital changes.
Separate recurring maintenance investment from major growth projects where reliable information allows.
Calculate FCF margin and conversion trends.
Examine debt and interest requirements.
Review several years rather than one period.
Finally, connect sustainable FCF with capital returns and valuation.
The important question is not simply:
“Is free cash flow positive?”
It is:
“Why is the business generating this amount of cash, how much investment is required to sustain it, which parts are repeatable, and what productive uses exist for the cash that remains?”
Frequently Asked Questions
What is free cash flow?
Free cash flow is a measure of cash generated after deducting specified capital expenditures from operating cash flow.
What is the free cash flow formula?
A common formula is:
Free Cash Flow = Operating Cash Flow − Capital Expenditures
What does FCF stand for?
FCF stands for free cash flow.
Is free cash flow the same as operating cash flow?
No. Operating cash flow is the starting point in a common FCF calculation. Capital expenditure is then deducted.
Is free cash flow the same as net income?
No. Net income is an accounting earnings measure. FCF reflects actual operating cash movements and capital expenditure.
Is free cash flow the same as EBITDA?
No. EBITDA excludes interest, taxes, depreciation, and amortization but does not fully account for working-capital changes or capital expenditure.
Can free cash flow be negative?
Yes. FCF becomes negative when the capital expenditure deducted under the definition exceeds operating cash flow.
Is negative FCF always bad?
No. It can reflect weak cash economics, but it can also result from productive growth investment. The cause and expected return on that investment matter.
Can a profitable company have negative FCF?
Yes. Working-capital investment or heavy capital spending can produce negative FCF even when net income is positive.
Can a company with a net loss have positive FCF?
Yes. Noncash expenses, working-capital releases, and modest capital spending can produce positive FCF even when accounting net income is negative.
What is free cash flow margin?
FCF Margin = Free Cash Flow ÷ Revenue × 100
It measures FCF as a percentage of revenue.
What is FCF conversion?
A company-defined conversion measure may compare FCF with an earnings metric such as EBITDA:
FCF Conversion = Free Cash Flow ÷ EBITDA × 100
The definition should be stated because conversion measures are not universally standardized.
Final Perspective
Free cash flow moves financial analysis from accounting earnings toward the cash economics of the business.
The basic relationship is:
Free Cash Flow = Operating Cash Flow − Capital Expenditures
It answers an important question:
After operations generate cash and the company funds the capital investment included in the calculation, what cash remains?
That remaining cash can provide flexibility for debt reduction, reinvestment, acquisitions, distributions, share repurchases, or liquidity reserves.
Yet the headline number needs context.
Working capital can inflate or depress one period’s cash flow.
Capital expenditure can be temporarily high because the company is building valuable new capacity.
It can also be temporarily low because management postponed necessary investment.
Different companies define FCF differently.
Therefore, the strongest analysis does not stop at whether FCF is positive.
It follows the entire chain:
profitability → operating cash conversion → working capital → capital expenditure → free cash flow → capital allocation → long-term value creation.
When that chain is understood, free cash flow becomes one of the most useful measures for judging a company’s financial flexibility, investment demands, debt capacity, and underlying cash economics.




