


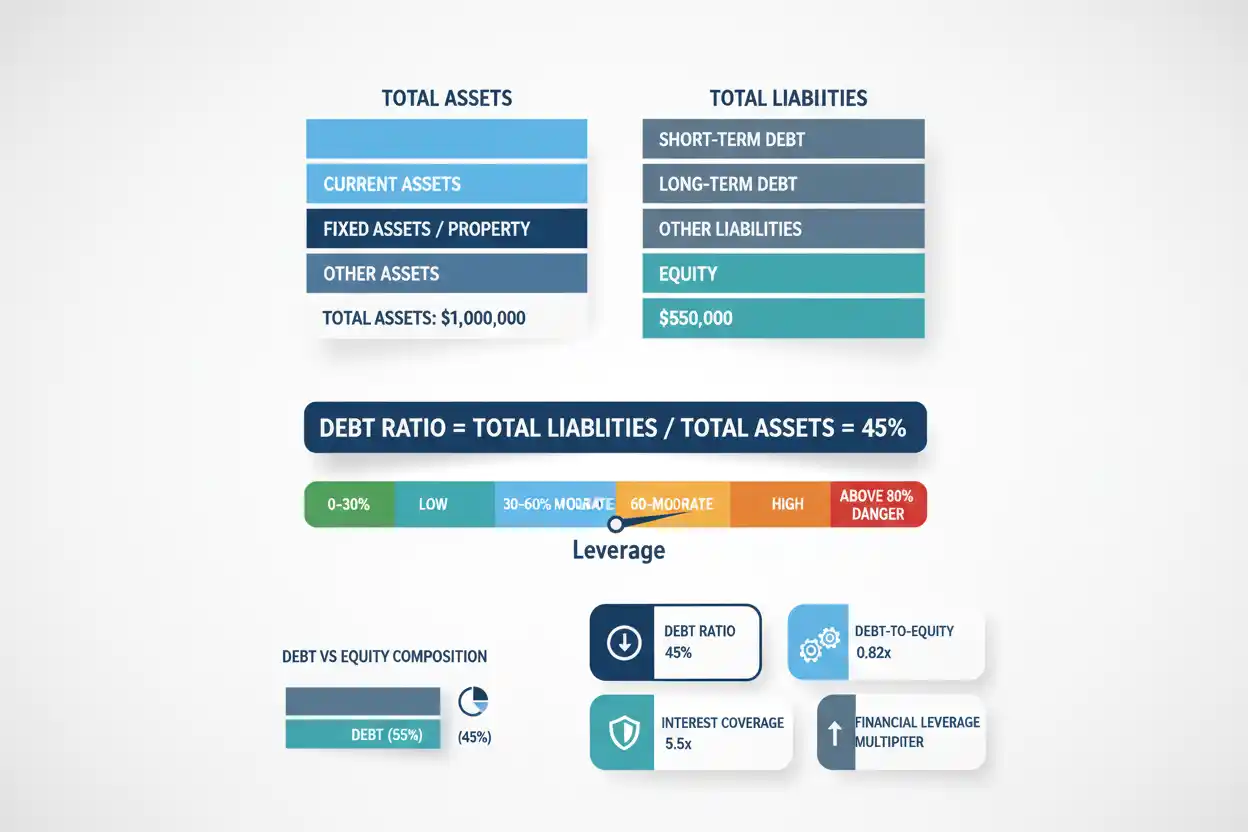
The debt ratio measures how much of a company’s asset base is financed by debt under the definition used in the calculation. It compares debt with total assets and provides a simple view of financial leverage.
A common formula is:
Debt Ratio = Total Debt ÷ Total Assets
If a business has $3 million of qualifying debt and $5 million of total assets:
Debt Ratio = $3,000,000 ÷ $5,000,000
Debt Ratio = 0.60, or 60%
A 60% debt ratio means the company’s debt equals approximately 60% of its reported total asset base under this definition.
The calculation is simple. Interpretation requires more context.
A higher debt ratio usually means greater reliance on borrowing relative to assets. A lower ratio means debt represents a smaller portion of the asset base. However, neither result should be labeled automatically good or bad without examining the company’s industry, cash generation, asset quality, financing terms, profitability, maturity schedule and ability to service obligations.
That makes the debt ratio one component of business finance rather than a complete measure of financial strength.
What Is the Debt Ratio?
The debt ratio is a leverage ratio comparing debt with assets.
It answers a basic capital-structure question:
How much debt does the company carry relative to the assets on its balance sheet?
Imagine a company owns $10 million of assets and carries $4 million of qualifying debt.
Debt Ratio = $4,000,000 ÷ $10,000,000
Debt Ratio = 40%
Another company with the same $10 million asset base but $8 million of debt has:
Debt Ratio = $8,000,000 ÷ $10,000,000
Debt Ratio = 80%
The second business relies much more heavily on debt financing relative to its asset base.
That usually creates greater sensitivity to interest rates, refinancing conditions, earnings weakness and asset-value deterioration, although the actual risk depends on the debt structure and the economics of the business.
Debt Ratio Formula
The basic formula is:
Debt Ratio = Total Debt ÷ Total Assets
To express the result as a percentage:
Debt Ratio % = Total Debt ÷ Total Assets × 100
Suppose total debt equals $2.5 million and total assets equal $8 million.
Debt Ratio = $2,500,000 ÷ $8,000,000
Debt Ratio = 0.3125
As a percentage:
Debt Ratio = 31.25%
The business carries debt equal to approximately 31.25% of its reported assets.
The key analytical issue is what qualifies as total debt.
What Counts as Debt?
Debt can include interest-bearing obligations such as short-term borrowings, bank loans, notes payable, bonds, finance-related obligations and the current portion of longer-term borrowings, depending on the chosen methodology.
Analysts should define the numerator consistently.
Some sources and financial models use a broader liabilities-to-assets calculation and label it a debt ratio:
Total Liabilities ÷ Total Assets
That is not economically identical to an interest-bearing-debt-to-assets ratio.
Total liabilities can include accounts payable, accrued expenses, deferred revenue, taxes payable and other obligations that are not conventional borrowing.
The Logic Library uses debt ratio here primarily for debt relative to assets while explicitly separating broader liabilities where needed. Consistency matters more than forcing different definitions into one number.
Debt Ratio Using Total Liabilities
A broader solvency ratio can be calculated as:
Liabilities-to-Assets Ratio = Total Liabilities ÷ Total Assets
Suppose total assets are $5 million.
Interest-bearing debt is $2 million.
Other liabilities total another $1 million.
Debt-to-assets ratio:
Debt Ratio = $2,000,000 ÷ $5,000,000 = 40%
Total-liabilities-to-assets ratio:
Liabilities-to-Assets = $3,000,000 ÷ $5,000,000 = 60%
Those calculations tell different stories.
The first isolates borrowing.
The second captures the broader claim of liabilities against assets.
Before comparing ratios, confirm that the numerators use the same definition.
Debt Ratio Example
Consider a company with the following financial position:
Short-term borrowings: $300,000
Current portion of long-term debt: $200,000
Long-term loans and notes: $1,500,000
Total assets: $4,000,000
Total debt is:
Total Debt = $300,000 + $200,000 + $1,500,000
Total Debt = $2,000,000
The debt ratio is:
Debt Ratio = $2,000,000 ÷ $4,000,000
Debt Ratio = 0.50
Debt Ratio = 50%
Debt equals half of the company’s total asset base.
That does not mean half of every individual asset was purchased with borrowed money. The ratio describes the aggregate relationship between balance-sheet debt and assets.
What Does a Debt Ratio of 0.5 Mean?
A debt ratio of 0.50, or 50%, means qualifying debt equals half of the value of total assets represented in the calculation.
For example:
Debt = $6 million
Assets = $12 million
Debt Ratio = $6,000,000 ÷ $12,000,000 = 0.50
The remaining financing can involve shareholder equity and other balance-sheet claims depending on the financial structure.
A 50% ratio should not automatically be judged healthy or risky.
An established utility with predictable cash flows can support leverage differently from a volatile early-stage business.
What Does a High Debt Ratio Mean?
A high debt ratio indicates relatively heavy reliance on debt compared with the asset base.
That can increase financial risk because borrowing usually brings contractual obligations.
Interest must be paid according to agreed terms.
Principal eventually needs to be repaid or refinanced.
Loan agreements can include covenants.
Falling profits do not automatically reduce scheduled debt obligations.
For these reasons, heavily leveraged businesses generally have less room for operating underperformance.
However, debt can also finance productive assets that generate returns exceeding the financing cost.
The existence of leverage is not inherently negative.
The issue is whether the company can support it.
What Does a Low Debt Ratio Mean?
A low debt ratio means relatively little debt is carried against the company’s assets.
That can imply greater financial flexibility and lower refinancing risk.
However, very low leverage does not automatically mean management is using capital optimally.
A profitable, stable business may be able to use appropriate borrowing to finance productive assets, acquisitions or expansion while retaining equity capital for other purposes.
A company can therefore be conservatively financed yet still make poor capital-allocation decisions.
Debt ratio measures leverage, not management quality.
What Is a Good Debt Ratio?
There is no universal good debt ratio.
Appropriate leverage depends on the industry and the stability of the company’s economics.
Capital-intensive industries can naturally carry significant borrowing because they own substantial long-lived assets.
Asset-light businesses can have very different capital structures.
A regulated infrastructure business with predictable revenue may support more leverage than a cyclical company whose earnings fluctuate sharply.
Rather than applying an arbitrary threshold, compare the ratio with the company’s own history, genuinely similar businesses and the cash flows available to service debt.
Debt Ratio vs Debt-to-Equity Ratio
The debt-to-equity ratio compares debt with shareholder equity.
Debt-to-Equity Ratio = Total Debt ÷ Shareholders’ Equity
The debt ratio compares debt with assets.
Debt Ratio = Total Debt ÷ Total Assets
Suppose a company has:
Debt = $4 million
Equity = $6 million
Assets = $10 million
Debt ratio:
Debt Ratio = $4,000,000 ÷ $10,000,000 = 40%
Debt-to-equity:
Debt-to-Equity = $4,000,000 ÷ $6,000,000
Debt-to-Equity ≈ 0.67
The debt ratio asks how much debt exists relative to the asset base.
Debt-to-equity asks how debt compares with the owners’ book equity.
Both measure leverage from different perspectives.
Debt Ratio vs Financial Leverage
Financial leverage is a broader concept describing the use of borrowed or fixed-cost financing to magnify potential returns and risks.
Debt ratio is one way to quantify part of that leverage.
A company with a high debt ratio typically has greater financial leverage than an otherwise identical company carrying little debt.
However, financial leverage can also be studied through equity multipliers, debt-to-equity relationships, financing costs and sensitivity of shareholder returns.
The debt ratio therefore provides a balance-sheet leverage snapshot rather than the entire leverage framework.
Debt Ratio vs Degree of Combined Leverage
Degree of combined leverage examines how changes in sales can affect earnings available to shareholders through both operating and financial leverage.
Debt ratio is much simpler.
It does not measure earnings sensitivity.
A company might have a moderate debt ratio but high operating fixed costs, making total earnings highly sensitive to revenue changes.
Another may have substantial assets and debt but relatively stable operating economics.
The two metrics should not be substituted for one another.
Debt Ratio and Total Assets
The denominator includes the company’s reported total asset base under the selected financial statements.
Assets can include cash, receivables, inventory, property, equipment, investments, intangible assets and other recognized resources.
The composition matters.
A company whose assets consist largely of liquid investments has a different risk profile from a company whose assets include highly specialized equipment that may be difficult to sell.
Likewise, accounting carrying values do not always equal market values.
A debt ratio should therefore be interpreted with asset quality in mind.
Debt Ratio and Asset Turnover
Asset turnover measures revenue relative to average assets.
Debt ratio measures debt relative to assets.
Combining the two perspectives can reveal whether a heavily financed asset base is also producing substantial sales.
Suppose two companies each have $10 million of assets and $6 million of debt.
Their debt ratios are both 60%.
Company A generates $20 million of revenue.
Company B generates $5 million.
Their leverage is identical by debt ratio, but their asset utilization is very different.
Revenue efficiency does not determine debt safety by itself, but it adds operating context.
Debt Ratio and Return on Assets
Return on assets compares profit with the asset base.
A company can finance assets partly with debt in an effort to generate returns.
If assets produce attractive economic returns above the effective financing cost, borrowing can improve equity economics.
If returns fall below the cost of debt, leverage can become destructive.
Suppose a business borrows heavily to purchase assets that barely generate profit.
The debt ratio rises, yet the additional asset base does not produce sufficient returns.
Leverage becomes more difficult to justify.
Debt Ratio and Interest Coverage
The debt ratio tells you how much debt exists relative to assets.
It does not tell you whether current earnings can cover interest payments.
That is where interest coverage becomes important.
A common coverage formula is:
Interest Coverage = EBIT ÷ Interest Expense
Consider two companies with identical 60% debt ratios.
Company A earns $20 million of EBIT and pays $2 million of interest.
Interest Coverage = 10×
Company B earns $3 million of EBIT and pays $2 million of interest.
Interest Coverage = 1.5×
The same leverage ratio produces very different debt-service capacity.
Debt Ratio and EBITDA
EBITDA is often used in credit analysis as one measure of earnings before certain expenses.
Debt-to-EBITDA metrics can help assess how large debt is relative to operating earnings capacity.
That question differs from debt-to-assets.
A business with a large asset base can report a moderate debt ratio but weak EBITDA.
Another asset-light company can have a relatively high debt ratio while generating strong recurring cash earnings.
No single leverage metric captures all dimensions of debt risk.
Debt Ratio and Operating Cash Flow
Debt must ultimately be serviced with cash, not accounting assets.
Operating cash flow therefore provides important context.
Suppose a company reports $50 million of total assets and $20 million of debt.
Debt Ratio = 40%
If operations consistently generate substantial cash, servicing that borrowing may be manageable.
If the company continually consumes operating cash, the same ratio becomes more concerning.
Balance-sheet leverage and cash-generation capacity need to be analyzed together.
Debt Ratio and Free Cash Flow
Free cash flow can indicate how much cash remains after specified operating and capital-investment requirements.
A highly leveraged company with strong and stable free cash flow may be able to reduce debt steadily.
A company with weak free cash flow may need refinancing even when reported assets appear substantial.
Assets provide collateral and economic resources.
Free cash flow provides repayment capacity.
Both matter.
Debt Ratio and Working Capital
Working capital describes the relationship between current assets and current liabilities.
Debt ratio covers the entire asset base and qualifying debt.
A company can have a low overall debt ratio yet face serious short-term liquidity pressure because too much debt matures soon.
Another company can carry considerable long-term debt while maintaining ample short-term liquidity.
Solvency and liquidity are related but different financial dimensions.
Debt Ratio and Current Ratio
The current ratio measures current assets relative to current liabilities.
Suppose a company has a 35% debt ratio but a current ratio of only 0.7.
Its overall debt relative to assets may appear moderate, yet current obligations exceed current assets.
Conversely, a company with a 65% debt ratio could maintain a strong current ratio because most borrowing is long-term.
The ratios answer different questions.
Debt ratio concerns leverage.
Current ratio concerns short-term balance-sheet liquidity.
Debt Ratio and Quick Ratio
The quick ratio focuses on more liquid current assets relative to current liabilities.
High leverage combined with weak quick liquidity can be particularly important when significant debt matures soon.
A company may own valuable assets but still lack immediate resources to satisfy near-term obligations.
This is why maturity structure matters.
Debt ratio alone ignores when the debt is due.
Debt Ratio and Cash Ratio
The cash ratio provides an even narrower view of immediate liquidity.
A business can have billions of dollars of assets but little cash.
If debt payments become due before assets generate or convert to cash, refinancing may be required.
The cash ratio therefore answers a different question:
How much immediate cash exists relative to current liabilities?
Debt ratio asks:
How much debt exists relative to the overall asset base?
Debt Ratio and Cash Flow Forecasting
A cash flow forecast can reveal upcoming principal and interest payments that the static debt ratio cannot.
Suppose a company reports a moderate 40% debt ratio.
A major loan maturity is due in six months.
The ratio can remain unchanged today while the forecast reveals a substantial upcoming financing requirement.
Debt analysis should therefore include both leverage level and maturity timing.
Debt Ratio and Cash Runway
For cash-consuming companies, cash runway can become important even when the balance sheet contains substantial debt-financed assets.
Borrowing may increase available cash initially.
However, debt also creates future repayments and interest.
A company with 18 months of apparent runway before loan payments are considered may have much less practical flexibility after the full debt schedule is modeled.
Liquidity planning should include financing obligations explicitly.
Debt Ratio and Burn Rate
Burn rate measures the pace at which a cash-consuming business uses available liquidity.
A company can increase debt to fund ongoing burn.
That increases cash immediately and can extend runway.
It can also increase the debt ratio.
If the underlying operating economics do not improve, management has exchanged more financial obligations for additional time.
Borrowing can bridge a temporary gap.
It cannot permanently solve an operation that continually consumes more economic resources than it creates.
Debt Ratio and Business Valuation
Business valuation frequently distinguishes enterprise value from equity value.
Debt matters because owners do not automatically receive the full enterprise value of an operating business.
A simplified relationship is:
Equity Value = Enterprise Value − Relevant Debt + Relevant Excess Cash
A company can therefore have a valuable operating business and still have much less equity value when substantial debt claims exist.
Debt ratio does not calculate valuation, but it provides capital-structure context for understanding how much financial leverage exists.
Debt Ratio and Enterprise Value
Enterprise value represents the value of the operating business attributable to capital providers under the chosen framework.
Debt is one of the financing claims involved in bridging enterprise value to shareholder value.
Suppose enterprise value is $20 million and relevant net debt is $8 million.
Ignoring other adjustments:
Equity Value ≈ $20,000,000 − $8,000,000
Equity Value ≈ $12,000,000
If debt rises materially without a corresponding increase in enterprise value, the economic claim available to equity holders can decline.
Debt Ratio and Startup Valuation
Early-stage companies may use equity financing more heavily because uncertain cash flows can make conventional debt difficult or risky.
However, some startups use venture debt, equipment financing, lines of credit or other borrowing.
A higher debt ratio can affect financial flexibility because future financing must coexist with existing creditor obligations.
Startup valuation involves many more factors, but capital structure should not be ignored.
Debt Ratio and Return on Equity
Return on equity measures earnings relative to shareholder equity.
Debt can increase ROE mathematically because less equity may finance a given asset base.
Suppose two businesses produce the same profit and own the same assets.
The company using more debt can have a smaller equity base and therefore higher ROE.
That does not necessarily mean it created superior economic value.
The higher return may have been achieved with greater financial risk.
ROE should therefore be interpreted alongside leverage.
How Debt Can Magnify Returns
Suppose an investor contributes $1 million to purchase a $1 million productive asset with no debt.
If the asset generates $100,000 of profit before considering financing:
Return on Equity = $100,000 ÷ $1,000,000 = 10%
Now suppose the investor contributes only $500,000 and borrows the remaining $500,000.
Ignoring interest temporarily:
Return on Equity Before Financing Cost = $100,000 ÷ $500,000 = 20%
Leverage doubled the apparent equity return.
But interest must be paid, and losses are also magnified relative to the smaller equity base.
Debt changes both potential return and financial risk.
How Debt Can Magnify Losses
Suppose the same $1 million asset loses $100,000 of economic value.
With no debt, the investor’s $1 million equity falls economically by 10%.
With $500,000 of debt and $500,000 of equity, the same $100,000 loss represents:
Loss Relative to Equity = $100,000 ÷ $500,000
= 20%
Debt does not create the asset loss, but leverage amplifies its effect on equity holders.
This is why financial leverage deserves careful risk analysis.
Debt Ratio and Interest Rates
A company with substantial variable-rate debt can become more vulnerable when market interest rates rise.
The debt ratio may remain exactly the same while interest expense increases.
Suppose debt remains $10 million.
At 4% interest:
Annual Interest = $10,000,000 × 4% = $400,000
At 8%:
Annual Interest = $10,000,000 × 8% = $800,000
The debt ratio did not change.
The annual financing burden doubled.
Leverage analysis should therefore include interest terms, not only principal amount.
Fixed-Rate vs Variable-Rate Debt
Two companies with identical debt ratios can face different financing risks if one uses long-term fixed-rate borrowing and the other relies heavily on short-term variable-rate debt.
Fixed-rate debt provides more predictable interest costs during the fixed period.
Variable-rate debt can become cheaper when rates fall but more expensive when rates rise.
The maturity schedule also matters.
A fixed-rate loan that matures next month can create greater immediate refinancing risk than one locked for another ten years.
The debt ratio captures none of those differences.
Debt Maturity Risk
A company can have a manageable total amount of debt but an unfavorable maturity profile.
Suppose $10 million of debt exists.
Company A repays it gradually over ten years.
Company B owes most of it next year.
Their debt ratios may be identical.
Their refinancing needs are not.
Analysts should review the current portion of debt, maturity schedules, cash balances and forecast cash generation before concluding that the leverage level is sustainable.
Debt Ratio and Refinancing Risk
Refinancing risk arises when a business depends on replacing maturing debt with new borrowing.
A company may plan to refinance because repaying the entire principal from current cash would be impractical.
If credit markets tighten, lenders may demand higher rates, stronger collateral, lower leverage or additional covenants.
A debt ratio that appears manageable under easy financing conditions can become more problematic when refinancing availability changes.
Debt Ratio and Loan Covenants
Loan agreements can restrict leverage, distributions, acquisitions, additional borrowing or other financial actions.
A company can therefore face problems before it becomes unable to pay debt.
If leverage violates a contractual covenant, lenders may receive rights or remedies defined by the agreement.
The debt ratio may or may not be the exact covenant metric because lenders often use specific definitions such as net leverage, debt-to-EBITDA or other contractual measures.
Always distinguish general financial ratios from covenant definitions.
Debt Ratio and Collateral
Asset-backed lenders often care about the quality and value of assets supporting debt.
A 50% debt ratio backed largely by cash and readily marketable assets differs economically from the same ratio backed by highly specialized equipment with uncertain resale value.
Book values may also differ from liquidation values.
This is one reason the debt ratio should not be interpreted solely from reported accounting totals.
Debt Ratio and Intangible Assets
Some companies hold substantial intangible assets such as goodwill and acquired intellectual property.
These amounts increase total assets and can reduce the debt ratio mathematically.
Suppose debt is $5 million and assets are $10 million:
Debt Ratio = 50%
An acquisition adds $5 million of goodwill with no change in debt for this simplified illustration.
Total assets become $15 million.
New Debt Ratio = $5,000,000 ÷ $15,000,000
New Debt Ratio ≈ 33.3%
The ratio improved mathematically even though the company’s cash available for debt repayment did not automatically increase.
Asset composition therefore matters.
Debt Ratio and Depreciation
Depreciation can reduce the carrying amount of long-lived assets over time.
If debt remains unchanged while reported assets decline because of depreciation, the debt ratio can rise even without new borrowing.
Suppose debt remains $4 million.
Assets initially equal $10 million:
Debt Ratio = 40%
Reported assets later decline to $8 million:
Debt Ratio = $4,000,000 ÷ $8,000,000
Debt Ratio = 50%
The ratio increased because the denominator fell.
That does not necessarily mean the company borrowed additional money.
Debt-Financed Asset Purchase
Suppose a company begins with:
Debt = $2 million
Assets = $5 million
Debt Ratio = 40%
It borrows another $1 million and immediately buys $1 million of equipment.
New debt = $3 million
New assets = $6 million
New Debt Ratio = $3,000,000 ÷ $6,000,000
New Debt Ratio = 50%
Both debt and assets increased, but debt increased proportionately more relative to the original financial structure.
The company became more leveraged.
Paying Debt With Cash
Paying debt with cash can change the debt ratio in a way that depends on the starting relationship.
Suppose:
Debt = $4 million
Assets = $10 million
Debt Ratio = 40%
The company pays $1 million of debt using $1 million of cash.
New debt = $3 million
New assets = $9 million
New Debt Ratio = $3,000,000 ÷ $9,000,000
Debt Ratio ≈ 33.3%
The ratio falls because debt is reduced proportionately more than assets.
Debt repayment can therefore deleverage the balance sheet.
Equity Financing and the Debt Ratio
Suppose a company raises $2 million of new equity and holds the proceeds in cash.
Before financing:
Debt = $4 million
Assets = $8 million
Debt Ratio = 50%
After the equity raise:
Debt remains $4 million
Assets rise to $10 million
New Debt Ratio = $4,000,000 ÷ $10,000,000
New Debt Ratio = 40%
The company becomes less leveraged relative to the enlarged asset base even without paying down debt.
However, issuing equity also changes ownership economics.
Asset Write-Downs and Debt Ratio
If assets are impaired or written down while debt remains unchanged, leverage can increase mathematically.
Suppose:
Debt = $6 million
Assets = $12 million
Debt Ratio = 50%
A $2 million asset impairment reduces assets to $10 million.
New Debt Ratio = $6,000,000 ÷ $10,000,000
New Debt Ratio = 60%
Nothing changed in the nominal debt balance.
The asset cushion fell.
That can be economically significant for lenders and shareholders.
Debt Ratio Trend Analysis
A single ratio provides limited context.
Suppose:
Year 1 = 30%
Year 2 = 42%
Year 3 = 58%
The rising trend deserves investigation.
Perhaps the company borrowed for acquisitions.
Maybe it financed new facilities.
Assets may have been written down.
Cash losses may have reduced the asset base.
Alternatively, the business may be deliberately optimizing a previously underleveraged balance sheet.
Now consider a ratio declining from 70% to 45%.
That can indicate debt repayment, profitable equity accumulation, asset growth funded without proportionate new borrowing or new equity financing.
Trend direction identifies change; financial statements explain why.
Debt Ratio for Capital-Intensive Businesses
Manufacturers, utilities, infrastructure operators, transportation companies and other capital-intensive businesses can require substantial debt financing.
A high absolute debt balance can therefore be normal.
The key questions concern cash-flow stability, asset life, financing maturity, interest cost and returns generated by the assets.
Comparing a utility’s debt ratio with a software consultancy’s ratio without considering their radically different asset structures provides little analytical value.
Debt Ratio for Asset-Light Businesses
Asset-light companies require fewer physical assets to produce revenue.
Their balance sheets can therefore be smaller relative to earnings or market value.
A moderate amount of borrowing can produce a relatively high debt ratio simply because reported assets are limited.
That does not automatically mean the business is in distress.
Likewise, an asset-light company can face serious leverage risk even when nominal borrowing is small if cash flows are volatile.
Debt Ratio for Startups
Early-stage companies often have uncertain revenue and negative cash flow.
That can make substantial debt more difficult to support because repayments are contractual even when business performance disappoints.
Equity financing does not require scheduled principal repayment in the same way, although it dilutes ownership.
Startups using debt should therefore pay close attention to burn rate, cash runway, interest costs and maturity timing.
Debt Ratio for Mature Businesses
Established companies with predictable cash flows may support more leverage.
Stable customer demand and recurring cash generation can give lenders more confidence.
Yet maturity, cyclicality and strategic risk still matter.
A mature company can become overleveraged through acquisitions, distributions, buybacks or prolonged operating decline.
Company age does not make leverage safe automatically.
How to Reduce the Debt Ratio
A company can reduce the debt ratio by lowering debt, increasing assets without proportionate borrowing, or combining both.
Debt repayment from retained cash flows directly reduces borrowing.
Equity financing can increase assets relative to debt.
Profitable operations retained in the business can strengthen the balance sheet over time.
Asset appreciation is not necessarily reflected automatically in accounting values, so market improvements do not always change the reported denominator.
The business should focus on sustainable capital structure rather than manipulating the ratio mechanically.
Can a Debt Ratio Be Above 100%?
Yes, mathematically, if the debt definition used exceeds reported total assets.
Suppose debt is $12 million and assets are $10 million.
Debt Ratio = $12,000,000 ÷ $10,000,000
Debt Ratio = 120%
Such a result deserves careful analysis.
It can indicate an extremely leveraged capital structure, unusual accounting circumstances, asset write-downs or a debt definition broader than the asset base being compared.
A ratio above 100% should not be interpreted casually.
Can the Debt Ratio Be Zero?
Yes.
If a company has no qualifying debt:
Debt Ratio = $0 ÷ Total Assets = 0%
The business is debt-free under the selected definition.
It can still have accounts payable, tax liabilities, lease obligations or other claims depending on what the calculation excludes.
A zero debt ratio therefore does not necessarily mean a company has zero liabilities.
Can the Debt Ratio Be Negative?
Under the standard debt-to-assets formulation with nonnegative debt and assets, the ratio ordinarily should not be negative.
If a calculation produces a negative result, review the data and definitions.
Unusual accounting equity does not create a negative debt ratio because equity is not the denominator.
A negative result typically suggests inappropriate inputs or a nonstandard metric.
Debt Ratio vs Solvency
Debt ratio contributes to solvency analysis but does not determine solvency by itself.
Solvency concerns the company’s ability to meet long-term financial obligations and continue operating.
That requires examination of assets, liabilities, cash flow, earnings, financing access and maturity structures.
A company with a moderate debt ratio can still become insolvent if cash generation collapses.
Another with high leverage may remain solvent for years if cash flows are strong and obligations are structured appropriately.
Debt Ratio vs Liquidity
Liquidity focuses on near-term ability to meet obligations.
Solvency and leverage look further into the capital structure.
The current ratio, quick ratio and cash ratio provide liquidity perspectives.
Debt ratio provides leverage context.
A company needs both short-term liquidity and long-term financial sustainability.
Strong performance in one dimension does not guarantee the other.
Common Debt Ratio Mistakes
The most important mistake is failing to define debt.
Using interest-bearing debt in one calculation and total liabilities in another makes comparisons unreliable.
Another mistake is applying universal thresholds across industries.
Analysts can also overlook asset quality, debt maturity, interest rates, covenant terms and cash generation.
A low ratio can look comfortable even when most debt matures immediately.
A high ratio can look alarming while the company generates stable contractual cash flows.
Finally, book assets should not be assumed to equal cash available for creditors.
Limitations of the Debt Ratio
Debt ratio reduces a complex capital structure to one number.
It does not show interest rates.
It does not reveal maturity dates.
It does not distinguish secured from unsecured debt.
It does not measure earnings coverage.
It does not describe cash generation.
It can be affected by asset write-downs, acquisitions, depreciation and accounting classifications.
Its interpretation can also change significantly depending on whether “debt” means interest-bearing borrowings or total liabilities.
The ratio is useful precisely because it is simple, but that simplicity sets its limits.
How to Analyze the Debt Ratio Properly
Start by defining the numerator.
Determine which liabilities qualify as debt.
Use the same definition for every company or period being compared.
Then inspect the composition and quality of total assets.
Compare the debt ratio with the debt-to-equity ratio.
Review interest coverage, earnings and operating cash flow.
Examine debt maturities and fixed-versus-variable interest rates.
Connect leverage with profitability and asset returns.
Finally, test whether weaker revenue or higher rates would make debt service difficult.
The objective is not merely to determine whether the ratio is high or low.
It is to understand whether the amount and structure of borrowing are appropriate for the assets, cash flows and risks of the business.
Frequently Asked Questions
What is the debt ratio?
The debt ratio is a leverage measure comparing qualifying debt with total assets.
What is the debt ratio formula?
Debt Ratio = Total Debt ÷ Total Assets
To express it as a percentage:
Debt Ratio % = Total Debt ÷ Total Assets × 100
What does a debt ratio of 50% mean?
It means qualifying debt equals approximately half of the company’s reported total assets under the calculation.
Is a high debt ratio bad?
Not automatically. Higher leverage generally increases financial risk, but sustainability depends on cash flow, profitability, interest rates, debt maturity, asset quality and industry structure.
Is a low debt ratio good?
It usually indicates lower reliance on borrowing, but low leverage alone does not prove that capital is being allocated efficiently.
What is a good debt ratio?
There is no universal ideal. Appropriate leverage depends on industry, cash-flow stability, asset structure, borrowing terms and financial risk.
Is debt ratio the same as debt-to-equity ratio?
No.
Debt Ratio = Debt ÷ Assets
Debt-to-Equity Ratio = Debt ÷ Equity
The denominators and interpretations differ.
Should total liabilities be used in the debt ratio?
Some sources use total liabilities divided by assets and call it a debt ratio. Others use interest-bearing debt. The definition should be stated clearly and kept consistent.
Can the debt ratio exceed 100%?
Yes, mathematically, when the debt amount used exceeds total reported assets. Such a result requires careful investigation.
Can a debt ratio be zero?
Yes. A company with no qualifying debt has a debt ratio of zero under that definition.
Does debt ratio measure liquidity?
No. Debt ratio measures leverage relative to assets. Current ratio, quick ratio, cash ratio and cash-flow analysis address liquidity more directly.
How can a company lower its debt ratio?
It can repay debt, increase its asset base without proportionate new borrowing, raise equity capital, retain profitable cash flows, or combine these actions.
Final Perspective
The debt ratio provides a compact measure of balance-sheet leverage:
Debt Ratio = Total Debt ÷ Total Assets
A 40% ratio means debt equals roughly 40% of the reported asset base under the chosen definition.
A 70% ratio means the business relies much more heavily on borrowed financing.
But the percentage alone cannot determine whether the debt is sustainable.
The same ratio can represent very different risk depending on interest costs, maturities, cash generation, asset quality, earnings stability and industry economics.
The first question should therefore be:
“How much debt do we have relative to assets?”
The more important questions follow:
“What does the debt cost? When does it mature? What cash flows support it? What happens if earnings weaken? Are the financed assets producing adequate returns?”
Those questions turn the debt ratio from a simple balance-sheet percentage into a meaningful measure of financial leverage and solvency.




