


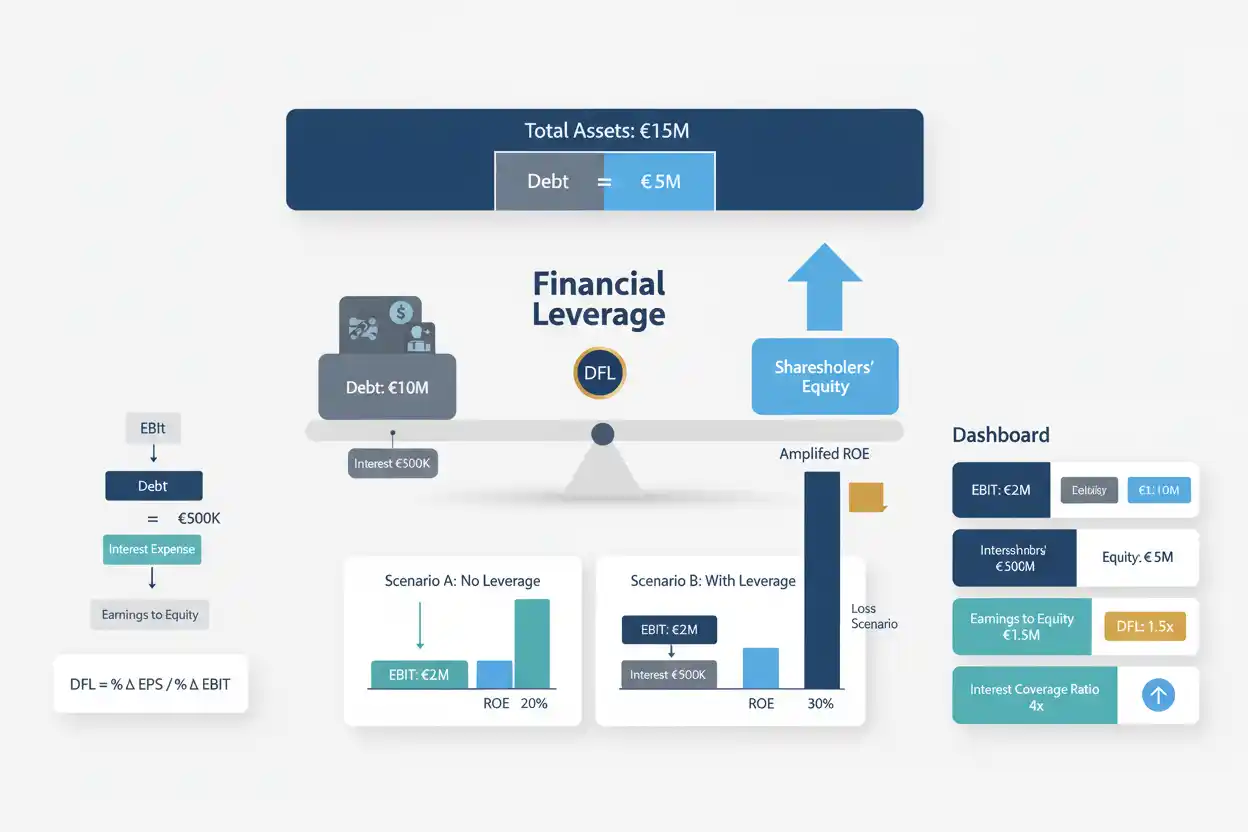
Financial leverage is the use of debt or other fixed-cost financing to increase the amount of assets or investment a company can control with a given amount of shareholder equity.
Leverage can magnify shareholder returns when the financed assets generate returns greater than their financing cost. It can also magnify losses when business performance weakens.
One common way to measure the earnings sensitivity created by financial leverage is the degree of financial leverage, or DFL:
Degree of Financial Leverage = % Change in EPS ÷ % Change in EBIT
For a simplified company with only interest as the relevant fixed financing cost:
DFL = EBIT ÷ (EBIT − Interest Expense)
Suppose EBIT is $1,000,000 and annual interest expense is $200,000.
DFL = $1,000,000 ÷ ($1,000,000 − $200,000)
DFL = $1,000,000 ÷ $800,000
DFL = 1.25
At that operating point, a 1% change in EBIT is associated with an approximately 1.25% change in the earnings measure after interest under the simplified model.
Financial leverage therefore concerns more than the amount of debt on a balance sheet. It also concerns how fixed financing obligations change the sensitivity of shareholder earnings.
Within business finance, financial leverage should be analyzed alongside debt levels, equity, operating profitability, interest coverage, cash flow and the returns generated by financed assets.
What Is Financial Leverage?
Financial leverage occurs when a business uses borrowed capital or another fixed financing commitment instead of relying entirely on shareholder equity.
Consider two companies that each control $10 million of assets.
Company A uses:
Equity = $10 million
Debt = $0
Company B uses:
Equity = $4 million
Debt = $6 million
Both control the same asset base, but Company B uses substantially more financial leverage.
If the assets perform well, Company B’s shareholders can earn a larger percentage return on their smaller equity investment.
If the assets perform poorly, losses also fall on a smaller equity cushion after creditor claims remain outstanding.
That is the essential leverage trade-off:
less equity can support more assets, but shareholder results become more sensitive to operating performance.
Financial Leverage Formula
There is no single formula that represents every meaning of financial leverage.
Different formulas answer different questions.
For earnings sensitivity:
DFL = % Change in EPS ÷ % Change in EBIT
For a simplified company:
DFL = EBIT ÷ (EBIT − Interest Expense)
For balance-sheet leverage, the equity multiplier provides another perspective:
Equity Multiplier = Total Assets ÷ Shareholders’ Equity
Meanwhile, debt relative to shareholder capital can be measured using the debt-to-equity ratio:
Debt-to-Equity Ratio = Debt ÷ Shareholders’ Equity
These formulas are related, but they are not interchangeable.
The appropriate measure depends on whether the analyst wants to understand capital structure, asset financing, or earnings sensitivity.
Degree of Financial Leverage Formula
The degree of financial leverage measures how strongly earnings available to equity respond to changes in operating earnings.
A general sensitivity expression is:
DFL = Percentage Change in EPS ÷ Percentage Change in EBIT
Suppose EBIT rises 10% and EPS rises 15%.
DFL = 15% ÷ 10%
DFL = 1.5
Shareholder earnings changed approximately 1.5 times as much as operating earnings.
The reason is that interest expense does not automatically rise and fall proportionately with EBIT.
Once the company pays its fixed financing cost, increases or decreases in EBIT have an amplified effect on what remains for shareholders.
Simplified DFL Formula Using EBIT
For a company whose relevant fixed financing charge is interest:
DFL = EBIT ÷ (EBIT − Interest Expense)
Since:
Earnings Before Tax = EBIT − Interest Expense
DFL can also be written:
DFL = EBIT ÷ Earnings Before Tax
Suppose:
EBIT = $750,000
Interest expense = $250,000
Then:
Earnings Before Tax = $750,000 − $250,000
= $500,000
DFL is:
DFL = $750,000 ÷ $500,000
DFL = 1.50
A 10% EBIT increase would therefore imply an approximately 15% increase in pre-tax earnings under the simplified constant-interest model.
Financial Leverage Example
Consider a business with $5 million available for investment.
Company A: No Debt
Equity financing = $5 million
Debt = $0
Operating return before interest = 12%
Operating earnings:
Operating Earnings = $5,000,000 × 12%
= $600,000
With no interest expense, the simplified pre-tax return on equity is:
$600,000 ÷ $5,000,000
= 12%
Company B: Uses Financial Leverage
Equity = $2 million
Debt = $3 million
Total investment = $5 million
Operating return = 12%
Interest rate on debt = 6%
Operating earnings remain:
$5,000,000 × 12% = $600,000
Interest expense is:
$3,000,000 × 6% = $180,000
Pre-tax earnings available after interest:
$600,000 − $180,000 = $420,000
Pre-tax return relative to equity:
$420,000 ÷ $2,000,000
= 21%
Company B’s shareholders earned a higher percentage return because borrowed capital generated returns above its financing cost.
That is positive financial leverage.
When Financial Leverage Works
Financial leverage can benefit shareholders when the economic return on financed assets exceeds the effective cost of financing.
Suppose a company borrows at 5% and invests the money in assets producing a sustainable 12% operating return.
The return spread before other considerations is positive.
Conceptually:
Positive Leverage Spread = Asset Return − Financing Cost
= 12% − 5%
= 7%
That spread can enhance shareholder returns.
However, taxes, fees, changing interest rates, capital expenditure, operating volatility, and other factors affect the actual result.
A positive spread should therefore be sustainable rather than assumed from one favorable period.
When Financial Leverage Hurts
Now suppose the same debt costs 6%, but the financed assets produce only a 3% operating return.
The spread becomes:
Leverage Spread = 3% − 6%
= −3%
Borrowed capital is earning less than its financing cost.
Leverage reduces shareholder economics rather than improving them.
This is sometimes described as negative financial leverage.
Increasing debt does not create value merely because more capital becomes available.
The financed investment must produce adequate returns.
Financial Leverage Magnifies Losses
The leverage mechanism becomes clearer during poor performance.
Suppose two investors each control $1 million of assets.
Investor A finances the assets entirely with $1 million of equity.
Investor B uses $400,000 of equity and $600,000 of debt.
The asset value falls by $100,000.
For Investor A:
Loss Relative to Equity = $100,000 ÷ $1,000,000
= 10%
For Investor B:
Loss Relative to Equity = $100,000 ÷ $400,000
= 25%
The economic asset loss is identical.
Its impact on shareholder capital is much larger when the equity cushion is smaller.
This is why leverage magnifies downside as well as upside.
Financial Leverage vs Operating Leverage
Financial leverage should not be confused with operating leverage.
Operating leverage comes from fixed operating costs.
Financial leverage comes from fixed financing costs.
Operating leverage asks:
How much does EBIT change when sales change?
Financial leverage asks:
How much do earnings available to shareholders change when EBIT changes?
A business can have high operating leverage and low financial leverage.
For example, it may own expensive fixed infrastructure but carry no debt.
Another company can have flexible operating costs while financing itself heavily with debt.
The two sources of leverage need separate analysis.
Financial Leverage vs Combined Leverage
The degree of combined leverage connects operating and financial leverage.
DCL = Degree of Operating Leverage × Degree of Financial Leverage
Conceptually:
Sales → Operating Leverage → EBIT → Financial Leverage → EPS
Operating leverage amplifies the movement from sales to EBIT.
Financial leverage amplifies the movement from EBIT to shareholder earnings.
Combined leverage measures both effects together.
The financial-leverage page owns the second stage rather than duplicating the complete combined-leverage framework.
Financial Leverage vs Equity Multiplier
The equity multiplier measures balance-sheet leverage:
Equity Multiplier = Assets ÷ Equity
Degree of financial leverage measures earnings sensitivity:
DFL = % Change in EPS ÷ % Change in EBIT
A company can therefore have a large equity multiplier but relatively modest DFL if much of its liability structure carries low financing costs.
Another business can have less balance-sheet leverage but high DFL because its EBIT is only slightly above interest expense.
The first metric describes how assets are financed.
The second describes how financing affects earnings sensitivity.
Financial Leverage vs Debt Ratio
The debt ratio measures debt relative to total assets.
Debt Ratio = Total Debt ÷ Total Assets
Financial leverage is broader.
Suppose two companies each have a 40% debt ratio.
Company A borrowed at low fixed rates.
Company B borrowed at high variable rates.
Their balance-sheet debt ratio is identical.
Their financing burden can differ substantially.
Financial leverage therefore requires both the amount and economic cost of debt to be understood.
Financial Leverage and Fixed Costs
The next article in the Finance sequence is dedicated to fixed costs.
Fixed financing costs such as interest differ from operating fixed costs such as rent, certain salaries, or committed infrastructure.
Both can increase earnings sensitivity, but they affect different stages of the income statement.
Operating fixed costs affect EBIT.
Interest affects earnings below EBIT.
Keeping those stages separate improves leverage analysis.
Financial Leverage and EBIT
EBIT is the central starting point for DFL.
Suppose:
EBIT = $1.2 million
Interest = $200,000
DFL = $1.2 million ÷ $1.0 million
= 1.20
Now EBIT falls to $400,000 while interest remains $200,000.
DFL = $400,000 ÷ $200,000
= 2.0
Financial leverage becomes much more sensitive as operating earnings approach the fixed interest burden.
The amount of debt did not need to change.
The earnings cushion became smaller.
Financial Leverage and EBITDA
EBITDA can provide operating earnings context, but the standard simplified DFL formula typically uses EBIT because depreciation and amortization remain expenses before interest within that model.
A company with substantial depreciation can therefore have high EBITDA while maintaining far less EBIT.
Suppose:
EBITDA = $5 million
Depreciation and amortization = $3 million
EBIT = $2 million
If annual interest expense is $1.2 million:
DFL = $2 million ÷ $800,000
= 2.5
Using EBITDA mechanically in place of EBIT would materially understate the earnings sensitivity in this example.
Financial Leverage and Interest Coverage
Interest coverage provides one of the most important companion ratios.
Interest Coverage = EBIT ÷ Interest Expense
Suppose:
EBIT = $1 million
Interest = $100,000
Interest Coverage = 10×
DFL is:
DFL = $1,000,000 ÷ $900,000
≈ 1.11
Now suppose interest remains $100,000 but EBIT falls to $150,000.
Interest Coverage = 1.5×
DFL becomes:
DFL = $150,000 ÷ $50,000
= 3.0
As interest coverage weakens, financial leverage sensitivity can rise dramatically.
Financial Break-Even Point
A company reaches a simplified financial break-even point when EBIT equals fixed financing costs such as interest.
Suppose interest expense is $500,000.
At:
EBIT = $500,000
pre-tax earnings after interest equal:
$500,000 − $500,000 = $0
The simplified DFL formula becomes:
DFL = $500,000 ÷ $0
The result is undefined.
That is not merely a mathematical inconvenience.
At zero earnings after interest, percentage changes become unstable because a small movement in EBIT can move the business from profit to loss or vice versa.
Financial Leverage Near Break-Even
Suppose EBIT is only $550,000 while interest is $500,000.
Earnings Before Tax = $50,000
DFL becomes:
DFL = $550,000 ÷ $50,000
= 11
A 1% change in EBIT can correspond with an approximately 11% change in pre-tax earnings under the simplified model.
This illustrates why leverage can become especially dangerous when operating earnings barely exceed financing obligations.
Financial Leverage and Return on Equity
Return on equity can increase when borrowed capital generates returns above its financing cost.
Suppose an unleveraged business earns 10% on $10 million of assets financed entirely with equity.
Net operating earnings before tax effects:
$10 million × 10% = $1 million
Simplified pre-tax ROE:
$1 million ÷ $10 million = 10%
Now suppose only $5 million is financed with equity and another $5 million with debt costing 4%.
Operating earnings remain $1 million.
Interest is:
$5 million × 4% = $200,000
Pre-tax earnings after interest:
$800,000
Relative to $5 million of equity:
$800,000 ÷ $5 million = 16%
Leverage increased the simplified shareholder return from 10% to 16%.
Financial Leverage Can Reduce ROE
The same structure hurts shareholders when asset returns fall below borrowing costs.
Using the $5 million debt and $5 million equity structure, suppose operating return falls to 2%.
Operating earnings:
$10 million × 2% = $200,000
Interest remains:
$200,000
Pre-tax earnings after interest:
$0
The unleveraged company would still have generated a positive 2% operating return.
The leveraged company produced no pre-tax earnings for equity under the simplified assumptions.
Leverage therefore enhances ROE only when financing economics cooperate.
Financial Leverage and Return on Assets
Return on assets measures profitability relative to assets.
Comparing ROA with financing costs helps explain whether leverage is productive.
If the return generated by assets persistently exceeds the effective cost of borrowing, leverage can support stronger equity economics.
If asset returns fall below financing costs, the leverage spread becomes unfavorable.
However, ROA definitions vary depending on the earnings numerator, so comparisons should use consistent measures.
Financial Leverage and Asset Turnover
Asset turnover explains how efficiently the financed asset base generates revenue.
Suppose a company borrows heavily to acquire assets.
If those assets remain underutilized, asset turnover can decline.
Debt and interest remain while the expected revenue fails to materialize.
Financial leverage becomes more difficult to justify.
Productive leverage requires productive assets.
Financial Leverage and Economic Value Added
Economic value added provides a stronger test than asking whether leverage increases accounting ROE.
A debt-funded investment can increase ROE while still failing to create enough return relative to the overall cost of capital.
EVA asks whether after-tax operating returns exceed the capital charge.
Therefore:
Higher leveraged ROE does not automatically mean greater economic value creation.
Leverage should support investments with attractive risk-adjusted returns rather than merely improving a headline shareholder ratio.
Financial Leverage and Return on Invested Capital
Return on invested capital evaluates returns generated on capital provided by both debt and equity investors.
This makes ROIC particularly relevant to leverage decisions.
Suppose a company raises more debt to invest in a new project.
If incremental ROIC exceeds the relevant capital cost, the investment may create value.
If incremental ROIC is poor, increasing leverage can magnify risk without improving the underlying economics.
The financing structure cannot rescue a fundamentally low-return investment indefinitely.
Financial Leverage and Return on Capital Employed
Return on capital employed provides another perspective on operating profitability relative to long-term capital.
A business can carry substantial financial leverage while still generating strong returns on capital employed.
Another can have identical leverage but weak operating returns.
Therefore, leverage should be evaluated together with capital productivity rather than in isolation.
Financial Leverage and Free Cash Flow
Free cash flow matters because lenders ultimately require cash payments.
High accounting earnings do not guarantee sufficient free cash flow.
Suppose a leveraged manufacturer reports strong EBIT but needs large recurring capital expenditure.
Cash remaining after investment can be much smaller than accounting profit suggests.
A sustainable leverage structure therefore depends on the amount and reliability of cash available after operating and capital needs.
Financial Leverage and Operating Cash Flow
Operating cash flow provides another debt-service perspective.
A company can report strong EBIT while customer receivables or inventory consume substantial cash.
Interest and principal still need to be funded according to their contractual terms.
Weak cash conversion can therefore turn apparently manageable leverage into a liquidity problem.
Financial Leverage and Cash Flow Forecasting
Cash flow forecasting adds the time dimension missing from leverage ratios.
Suppose the company has a moderate debt-to-equity ratio today.
A large principal payment is due in four months.
Neither D/E nor DFL tells management whether enough cash will actually exist on that date.
The cash forecast should include interest, principal, refinancing assumptions, operating receipts and other obligations.
Financial Leverage and Cash Runway
Cash runway can initially improve when a cash-consuming company raises debt.
Suppose available cash is $1 million and the company borrows another $2 million.
Liquidity increases immediately.
Yet interest and future principal repayment also increase.
Runway therefore should not be evaluated simply from the larger bank balance.
The financing obligations created by the debt belong in the future cash model.
Financial Leverage and Burn Rate
Burn rate can be financed temporarily with debt.
This can give a company more time to reach profitability or a financing milestone.
However, using borrowed money to fund persistent operating losses creates a fixed claim against uncertain future cash flows.
The strategy becomes increasingly risky when the business has no credible path to generating sufficient operating cash to service the debt.
Financial Leverage and Business Valuation
Business valuation often distinguishes enterprise value from equity value.
A simplified bridge is:
Equity Value = Enterprise Value − Relevant Net Debt
Suppose enterprise value equals $50 million and relevant net debt equals $15 million.
Equity Value ≈ $35 million
If enterprise value falls while debt remains fixed, equity value can decline much faster proportionately.
For example, enterprise value falls from $50 million to $35 million:
Equity Value = $35 million − $15 million
= $20 million
Enterprise value declined 30%.
Equity value fell from $35 million to $20 million—approximately 43%.
Leverage magnified the impact on shareholders.
Financial Leverage and Startup Valuation
A startup valuation can be affected by debt even when investors focus primarily on growth and equity financing.
Venture debt or other borrowing can extend runway without immediate ownership dilution.
However, debt remains a claim against company value.
A future equity investor therefore evaluates not only the enterprise economics but also the borrowing already outstanding.
Debt can preserve ownership percentages temporarily while reducing future financial flexibility.
Financial Leverage and Fixed vs Variable Interest Rates
The amount of debt alone does not determine leverage risk.
Interest-rate structure matters.
Suppose a company has $10 million of borrowing.
At 4% interest:
Annual Interest = $400,000
At 9%:
Annual Interest = $900,000
The debt balance is identical.
The fixed financing burden differs by $500,000 annually.
Variable-rate financing can therefore increase financial leverage sensitivity when market rates rise.
Financial Leverage and Debt Maturity
Two companies can carry identical debt balances and interest costs but face different refinancing risk.
Company A’s debt matures gradually over ten years.
Company B must repay or refinance most of its debt next quarter.
Their leverage ratios can look identical.
Their immediate financial risk does not.
Maturity schedules should therefore accompany leverage analysis.
Secured and Unsecured Debt
Collateral also affects financing risk and flexibility.
Secured debt gives lenders claims against specified assets or collateral under contractual arrangements.
Unsecured debt relies more broadly on the borrower’s credit and contractual promise.
A leverage ratio does not tell the analyst which structure exists.
The financing documents matter.
Financial Leverage and Covenants
Borrowing agreements can impose financial covenants or operating restrictions.
A business can therefore experience problems before it becomes unable to make an interest payment.
Potential restrictions can relate to additional debt, dividends, acquisitions, asset sales, leverage metrics, coverage ratios, or other contractual conditions.
The exact covenant definitions can differ significantly from generic accounting ratios.
A company can report a seemingly moderate debt ratio while approaching a stricter contractual leverage limit.
Financial Leverage and Tax Effects
Interest expense can affect taxable income in some circumstances, but tax treatment varies by jurisdiction and applicable rules.
Therefore, the effective after-tax cost of debt can differ from the nominal interest rate.
A simplified after-tax borrowing-cost formula often used in finance is:
After-Tax Cost of Debt = Interest Rate × (1 − Applicable Tax Rate)
If debt costs 6% and the simplified applicable tax rate is 25%:
After-Tax Cost of Debt = 6% × 75%
= 4.5%
Real tax outcomes can differ because deductions can be restricted or affected by company-specific circumstances.
Financial Leverage and Cost of Capital
Debt can sometimes reduce the weighted average financing cost because lenders typically accept different risk and return structures from equity investors.
However, excessive leverage increases financial risk.
As debt becomes more substantial, lenders can demand higher rates and shareholders can demand higher expected returns.
There is therefore no guarantee that continually adding debt reduces the overall cost of capital.
Capital structure needs to be optimized rather than maximized.
Financial Leverage and Share Repurchases
Companies can increase financial leverage through share repurchases.
Suppose a company uses debt to buy back shares.
Debt rises.
Equity can decline through the repurchase accounting effect.
The equity multiplier can increase, and debt-to-equity can rise.
Earnings per share may also increase if fewer shares remain outstanding and net income does not fall too much from additional interest.
However, the financial risk per remaining shareholder also increases.
Equity Financing vs Debt Financing
Equity financing and debt financing have different economic characteristics.
Equity generally does not require scheduled principal repayment.
However, issuing new shares dilutes existing ownership.
Debt avoids immediate ownership dilution but creates contractual payment obligations.
A company deciding between the two must consider financing cost, control, risk, cash-flow stability, maturity, taxes, growth opportunities and market conditions.
Financial leverage is therefore fundamentally a capital-structure decision.
Financial Leverage for Stable Businesses
Businesses with predictable cash flow can often support more leverage than highly volatile businesses.
For example, recurring contracted revenue can make future debt service easier to forecast.
However, stable revenue alone does not justify unlimited borrowing.
Capital expenditure, regulatory exposure, customer concentration, debt maturity and interest rates still matter.
Financial Leverage for Cyclical Businesses
Cyclical companies face greater risk because earnings can decline sharply during economic downturns.
Interest payments do not automatically decline when sales fall.
A leveraged cyclical company can therefore move from strong earnings to financial stress relatively quickly.
Management should model downside scenarios rather than relying solely on average-year profitability.
Financial Leverage for Startups
Early-stage companies often have uncertain operating cash flow.
That can make substantial debt particularly risky.
Borrowing may be appropriate for predictable assets, receivables, equipment, or companies with sufficient scale.
Yet financing ongoing uncertainty with fixed repayment obligations can reduce flexibility.
Startups should therefore connect leverage decisions directly with cash runway and expected milestone timing.
Financial Leverage for Asset-Intensive Companies
Capital-intensive businesses can use substantial debt because long-lived assets may generate cash flows over many years.
Factories, utilities, transportation fleets, infrastructure, and property can often support long-duration financing.
However, asset value is not enough.
The assets need to generate cash sufficient to service their financing.
Financial Leverage for Asset-Light Companies
An asset-light business may need less debt to expand.
However, high leverage can still arise from acquisitions, distributions, share repurchases, or operating losses that shrink equity.
Financial leverage therefore reflects capital structure rather than simply physical asset intensity.
How to Calculate Financial Leverage Step by Step
For earnings sensitivity, begin with EBIT and fixed financing cost.
Suppose:
EBIT = $900,000
Interest = $300,000
Calculate earnings before tax:
EBT = $900,000 − $300,000
EBT = $600,000
Then calculate DFL:
DFL = $900,000 ÷ $600,000
DFL = 1.50
Interpretation:
A 1% change in EBIT corresponds with approximately a 1.5% change in pre-tax earnings under the simplified assumptions.
Next, check balance-sheet leverage and cash-flow capacity rather than interpreting DFL alone.
Financial Leverage Scenario Analysis
Suppose:
Base EBIT = $1 million
Interest expense = $250,000
Base EBT:
$1,000,000 − $250,000 = $750,000
EBIT Rises 20%
New EBIT:
$1,000,000 × 1.20 = $1,200,000
New EBT:
$1,200,000 − $250,000 = $950,000
EBT increased:
($950,000 − $750,000) ÷ $750,000
≈ 26.7%
A 20% EBIT increase produced approximately 26.7% EBT growth.
EBIT Falls 20%
New EBIT:
$800,000
New EBT:
$800,000 − $250,000 = $550,000
Change:
($550,000 − $750,000) ÷ $750,000
≈ −26.7%
The financing structure amplified both movements.
High Financial Leverage
High financial leverage can result from large debt balances, substantial preferred financing commitments, high interest rates, low shareholder equity, or EBIT that is small relative to financing expense.
High leverage can boost returns during strong operating periods.
It also increases vulnerability to downturns, refinancing problems, interest-rate increases, covenant pressure and asset-value losses.
No single number defines universally high leverage.
Low Financial Leverage
Low financial leverage generally means shareholder earnings are less exposed to fixed financing obligations.
That can provide greater resilience during weak operating periods.
However, low leverage is not automatically optimal.
A stable company with profitable investment opportunities may choose to use appropriate borrowing rather than financing everything with expensive or dilutive equity.
The goal is not zero leverage.
The goal is sustainable leverage.
What Is a Good Financial Leverage Ratio?
There is no universal ideal.
A useful assessment considers:
the company’s industry,
earnings stability,
cash flow,
interest coverage,
debt maturity,
asset quality,
capital expenditure,
borrowing cost,
and return on invested capital.
A DFL of 2 can be manageable for one business and dangerous for another depending on how volatile EBIT is and how close the company sits to financial break-even.
Can Financial Leverage Be Zero?
If a business carries no fixed financing cost, the incremental financial leverage effect can effectively disappear.
Under the simplified DFL formula with zero interest:
DFL = EBIT ÷ EBIT
DFL = 1
A DFL of 1 means shareholder earnings move proportionately with EBIT before other effects.
Therefore, the sensitivity measure generally reaches 1, not zero, when no financial amplification exists.
Can DFL Be Below 1?
Under the standard simplified profitable-company model with positive EBIT and positive fixed interest expense below EBIT, DFL is normally greater than 1.
Unusual income structures, financing income, negative interest, losses, preferred dividends, or other nonstandard conditions can produce different mathematical results.
Such figures require direct examination rather than routine interpretation.
Can Financial Leverage Be Negative?
A negative DFL can occur mathematically when EBIT remains positive but earnings after fixed financing cost are negative.
Suppose:
EBIT = $400,000
Interest = $600,000
EBT = −$200,000
Then:
DFL = $400,000 ÷ −$200,000
= −2
Conventional percentage-sensitivity interpretation becomes difficult once the company is already below financial break-even.
The underlying loss position matters more than the ratio sign.
Financial Leverage Trend Analysis
Suppose DFL changes:
Year 1 = 1.15
Year 2 = 1.35
Year 3 = 2.10
Financial earnings sensitivity is increasing.
Possible causes include higher interest expense, new debt, higher rates, or weakening EBIT.
Now suppose DFL falls from 2.5 to 1.4.
Potential explanations include debt repayment, lower interest rates, or stronger operating earnings.
The trend should be decomposed rather than judged from direction alone.
How to Reduce Financial Leverage
A company can reduce financial leverage by repaying debt, refinancing expensive obligations, increasing equity, retaining profits, or improving EBIT relative to fixed financing costs.
Suppose EBIT remains unchanged while annual interest falls from $400,000 to $200,000.
At EBIT of $1 million:
Old DFL:
$1 million ÷ $600,000 ≈ 1.67
New DFL:
$1 million ÷ $800,000 = 1.25
Financial earnings sensitivity declines materially.
Improving EBIT Can Reduce DFL
A company does not necessarily need to repay debt to lower DFL.
Suppose interest remains $200,000.
At EBIT of $400,000:
DFL = $400,000 ÷ $200,000
= 2.0
If EBIT rises to $1 million:
DFL = $1,000,000 ÷ $800,000
= 1.25
The financing structure did not change.
The earnings cushion improved.
Should a Company Always Reduce Financial Leverage?
No.
Financial leverage can be economically beneficial when borrowing finances high-return investments at acceptable risk.
Eliminating all leverage can require additional equity and potentially increase dilution or reduce capital efficiency.
The better objective is a capital structure that can survive realistic downside scenarios while still funding productive investments.
Common Financial Leverage Mistakes
One mistake is treating financial leverage as synonymous with debt-to-equity.
Another is assuming a high equity multiplier automatically means high DFL.
Analysts can also focus on debt amount while ignoring interest rates and maturity.
A further mistake is concluding that leverage increased simply because DFL rose; DFL can also rise because EBIT deteriorated.
Treating leveraged ROE as proof of better underlying operations is another error.
Finally, DFL should not be treated as a permanent company characteristic. It changes with the operating earnings level.
Limitations of Financial Leverage Measures
No single leverage ratio captures the entire financing structure.
DFL does not show debt maturity.
Debt-to-equity does not show interest cost.
The equity multiplier includes liabilities beyond conventional borrowing.
Interest coverage does not identify capital expenditure.
Balance-sheet debt does not reveal future cash flow.
Accounting equity can also become very small or negative.
A robust analysis therefore combines several measures rather than ranking companies from one leverage number.
How to Analyze Financial Leverage Properly
Start with the capital structure.
Determine how much debt, equity, and other fixed financing exists.
Calculate debt-to-equity and debt-to-assets using consistent definitions.
Review the equity multiplier.
Then calculate EBIT and interest expense.
Use those figures to calculate interest coverage and degree of financial leverage.
Review debt maturity and fixed-versus-variable rates.
Examine operating and free cash flow.
Compare returns generated by financed assets with the cost of capital.
Run downside scenarios for lower sales and EBIT.
Finally, determine whether the business can meet financing obligations without sacrificing essential investment or becoming dependent on favorable refinancing conditions.
The goal is not to maximize leverage.
It is to use financing in a way that improves economic returns without creating a level of fixed financial risk the business cannot absorb.
Frequently Asked Questions
What is financial leverage?
Financial leverage is the use of debt or other fixed-cost financing to support a larger asset or investment base relative to shareholder equity.
What is the financial leverage formula?
Financial leverage can be measured in several ways. For earnings sensitivity:
DFL = % Change in EPS ÷ % Change in EBIT
A simplified form is:
DFL = EBIT ÷ (EBIT − Interest Expense)
What does DFL stand for?
DFL stands for degree of financial leverage.
What does a DFL of 2 mean?
A DFL of 2 means a 1% change in EBIT is associated with an approximately 2% change in the relevant earnings measure after fixed financing costs under the model.
Is higher financial leverage better?
Not automatically. Higher leverage can amplify shareholder gains when operating returns are strong and amplify losses when performance weakens.
What is positive financial leverage?
Positive leverage occurs when borrowed capital generates returns that exceed its financing cost sufficiently to improve shareholder economics.
What is negative financial leverage?
Negative leverage occurs when the financed investment generates inadequate returns relative to financing costs, reducing shareholder economics.
How is financial leverage different from operating leverage?
Operating leverage comes from fixed operating costs. Financial leverage comes from fixed financing costs such as interest.
What is the difference between financial leverage and debt-to-equity?
Debt-to-equity measures debt relative to shareholder equity. Financial leverage is the broader concept of using fixed-cost financing and can also be measured through earnings sensitivity.
How does financial leverage affect ROE?
When financed assets generate returns above financing costs, leverage can increase ROE because a larger asset base is supported by a smaller amount of equity. The effect reverses when returns are inadequate.
Why does DFL increase when EBIT falls?
Interest expense remains fixed in the simplified model, so a smaller EBIT cushion exists above the financing cost. Earnings after interest become more sensitive to further EBIT changes.
Can a company have financial leverage without a high debt ratio?
Yes. Different leverage measures capture different aspects of financing. Interest rates, fixed financing commitments, equity levels and operating earnings all influence financial leverage.
What is financial break-even?
Financial break-even occurs when operating earnings are just sufficient to cover fixed financing costs, leaving approximately zero earnings after those costs under the simplified model.
How can a company reduce financial leverage?
Debt repayment, lower financing costs, additional equity, retained profits, and stronger EBIT relative to fixed interest expense can all reduce financial leverage.
Final Perspective
Financial leverage changes the relationship between business performance and shareholder outcomes.
At its simplest, debt allows a company to control more assets without requiring an equivalent increase in shareholder equity.
When financed assets perform well, that structure can increase shareholder returns.
When they perform poorly, losses become concentrated on a smaller equity base while lenders retain contractual claims.
The earnings-sensitivity relationship can be expressed as:
DFL = % Change in EPS ÷ % Change in EBIT
or, in a simplified structure:
DFL = EBIT ÷ (EBIT − Interest Expense)
The closer EBIT moves toward fixed financing costs, the more sensitive shareholder earnings can become.
That is why leverage cannot be evaluated from debt balances alone.
A complete analysis asks:
What does the financing cost? When does the debt mature? How stable is EBIT? What returns are the financed assets producing? How strong is interest coverage? How much free cash flow exists? And what happens to shareholders if operating performance weakens?
Financial leverage creates value only when the benefits of additional capital exceed both its explicit financing cost and the additional risk it imposes on the business.




