


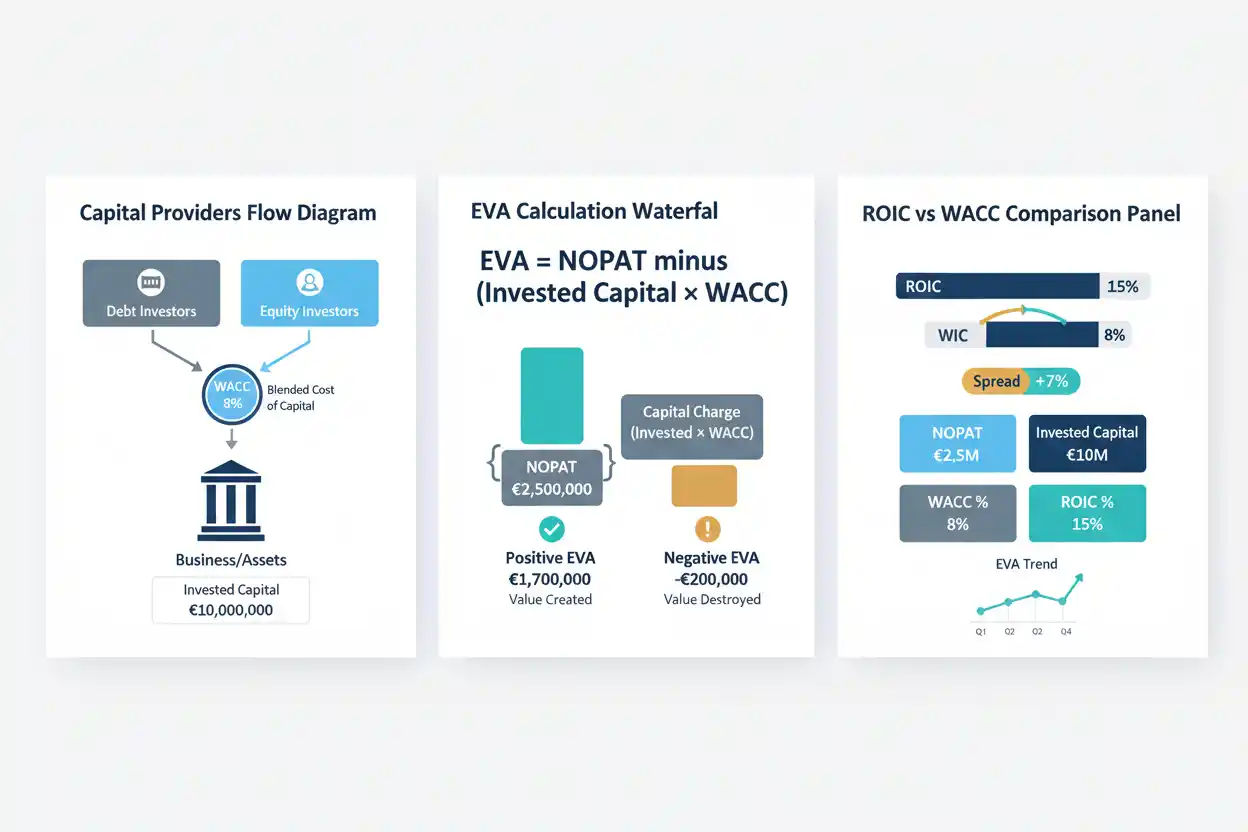
Economic value added, commonly abbreviated EVA, measures whether a business generates enough after-tax operating profit to cover the cost of the capital invested in it.
The core formula is:
Economic Value Added = NOPAT − Capital Charge
The capital charge is:
Capital Charge = Invested Capital × Cost of Capital
Therefore:
EVA = NOPAT − (Invested Capital × WACC)
This formulation is also found in SEC-filed compensation plans and corporate disclosures, which define economic value added as net operating profit after tax less a charge for the capital employed.
Suppose a business has:
NOPAT = $2,000,000
Invested capital = $15,000,000
Weighted average cost of capital = 8%
Its capital charge is:
Capital Charge = $15,000,000 × 8%
Capital Charge = $1,200,000
Economic value added is:
EVA = $2,000,000 − $1,200,000
EVA = $800,000
The company generated $800,000 more operating profit after tax than the modeled return required by its capital providers.
That distinction separates EVA from ordinary accounting profit.
A business can report positive EBIT, positive EBITDA, and positive net income while still producing negative economic value added if its operating returns fail to cover the cost of the capital committed to the business.
What Is Economic Value Added?
Economic value added is an economic-profit measure.
Traditional accounting profit deducts operating expenses, financing costs, taxes, and other applicable accounting items depending on the profit measure being used.
EVA introduces an additional concept:
Equity and debt capital both have an economic cost.
Lenders normally require interest.
Equity investors also require an expected return for committing capital and accepting risk, even though that required return does not appear as a conventional expense on the income statement.
Economic value added attempts to recognize both.
The measure therefore asks:
After generating operating profit and paying operating taxes, did the business earn more than the required return on the capital invested in it?
Positive EVA indicates the modeled operating return exceeded the capital charge.
Negative EVA indicates it did not.
Economic Value Added Formula
The standard conceptual formula is:
EVA = NOPAT − (Invested Capital × WACC)
where:
NOPAT = Net Operating Profit After Tax
Invested Capital = Capital committed to business operations under the selected definition
WACC = Weighted Average Cost of Capital
The second part of the equation is the capital charge:
Capital Charge = Invested Capital × WACC
Then:
EVA = NOPAT − Capital Charge
A 2026 SEC-filed incentive plan describes economic value added using essentially this relationship: net operating profit after tax minus capital multiplied by the cost of capital.
Economic Value Added Example
Consider a company with:
EBIT = $4,000,000
Operating tax rate = 25%
Invested capital = $25,000,000
WACC = 10%
First calculate NOPAT:
NOPAT = EBIT × (1 − Tax Rate)
NOPAT = $4,000,000 × (1 − 0.25)
NOPAT = $3,000,000
Now calculate the capital charge:
Capital Charge = $25,000,000 × 10%
Capital Charge = $2,500,000
Finally:
EVA = $3,000,000 − $2,500,000
EVA = $500,000
The company created approximately $500,000 of economic value under the assumptions used.
It generated $3 million of after-tax operating profit while investors required an estimated $2.5 million return on the $25 million of capital committed.
What Is NOPAT?
NOPAT means net operating profit after tax.
It attempts to measure after-tax operating profit independently of the company’s financing mix.
A simplified formula is:
NOPAT = EBIT × (1 − Operating Tax Rate)
Suppose EBIT is $5 million and the applicable operating tax rate is 24%.
NOPAT = $5,000,000 × 76%
NOPAT = $3,800,000
NOPAT differs from net income because interest expense is generally not deducted before arriving at operating profit for this purpose.
That matters because EVA compares operating performance with a capital charge that already reflects the required returns of debt and equity capital providers.
Current SEC filings also use NOPAT in return-on-invested-capital calculations, confirming its continuing role in capital-efficiency analysis.
NOPAT vs Net Income
Net income is measured after financing effects such as interest.
NOPAT attempts to represent after-tax operating profit before the financing structure divides returns among capital providers.
Suppose:
EBIT = $2,000,000
Interest expense = $500,000
Tax rate = 25%
Simplified NOPAT:
NOPAT = $2,000,000 × 75%
NOPAT = $1,500,000
Pre-tax income after interest:
Pre-Tax Income = $2,000,000 − $500,000
Pre-Tax Income = $1,500,000
Simplified net income:
Net Income = $1,500,000 × 75%
Net Income = $1,125,000
NOPAT is higher because the operating calculation does not deduct financing interest.
This makes NOPAT conceptually compatible with a return on capital funded by both lenders and shareholders.
What Is Invested Capital?
Invested capital represents the capital committed to operating assets under the methodology used.
A financing-based approach may begin with interest-bearing debt and shareholder equity.
A simplified formula is:
Invested Capital = Interest-Bearing Debt + Shareholders’ Equity − Non-Operating Cash Adjustments
An operating approach can instead begin with operating assets and subtract non-interest-bearing operating liabilities.
The exact calculation varies among analytical systems and companies.
That variation matters.
SEC-filed companies using ROIC sometimes define invested capital using debt plus equity, while others make additional adjustments for leases, deferred taxes, cash, acquisitions, or other balance-sheet items.
Therefore, EVA should never be compared across companies without first checking how invested capital was defined.
Why Average Invested Capital Can Be Useful
NOPAT covers a period.
Invested capital is a balance-sheet amount measured at a point in time.
Using an average can better match the capital employed throughout the period.
A simple average is:
Average Invested Capital = (Beginning Invested Capital + Ending Invested Capital) ÷ 2
Suppose beginning invested capital is $18 million and ending invested capital is $22 million.
Average Invested Capital = ($18,000,000 + $22,000,000) ÷ 2
Average Invested Capital = $20,000,000
If NOPAT is $2.4 million:
ROIC = $2,400,000 ÷ $20,000,000
ROIC = 12%
Using average capital can be particularly useful when acquisitions, debt repayment, investment programs, or rapid growth materially change the balance sheet during the year.
What Is the Capital Charge?
The capital charge represents the modeled required dollar return on invested capital.
Capital Charge = Invested Capital × Cost of Capital
Suppose:
Invested capital = $40 million
WACC = 9%
Capital Charge = $40,000,000 × 9%
Capital Charge = $3,600,000
The company needs more than $3.6 million of NOPAT to produce positive EVA under this model.
If NOPAT equals exactly $3.6 million:
EVA = $3,600,000 − $3,600,000
EVA = $0
The business generated exactly the modeled required return.
Accounting profit exists, but no economic profit exists beyond the assumed cost of capital.
What Is WACC?
WACC means weighted average cost of capital.
It combines the required cost of equity and the after-tax cost of debt according to their weighting in the selected capital structure.
A simplified formula is:
WACC = (Equity Weight × Cost of Equity) + (Debt Weight × After-Tax Cost of Debt)
Current SEC filings describe WACC in the same broad manner, using weighted cost of equity and after-tax cost of debt components.
Suppose a company uses:
60% equity
40% debt
Cost of equity = 11%
After-tax cost of debt = 5%
Then:
WACC = (60% × 11%) + (40% × 5%)
WACC = 6.6% + 2.0%
WACC = 8.6%
If invested capital is $20 million:
Capital Charge = $20,000,000 × 8.6%
Capital Charge = $1,720,000
NOPAT needs to exceed $1.72 million for EVA to be positive under these assumptions.
Positive Economic Value Added
Positive EVA means:
NOPAT > Capital Charge
Suppose:
NOPAT = $5 million
Capital charge = $4 million
EVA = $1 million
The business generated operating profit after tax exceeding the required return on invested capital by approximately $1 million.
Positive EVA suggests economic value creation within the model.
However, the result depends heavily on the accuracy of NOPAT, invested-capital, and cost-of-capital assumptions.
A positive number calculated from an unrealistically low WACC can overstate economic performance.
Negative Economic Value Added
Negative EVA means:
NOPAT < Capital Charge
Suppose:
NOPAT = $2.5 million
Capital charge = $3.2 million
EVA = −$700,000
The business produced accounting operating profit, but that return did not cover the modeled cost of capital.
This is an important distinction.
Negative EVA does not necessarily mean the company has an accounting loss.
It means the return generated after operating tax was below the required return on the invested capital under the model.
Zero Economic Value Added
Zero EVA occurs when:
NOPAT = Invested Capital × WACC
That is equivalent to:
ROIC = WACC
The company earns exactly its required cost of capital.
In economic-profit terms, it neither creates nor destroys value relative to the modeled required return.
Shareholders can still receive an accounting profit.
The point is that the profit is exactly what capital providers were assumed to require for the amount of capital and risk involved.
EVA and Return on Invested Capital
Economic value added has a direct mathematical relationship with return on invested capital.
ROIC = NOPAT ÷ Invested Capital
Rearrange:
NOPAT = ROIC × Invested Capital
Substitute into the EVA formula:
EVA = (ROIC × Invested Capital) − (WACC × Invested Capital)
Factor invested capital:
EVA = (ROIC − WACC) × Invested Capital
This is one of the clearest ways to understand economic value added.
The difference between ROIC and WACC is the value-creation spread.
EVA Using ROIC Spread
Suppose:
ROIC = 14%
WACC = 9%
Invested capital = $30 million
ROIC spread:
ROIC Spread = 14% − 9%
ROIC Spread = 5%
Economic value added:
EVA = 5% × $30,000,000
EVA = $1,500,000
The company generated $1.5 million of economic profit above the modeled capital requirement.
If ROIC were only 7%:
EVA = (7% − 9%) × $30,000,000
EVA = −$600,000
The same company would destroy $600,000 of economic value under the model.
Why ROIC Greater Than WACC Matters
The relationship is direct:
If:
ROIC > WACC
then:
EVA > 0
If:
ROIC = WACC
then:
EVA = 0
If:
ROIC < WACC
then:
EVA < 0
This relationship explains why revenue growth alone does not guarantee value creation.
A company can grow rapidly while investing capital at returns below its cost.
In that situation, expansion can increase accounting profit while reducing economic value.
Growth Can Destroy Economic Value
Suppose a company currently has:
Invested capital = $20 million
ROIC = 12%
WACC = 9%
Current EVA:
EVA = (12% − 9%) × $20 million
EVA = $600,000
Management then invests another $10 million in a project expected to earn only 6%.
Incremental EVA:
Incremental EVA = (6% − 9%) × $10 million
Incremental EVA = −$300,000
The project increases revenue and may even increase reported operating profit.
Yet it reduces economic value because its 6% return is below the 9% required return.
Growth is therefore valuable only when the economics of incremental investment are attractive.
Growth Can Increase EVA
Now assume the $10 million expansion produces a 15% return.
Incremental EVA = (15% − 9%) × $10 million
Incremental EVA = $600,000
The expansion creates another $600,000 of annual economic value under the model.
This is the fundamental capital-allocation principle behind EVA:
Growth should be judged by returns relative to the cost of the capital required to produce it.
EVA vs EBIT
EBIT measures earnings before interest and taxes.
Economic value added goes further.
First, EBIT is converted toward an after-tax operating measure such as NOPAT.
Then the cost of invested capital is deducted.
Suppose:
EBIT = $4 million
NOPAT = $3 million
Capital charge = $2.2 million
EVA = $800,000
EBIT tells us the operating earnings before interest and tax.
EVA asks whether the after-tax operating earnings are sufficient relative to the capital committed.
EVA vs EBITDA
EBITDA excludes interest, tax, depreciation, and amortization.
Economic value added addresses a different question.
A capital-intensive company can produce high EBITDA while earning inadequate returns on the enormous asset base required to generate those earnings.
Suppose:
Company A EBITDA = $20 million
Invested capital = $300 million
Company B EBITDA = $10 million
Invested capital = $40 million
EBITDA alone makes Company A appear much larger.
EVA can reveal whether either business earns enough after-tax operating return relative to its required capital.
EVA vs Net Income
Net income represents accounting earnings attributable after financing and tax effects under the applicable reporting structure.
EVA subtracts an economic capital charge that accounting net income does not explicitly recognize for shareholder equity.
Suppose a company earns $5 million of net income but has $100 million of capital requiring an estimated 8% return.
The required return is substantial.
The existence of positive net income therefore does not prove economic value creation.
That is the analytical gap EVA attempts to address.
EVA vs Operating Profit
Operating margin and operating profit focus on income generated from business operations.
EVA incorporates capital intensity.
Suppose two companies each produce $10 million of operating profit.
Company A requires $40 million of invested capital.
Company B requires $200 million.
Identical operating profit does not mean identical economic efficiency.
The amount of capital needed to produce that profit changes the value-creation question.
EVA vs Gross Margin
Gross margin measures gross profit relative to revenue.
A high gross margin can be economically attractive, but it does not account for the capital required to operate the business.
A company can earn strong gross margins while maintaining large inventories, expensive facilities, substantial receivables, or costly technology infrastructure.
Economic value added forces the analysis beyond margins toward capital productivity.
EVA vs Net Profit Margin
Net profit margin measures net income relative to revenue.
It answers:
How much bottom-line accounting profit does the company earn per dollar of revenue?
EVA asks:
Does the after-tax operating profit exceed the required return on the capital supporting those operations?
A company can therefore report an excellent net margin and weak EVA if its capital requirements are unusually high.
EVA and Asset Turnover
Asset turnover helps explain one path to stronger economic value.
A business can improve capital productivity by generating more sales from its asset base.
Suppose revenue stays constant while unnecessary inventory, receivables, or unproductive assets are reduced.
The company can potentially maintain operating profit with less invested capital.
The capital charge falls.
EVA can increase even if revenue does not.
This is why capital efficiency matters alongside margin improvement.
EVA and Return on Assets
Return on assets relates earnings to the asset base.
EVA adds a required-return threshold.
A positive ROA is not sufficient for positive economic value creation.
If the return generated by operating assets is below the cost of capital, economic profit can remain negative.
The distinction is similar to the difference between earning a return and earning an adequate risk-adjusted return.
EVA and Return on Equity
Return on equity measures profitability relative to shareholder equity.
EVA considers both debt and equity capital within the broader invested-capital framework.
A leveraged business can generate high ROE because shareholder equity is relatively small.
If the underlying return on total invested capital remains weak, high ROE alone can give an incomplete picture.
That makes debt-to-equity ratio and broader leverage context important when interpreting shareholder returns.
EVA and Debt
Debt influences EVA mainly through the cost-of-capital framework rather than by simply deducting interest from NOPAT.
Debt financing contributes to invested capital.
The after-tax cost of debt contributes to WACC.
This helps avoid double-counting financing expense when NOPAT is calculated before interest.
The debt ratio therefore answers how much debt the company uses, while EVA asks whether operations generate sufficient return on the total capital employed.
EVA and Financial Leverage
Financial leverage can improve shareholder returns when borrowed capital is invested productively.
However, more leverage does not automatically increase economic value.
Suppose a business borrows at 6% to finance a project earning only 5% after relevant operating tax effects.
The project can increase assets and revenue while producing inadequate economic returns.
Financial structure cannot permanently compensate for poor investment economics.
EVA and the Equity Multiplier
The equity multiplier measures the relationship between total assets and shareholder equity.
A higher multiplier generally indicates that a larger portion of assets is financed through liabilities relative to equity.
EVA approaches the issue differently.
Rather than focusing primarily on financing proportions, it evaluates the required return on the combined capital used by the business.
The two metrics therefore complement one another without measuring the same thing.
EVA and Interest Coverage
Interest coverage asks whether earnings can cover interest expense.
EVA asks whether after-tax operating returns cover the required return on all invested capital.
A company can have excellent interest coverage because its debt burden is small while still generating weak economic returns for equity holders.
Likewise, a leveraged company can produce positive EVA while carrying significant debt if its operating returns remain high enough.
Debt-service capacity and value creation are related but separate.
EVA and Free Cash Flow
Free cash flow measures cash remaining after specified operating and capital requirements.
EVA measures economic profit after a capital charge.
The metrics approach value from different directions.
A company can produce strong EVA but temporary weak free cash flow because it is investing heavily in attractive high-return growth projects.
Conversely, a declining company can generate positive short-term free cash flow by reducing investment even while its long-term economic position deteriorates.
Neither measure should automatically replace the other.
EVA and Operating Cash Flow
Operating cash flow measures operating cash generation.
NOPAT is an accounting operating-profit concept.
Changes in receivables, inventory, payables, depreciation, and other items can cause operating cash flow to diverge from NOPAT.
A company reporting positive EVA should therefore still be examined for cash conversion.
Economic profitability does not eliminate liquidity risk.
EVA and Working Capital
Working capital can materially influence invested capital.
Suppose a company carries $5 million more inventory than necessary.
If operations can continue without that excess inventory, reducing it can lower capital employed.
At an 8% WACC:
Annual Capital Charge on $5 Million = $5,000,000 × 8%
= $400,000
Releasing unnecessary capital can therefore increase EVA by reducing the capital charge, assuming NOPAT is preserved.
This is one reason operational working-capital improvements can create economic value.
EVA and the Cash Conversion Cycle
The cash conversion cycle provides a practical route to improving capital efficiency.
Reducing unnecessary inventory days or accelerating receivable collection can reduce the amount of operating capital tied up in the business.
Extending supplier terms appropriately can provide additional operating financing.
If those changes reduce invested capital without harming NOPAT, EVA can improve.
Working-capital management therefore affects more than liquidity. It can affect the economic cost of operating the business.
EVA and Days Sales Outstanding
Suppose days sales outstanding falls substantially because customers pay faster.
Average receivables decline.
If revenue and operating profit remain stable, the company can operate with less capital tied up in accounts receivable.
Lower invested capital reduces the capital charge.
That can increase EVA without increasing sales.
EVA and Days Inventory Outstanding
The same logic applies to days inventory outstanding.
Excess inventory consumes capital.
If inventory can be reduced without creating stockouts or harming sales, invested capital falls.
Suppose $2 million of unnecessary inventory is removed and WACC is 10%.
Capital Charge Reduction = $2,000,000 × 10%
Capital Charge Reduction = $200,000
All else equal, EVA can increase approximately $200,000.
EVA and Days Payable Outstanding
Days payable outstanding can affect the amount of operating capital funded by suppliers.
Appropriately negotiated supplier credit can reduce the company’s need for investor-provided capital.
However, extending payment beyond contractual terms can damage supplier relationships and create other costs.
The objective is not to maximize payables mechanically.
It is to finance operations efficiently without destroying commercial value elsewhere.
EVA and Cash Flow Forecasting
Cash flow forecasting helps determine whether value-creating investments are financially feasible.
A project can have positive expected EVA and still create a near-term liquidity problem if large cash outflows occur before economic returns arrive.
Management therefore needs both questions answered:
Does the investment create economic value?
and:
Can the company finance it through the period before that value converts into cash?
EVA and Burn Rate
For early-stage businesses, burn rate can remain high while management invests in growth.
Negative current EVA is not automatically proof that such investment should stop.
A new project can produce weak returns initially while building assets expected to generate attractive future returns.
However, persistent negative EVA eventually raises the question of whether capital is being invested at economically inadequate returns.
The business should separate temporary investment from structural value destruction.
EVA and Cash Runway
Cash runway asks how long available liquidity can support current cash consumption.
Economic value added asks whether operations generate returns above the cost of invested capital.
A startup can therefore have negative current EVA but substantial runway.
Another business can generate positive EVA while facing a near-term cash shortage because debt or working-capital obligations are due.
Profitability, economic value, and liquidity must remain analytically separate.
EVA and Business Valuation
Business valuation and economic value added are closely connected conceptually.
A business creates value when it can invest capital at returns above the required rate.
If a company can generate positive EVA sustainably and reinvest at attractive incremental returns, those economics can support a higher enterprise value.
However, one year’s EVA should not be capitalized mechanically.
Future competitive conditions, growth, reinvestment requirements, risk, and duration of excess returns matter.
EVA and Enterprise Value
Economic-profit valuation can be expressed conceptually as the value of invested capital plus the present value of expected future economic profits.
In simplified conceptual form:
Enterprise Value ≈ Invested Capital + Present Value of Future EVA
This relationship helps explain why businesses can be worth more than the accounting capital invested in them.
Investors may expect the company to generate future returns above the cost of capital.
If expected EVA is persistently negative, the economic value of the business can fall below the amount historically invested.
Actual valuation requires detailed forecasting and discounting rather than simply adding one year’s EVA.
EVA and Capital Allocation
Economic value added becomes particularly useful when evaluating competing investment opportunities.
Suppose Project A requires $10 million of capital and is expected to earn 14%.
Project B also requires $10 million but is expected to earn 8%.
Company WACC is 10%.
Project A:
Expected EVA = (14% − 10%) × $10 million
Expected EVA = $400,000
Project B:
Expected EVA = (8% − 10%) × $10 million
Expected EVA = −$200,000
Both projects can produce positive operating profit.
Only Project A exceeds the modeled required return.
EVA and Acquisitions
Acquisitions can increase revenue, EBITDA, and EBIT while reducing economic value if the purchase price requires too much invested capital relative to the earnings acquired.
Suppose an acquisition requires $100 million of incremental invested capital.
Expected incremental NOPAT is $7 million.
If WACC is 9%:
Capital Charge = $100 million × 9%
Capital Charge = $9 million
Incremental EVA = $7 million − $9 million
Incremental EVA = −$2 million
The acquisition increases operating profit but fails the economic-profit test under these assumptions.
Purchase price therefore matters as much as the quality of the acquired business.
EVA and Asset Sales
Selling unproductive assets can improve EVA when the capital released exceeds the NOPAT lost.
Suppose an asset ties up $5 million of invested capital and generates only $200,000 of NOPAT.
At a 10% cost of capital:
Capital Charge = $500,000
Asset EVA = $200,000 − $500,000
Asset EVA = −$300,000
If that asset can be sold near its economic value without harming more profitable operations, removing it can improve company-wide value creation.
EVA and Pricing
Pricing changes can affect NOPAT and therefore EVA.
Suppose a business increases price without materially reducing volume.
Contribution and EBIT rise.
NOPAT increases.
If no additional capital is needed, much of the incremental after-tax operating profit can increase EVA.
However, aggressive price increases can reduce demand or require additional customer-acquisition spending.
EVA analysis should therefore evaluate the full operating consequence rather than price in isolation.
EVA and Contribution Margin
Contribution margin helps explain how incremental revenue becomes operating profit.
Suppose a new product requires little additional invested capital and produces strong contribution.
After fixed costs and tax, the resulting NOPAT can increase more than the associated capital charge.
That creates positive incremental EVA.
A high-contribution product requiring enormous new facilities and working capital may produce different economics.
EVA and Break-Even Analysis
Break-even analysis determines the sales level required to cover accounting fixed operating costs under its model.
EVA sets a higher threshold.
Accounting break-even occurs around zero operating profit.
Economic break-even requires enough profit to cover the capital charge as well.
Therefore, a company can be above accounting break-even while remaining below economic break-even.
Economic Break-Even Example
Suppose:
Fixed operating costs = $1 million
Required annual capital charge = $500,000
Contribution margin ratio = 30%
Accounting break-even revenue:
Accounting Break-Even Revenue = $1,000,000 ÷ 30%
≈ $3,333,333
Ignoring tax complications for this simplified example, an economic-profit target must also cover the capital charge:
Economic Cost Requirement = $1,000,000 + $500,000
= $1,500,000
Economic break-even revenue:
Economic Break-Even Revenue = $1,500,000 ÷ 30%
= $5,000,000
A company can therefore cover its accounting operating costs before it creates economic value.
EVA and Performance Measurement
Economic value added can help discourage managers from focusing only on profit growth.
Suppose a division increases profit by $1 million but requires another $20 million of capital.
At an 8% capital cost:
Additional Capital Charge = $20 million × 8%
= $1.6 million
The division increased accounting profit but reduced EVA by $600,000.
SEC-filed compensation plans have used economic value added or related capital-return measures precisely because they incorporate the cost of capital into performance assessment.
How to Increase Economic Value Added
There are three broad ways to increase EVA.
First, increase NOPAT without requiring proportional additional capital.
Second, reduce capital tied up in operations without materially damaging NOPAT.
Third, invest new capital only when its expected return exceeds the relevant cost of capital.
These routes can involve stronger pricing, higher contribution margins, better asset utilization, lower unnecessary working capital, disposal of weak assets, disciplined acquisitions, or higher-return growth.
The underlying principle remains the same:
Improve the spread between operating returns and capital cost.
Increasing EVA Through Higher NOPAT
Suppose invested capital remains $20 million and WACC remains 8%.
Current NOPAT = $2 million.
Current EVA = $2 million − ($20 million × 8%)
Current EVA = $400,000
NOPAT increases to $2.5 million without additional capital.
New EVA = $2.5 million − $1.6 million
New EVA = $900,000
EVA increased by $500,000.
Operational improvement created additional economic profit without requiring more investor capital.
Increasing EVA Through Lower Invested Capital
Suppose:
NOPAT = $2 million
Invested capital = $20 million
WACC = 8%
EVA = $2 million − $1.6 million
EVA = $400,000
Management releases $4 million from unnecessary working capital while maintaining NOPAT.
New invested capital = $16 million.
New Capital Charge = $16 million × 8%
= $1.28 million
New EVA = $2 million − $1.28 million
New EVA = $720,000
EVA rises even though accounting operating profit remains unchanged.
Increasing EVA Through High-Return Investment
Suppose a company invests another $5 million.
The investment generates $700,000 of incremental NOPAT.
Incremental ROIC:
Incremental ROIC = $700,000 ÷ $5,000,000
= 14%
If WACC is 9%:
Incremental EVA = (14% − 9%) × $5 million
= $250,000
Growth created value because the incremental return exceeded the required return.
When Cutting Capital Can Reduce EVA
Reducing invested capital is not automatically beneficial.
Suppose a company reduces inventory aggressively.
Capital falls by $2 million, saving a 10% capital charge:
Capital Charge Saving = $200,000
However, stockouts cause NOPAT to fall by $500,000.
Net EVA change:
EVA Change = $200,000 − $500,000
EVA Change = −$300,000
Capital efficiency improved superficially, but economic value deteriorated.
The objective is not minimum capital.
It is optimal productive capital.
EVA Sensitivity to WACC
Economic value added can change significantly when the estimated cost of capital changes.
Suppose:
NOPAT = $5 million
Invested capital = $40 million
At 8% WACC:
EVA = $5 million − ($40 million × 8%)
EVA = $1.8 million
At 11% WACC:
EVA = $5 million − ($40 million × 11%)
EVA = $600,000
Operating performance did not change.
The modeled required return increased, reducing EVA by $1.2 million.
This sensitivity is one reason WACC assumptions should be stated clearly rather than hidden inside the calculation.
EVA Sensitivity to Invested Capital
Suppose NOPAT and WACC stay constant:
NOPAT = $3 million
WACC = 10%
At $20 million of capital:
EVA = $3 million − $2 million
EVA = $1 million
At $28 million of capital:
EVA = $3 million − $2.8 million
EVA = $200,000
If the additional $8 million fails to increase NOPAT, most of the company’s economic value disappears.
Capital growth without corresponding operating return can therefore weaken EVA quickly.
Is Higher EVA Always Better?
Generally, higher sustainable EVA indicates stronger economic value creation under a consistent methodology.
However, comparisons require care.
A large company will naturally have the potential to generate more dollar EVA than a small company.
A $5 billion business producing $20 million of EVA and a $20 million business producing $2 million should not be ranked solely by the dollar amount.
ROIC spread and EVA relative to invested capital can provide additional context.
The sustainability of the result also matters.
One-time asset sales or unusually favorable tax effects should not be mistaken for permanent operating improvement.
Can EVA Be Negative While Revenue Grows?
Yes.
Suppose revenue rises rapidly because the company invests heavily in expansion.
If incremental returns remain below WACC, economic value added can decline.
This is one of EVA’s most useful insights.
Revenue growth answers:
Is the business getting larger?
EVA answers:
Is that growth producing enough return for the capital required?
Those are not the same question.
Can EVA Be Positive With Declining Revenue?
Yes.
A business can reduce low-return sales, eliminate unproductive assets, improve pricing, release working capital, and increase NOPAT efficiency.
Revenue can decline while the ROIC spread improves.
If economic profit rises, the smaller business can become more valuable.
Growth should therefore be evaluated economically rather than celebrated automatically.
Is EVA the Same as Economic Profit?
Economic value added is commonly used as a structured form of economic profit:
Economic Profit = Operating Profit After Tax − Capital Charge
Terminology and detailed adjustments can differ among analytical systems.
The essential idea is that accounting profit must exceed the required return on invested capital before true economic profit is created.
Is EVA a GAAP Measure?
Economic value added is not a standard GAAP income-statement subtotal.
Its inputs can include non-GAAP or management-defined adjustments, particularly for NOPAT and invested capital.
Current SEC filings similarly identify related ROIC and NOPAT measures as non-GAAP when companies calculate adjusted versions.
Therefore, company-specific EVA figures should be reconciled carefully rather than assumed to be perfectly comparable.
Accounting Adjustments in EVA
More sophisticated EVA systems can adjust reported accounting numbers to better represent operating economics.
Possible areas include:
Research and development
Acquisition-related items
Operating leases
Goodwill
Restructuring expenses
Deferred taxes
Excess cash
Unusual gains or losses
The appropriate adjustments depend on the analytical purpose.
Too many subjective adjustments can reduce transparency.
A practical EVA model should make every material adjustment visible and consistently applied.
Common Economic Value Added Mistakes
One major mistake is using net income directly as NOPAT.
Another is subtracting interest expense from NOPAT and then also including debt financing within the capital charge, effectively mixing financing effects.
Using year-end capital when the balance changed dramatically during the year can distort returns.
A poorly estimated WACC can materially alter the conclusion.
Analysts also make errors by assuming every profitable project creates value or every revenue-growing acquisition is economically attractive.
Finally, cross-company EVA comparisons become unreliable when NOPAT and invested-capital definitions differ.
Limitations of Economic Value Added
EVA is highly dependent on assumptions.
WACC is estimated rather than directly observed as one universal number.
Invested capital can be defined in several ways.
NOPAT can require adjustments.
Accounting asset values may differ from economic values.
Young companies can appear weak because they invest heavily before future profits emerge.
Intangible-intensive businesses can also be difficult to evaluate when important internally developed assets are expensed rather than recorded as invested capital.
For these reasons, EVA should be treated as a disciplined analytical framework—not a mechanically precise statement of value.
How to Analyze Economic Value Added Properly
Begin with operating earnings.
Reconcile EBIT to NOPAT.
Define invested capital explicitly.
Use representative average capital when appropriate.
Estimate WACC consistently.
Calculate the capital charge.
Then calculate EVA.
Next, calculate the ROIC spread to understand why EVA is positive or negative.
Compare results over several periods.
Separate improvements in operating profit from reductions in capital.
Evaluate incremental investments separately from the existing business.
Finally, connect EVA with free cash flow and business valuation.
The objective is not simply to produce another profitability number.
It is to answer a more demanding question:
After compensating all capital providers for the risk and capital they supply, did the business actually create economic value?
Frequently Asked Questions
What is economic value added?
Economic value added measures operating profit after tax remaining after deducting a charge for the capital invested in the business.
What does EVA stand for?
EVA stands for economic value added.
What is the economic value added formula?
EVA = NOPAT − (Invested Capital × WACC)
What is the capital charge in EVA?
Capital Charge = Invested Capital × WACC
It represents the modeled required dollar return on the capital employed.
What is NOPAT?
NOPAT means net operating profit after tax. A simplified calculation is:
NOPAT = EBIT × (1 − Operating Tax Rate)
What does positive EVA mean?
Positive EVA means NOPAT exceeds the capital charge under the assumptions used.
What does negative EVA mean?
Negative EVA means the company did not generate enough NOPAT to cover the modeled cost of invested capital.
What does zero EVA mean?
Zero EVA means operating returns equal the required cost of capital.
ROIC = WACC
How are EVA and ROIC related?
EVA = (ROIC − WACC) × Invested Capital
ROIC above WACC produces positive EVA under consistent definitions.
Can a profitable company have negative EVA?
Yes. Accounting profit can be positive while returns remain below the required return on invested capital.
Can revenue growth reduce EVA?
Yes. Growth can destroy economic value when incremental returns are below the cost of capital.
Is EVA the same as EBITDA?
No. EBITDA measures earnings before interest, taxes, depreciation, and amortization. EVA deducts a capital charge from after-tax operating profit.
Is EVA the same as free cash flow?
No. EVA is an economic-profit measure. Free cash flow is a cash-flow measure after specified operating and investment requirements.
Is EVA a GAAP measure?
No. EVA is an analytical economic-profit measure rather than a standard GAAP income-statement subtotal.
How can a company improve EVA?
A company can improve EVA by increasing NOPAT without proportionate additional capital, releasing unproductive capital, or investing new capital at returns above its cost of capital.
Final Perspective
Economic value added asks a stricter question than conventional profit:
EVA = NOPAT − (Invested Capital × WACC)
A company does not create economic value merely because it reports revenue growth, EBITDA, EBIT, or positive net income.
Capital has a required return.
If a business employs $100 million of capital and earns an after-tax operating return below what debt and equity investors require for the associated risk, accounting profit can coexist with economic value destruction.
The relationship can also be written:
EVA = (ROIC − WACC) × Invested Capital
That version exposes the central principle immediately.
ROIC above WACC creates positive economic value.
ROIC below WACC destroys economic value under the model.
The objective is therefore not growth at any price, maximum assets, maximum EBITDA, or even maximum accounting profit.
It is to deploy capital where the operating returns justify its economic cost.
That makes economic value added particularly useful for judging capital allocation, acquisitions, working-capital efficiency, operating improvement, and long-term value creation.




