


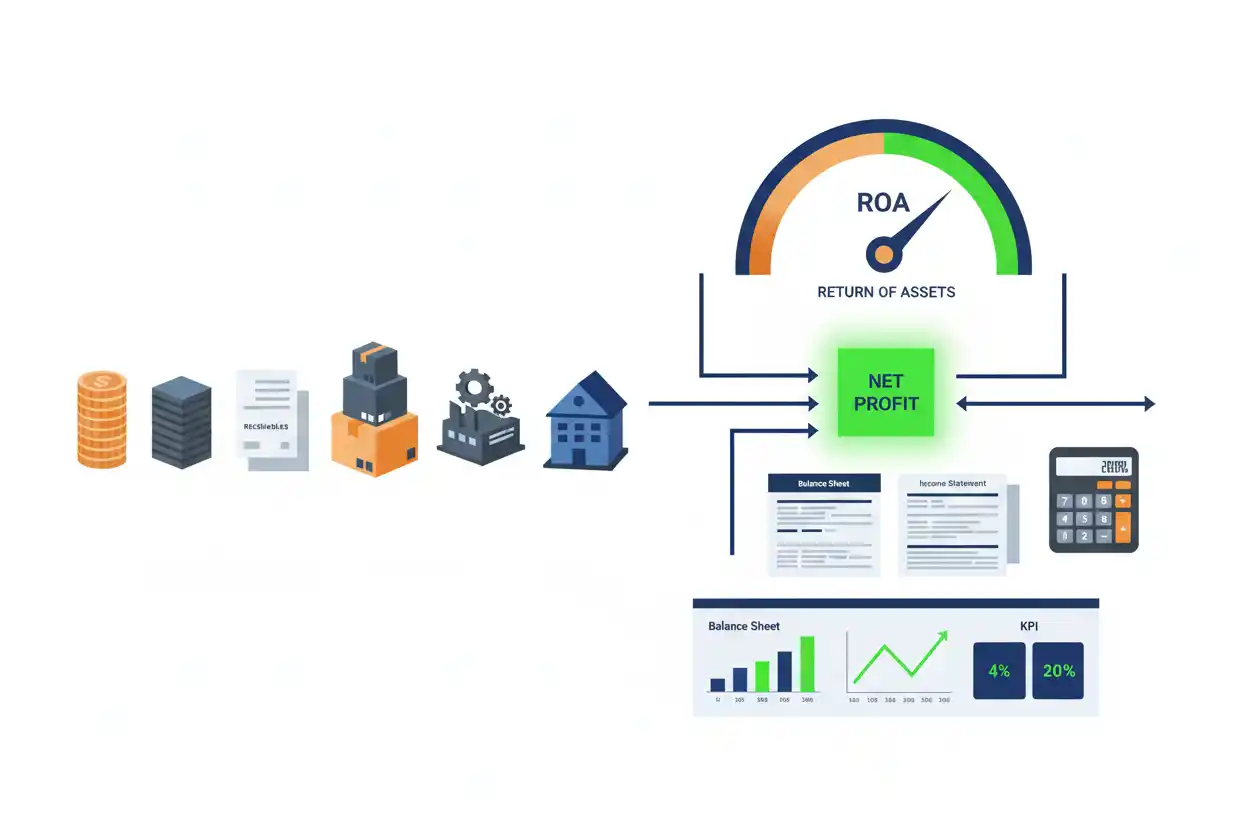
Return on assets measures how much profit a company generates relative to the assets used in the business. It connects the income statement with the balance sheet and provides a simple way to evaluate how efficiently an asset base is producing earnings.
A common formula is:
Return on Assets = Net Income ÷ Average Total Assets × 100
Suppose a company generates $450,000 of annual net income and has average total assets of $4.5 million.
ROA = $450,000 ÷ $4,500,000 × 100
ROA = 10%
A 10% return on assets means the company generated accounting net income equal to 10% of its average asset base during the period.
That does not mean every individual asset earned 10%, nor does it mean shareholders received a 10% investment return. ROA is a company-level profitability and asset-efficiency ratio.
Within business finance, return on assets is most useful when combined with margins, asset turnover, leverage, cash flow, and other return measures rather than treated as a standalone score.
What Is Return on Assets?
Return on assets, commonly abbreviated ROA, measures earnings relative to the resources recorded as assets on a company’s balance sheet.
The basic relationship is:
ROA = Profit ÷ Assets
For a standard company-level calculation, that becomes:
ROA = Net Income ÷ Average Total Assets × 100
Assets can include cash, receivables, inventory, property, equipment, intangible assets, investments, and other resources recognized on the balance sheet.
Net income reflects the accounting earnings produced during the period.
ROA therefore asks:
How much accounting profit did the company generate relative to the assets employed throughout the period?
Return on Assets Formula
The preferred general formula is:
Return on Assets = Net Income ÷ Average Total Assets × 100
Average assets are commonly calculated as:
Average Total Assets = (Beginning Total Assets + Ending Total Assets) ÷ 2
Combining the formulas:
ROA = Net Income ÷ [(Beginning Assets + Ending Assets) ÷ 2] × 100
Using average assets is generally more appropriate than using only ending assets because net income accumulates throughout a period while the balance-sheet asset amount represents a point in time.
How to Calculate Return on Assets
Suppose a company reports:
Beginning total assets = $4,000,000
Ending total assets = $5,000,000
Annual net income = $450,000
First calculate average assets:
Average Assets = ($4,000,000 + $5,000,000) ÷ 2
Average Assets = $4,500,000
Then:
ROA = $450,000 ÷ $4,500,000 × 100
ROA = 10%
The company’s return on assets is 10%.
In simplified terms, the company generated $0.10 of net income for every $1.00 of average assets.
Why Use Average Total Assets?
Net income covers an entire accounting period.
Total assets reported on a balance sheet apply to one date.
Using only ending assets can create a timing mismatch.
For example, suppose:
Beginning assets = $2 million
Ending assets = $6 million
Net income = $400,000
Using ending assets:
ROA = $400,000 ÷ $6,000,000
ROA ≈ 6.67%
Using average assets:
Average Assets = ($2M + $6M) ÷ 2
Average Assets = $4M
Therefore:
ROA = $400,000 ÷ $4,000,000
ROA = 10%
The difference is substantial.
If the business expanded gradually through the year, average assets usually provide a more representative denominator than the final balance alone.
Using Monthly or Quarterly Average Assets
A two-point beginning-and-ending average is still only an approximation.
Suppose a company’s asset base changes significantly during the year because of acquisitions, asset sales, seasonal inventory, or rapid growth.
In that situation, averaging monthly or quarterly asset balances can produce a more representative denominator.
Conceptually:
Average Assets = Sum of Periodic Asset Balances ÷ Number of Observations
For example, if monthly assets are available:
Average Assets = Sum of 12 Month-End Asset Balances ÷ 12
The more volatile the asset base, the more valuable a representative average becomes.
Return on Assets Example
Consider a company reporting:
Revenue = $10 million
Operating profit = $1.4 million
Net income = $900,000
Beginning assets = $8 million
Ending assets = $10 million
Average assets:
($8M + $10M) ÷ 2 = $9M
ROA:
$900,000 ÷ $9,000,000 × 100
ROA = 10%
The company generates net income equal to 10% of average assets.
Its $1.4 million operating profit is important for evaluating core operations, but the conventional ROA numerator in this example is the $900,000 final net income rather than the operating-profit subtotal.
What Does a 10% ROA Mean?
A 10% ROA means the company’s profit equals approximately 10% of its average total assets for the period.
If average assets equal $1 million:
Net Income at 10% ROA = $100,000
If average assets equal $100 million:
Net Income at 10% ROA = $10 million
ROA therefore scales profitability relative to the asset base.
This makes it easier to compare companies of different absolute sizes than simply comparing profit dollars.
However, meaningful comparisons still require reasonably similar businesses and accounting economics.
What Does a 5% ROA Mean?
Suppose:
Net income = $250,000
Average assets = $5,000,000
Then:
ROA = $250,000 ÷ $5,000,000 × 100
ROA = 5%
The company generated five cents of accounting profit for each dollar of average assets.
Whether 5% is strong or weak cannot be determined from the number alone.
Some businesses require enormous asset bases to produce revenue.
Others operate with comparatively little property, equipment, inventory, or working capital.
Industry structure matters.
What Is a Good Return on Assets?
There is no universal good ROA.
Asset-light companies can often generate higher ROA than capital-intensive businesses simply because they require fewer recorded assets to support sales.
A software or service business may need relatively little physical capital.
A manufacturer may require factories, machinery, inventory, and warehouses.
A utility or transportation company can require enormous infrastructure.
Financial institutions also operate with very large asset bases relative to earnings.
Therefore, the most useful comparisons generally involve:
the same company over time;
direct competitors;
companies with similar asset intensity;
and businesses using reasonably comparable accounting definitions.
A single universal ROA benchmark can be misleading.
Is a Higher ROA Better?
All else equal, a higher ROA indicates that a company is producing more profit relative to its average assets.
However, all else equal is important.
ROA can rise because the company becomes genuinely more efficient.
It can also rise because assets were sold, written down, depreciated, or otherwise reduced.
A business can delay necessary investment and temporarily improve its apparent asset efficiency.
Likewise, an acquisition can increase the asset base before the acquired operation contributes a full year of earnings, temporarily lowering ROA.
The direction matters, but the cause matters more.
What Does a Low ROA Mean?
A relatively low ROA means earnings are small in relation to the asset base.
Possible explanations include:
low profit margins;
poor asset utilization;
excess inventory;
slow receivable collections;
underused property or equipment;
a recent acquisition;
significant goodwill or intangible assets;
or the inherently capital-intensive nature of the industry.
Low ROA is therefore a starting point for analysis.
It does not identify the problem by itself.
Can Return on Assets Be Negative?
Yes.
When net income is negative and average total assets are positive, ROA becomes negative.
Suppose:
Net loss = −$300,000
Average total assets = $5 million
Then:
ROA = −$300,000 ÷ $5,000,000 × 100
ROA = −6%
A −6% ROA means the company generated an accounting loss equal to approximately 6% of its average asset base.
Negative ROA can occur because of weak operations, restructuring, economic downturns, startup losses, impairments, or other factors.
The underlying reason should be investigated before drawing conclusions about long-term asset efficiency.
Return on Assets vs Asset Turnover
Asset turnover measures how efficiently assets generate revenue:
Asset Turnover = Revenue ÷ Average Total Assets
ROA measures how effectively assets generate net income:
ROA = Net Income ÷ Average Total Assets
Suppose two companies each hold $10 million in average assets.
Company A generates:
Revenue = $20 million
Net income = $1 million
Asset turnover:
$20M ÷ $10M = 2.0
ROA:
$1M ÷ $10M = 10%
Company B generates:
Revenue = $10 million
Net income = $1 million
Asset turnover:
1.0
ROA:
10%
Both companies have identical ROA.
Company A generates twice as much revenue per asset dollar but earns a lower percentage of profit on those sales.
This leads to an important relationship between ROA, margin, and turnover.
The DuPont Relationship for ROA
Return on assets can be decomposed into profit margin and asset turnover when the formulas use consistent periods and definitions.
ROA = Net Profit Margin × Asset Turnover
Because:
Net Profit Margin = Net Income ÷ Revenue
and:
Asset Turnover = Revenue ÷ Average Assets
Multiplying them gives:
(Net Income ÷ Revenue) × (Revenue ÷ Average Assets)
Revenue cancels:
ROA = Net Income ÷ Average Assets
This decomposition shows that a business can increase ROA through:
higher profit per sales dollar;
more sales per asset dollar;
or:
a combination of both.
DuPont ROA Example
Suppose:
Revenue = $6,000,000
Net income = $450,000
Average assets = $4,500,000
$450,000 ÷ $6,000,000 × 100
Net Profit Margin = 7.5%
Asset turnover is:
$6,000,000 ÷ $4,500,000
Asset Turnover ≈ 1.333
Multiply them:
7.5% × 1.333 ≈ 10%
Therefore:
ROA ≈ 10%
This decomposition helps explain why the company earns a 10% ROA instead of merely reporting the result.
High Margin, Low Turnover Business
Suppose Company A has:
Net profit margin = 20%
Asset turnover = 0.5
Then:
ROA = 20% × 0.5
ROA = 10%
The company earns substantial profit from each sales dollar but generates relatively little revenue from each asset dollar.
This pattern can occur in businesses with high margins but substantial asset requirements or relatively low sales volume relative to the asset base.
Low Margin, High Turnover Business
Company B has:
Net profit margin = 5%
Asset turnover = 2.0
Then:
ROA = 5% × 2
ROA = 10%
Company B earns far less profit per revenue dollar but generates twice its average asset base in annual revenue.
Both companies therefore achieve 10% ROA through very different economics.
This is why ROA analysis becomes much more informative when both margin and turnover are examined.
Return on Assets vs Net Profit
Net profit is the numerator in a common ROA calculation.
Net profit is an absolute dollar amount.
ROA places that amount relative to assets.
Suppose:
Company A net profit = $5 million
Average assets = $100 million
ROA = 5%
Company B net profit = $2 million
Average assets = $10 million
ROA = 20%
Company A earns more profit dollars.
Company B generates substantially more profit per asset dollar.
Absolute profitability and asset efficiency answer different questions.
Return on Assets vs Operating Margin
Operating margin measures operating profit relative to revenue.
ROA measures net income relative to assets.
A company can therefore improve its operating margin while ROA declines if its asset base expands much faster.
Suppose operating profit rises because of better pricing, but the company also invests billions in new factories that are not yet fully productive.
Operating margin can improve while return on assets falls temporarily.
The numerator and denominator drivers need to be considered separately.
Return on Assets vs Operating Profit
Operating profit focuses on operating earnings.
ROA generally uses a broader bottom-line earnings measure such as net income in its conventional form.
That means financing costs, taxes, and applicable non-operating items can affect ROA even though they occur below operating profit.
For this reason, investors comparing operating efficiency independently of financing may also examine measures such as ROCE or ROIC.
ROA remains useful because it measures what the total asset base ultimately produced at the selected earnings level.
Return on Assets vs EBIT
EBIT measures earnings before interest and taxes.
Some analysts construct variations of asset-return ratios using EBIT or other operating earnings numerators.
Those versions should be labeled explicitly.
They are not automatically identical to conventional net-income-based ROA.
If one company reports:
ROA = Net Income ÷ Average Assets
and another reports:
Return = EBIT ÷ Average Assets
the resulting percentages do not measure exactly the same thing.
Consistency is essential for comparisons.
Return on Assets vs EBITDA
EBITDA is even farther from conventional ROA because EBITDA excludes depreciation and amortization under its standard construction.
Capital-intensive companies can have substantial depreciation.
Using EBITDA over assets can therefore produce a much higher percentage than net-income ROA.
That metric can still be useful for a particular analysis, but it should be labeled as an EBITDA-based return rather than presented simply as ROA.
Return on Assets vs Return on Equity
The workbook maps return on equity directly to this page because the ratios are closely related but use different denominators.
ROA:
ROA = Net Income ÷ Average Total Assets
ROE:
ROE = Net Income ÷ Average Shareholders’ Equity
Assets are generally funded through a combination of liabilities and equity.
As a result, a leveraged company can report an ROE substantially above its ROA.
Suppose:
Net income = $1 million
Average assets = $10 million
Average equity = $4 million
ROA:
$1M ÷ $10M = 10%
ROE:
$1M ÷ $4M = 25%
The same $1 million of earnings produces 10% ROA and 25% ROE because the equity denominator is much smaller.
ROA and Financial Leverage
Financial leverage helps explain the gap between ROA and ROE.
Suppose two companies generate similar returns on their assets.
Company A finances most assets with equity.
Company B uses substantially more debt.
If the borrowed capital produces returns that exceed its financing burden, leverage can increase shareholder returns.
If earnings decline, leverage can magnify losses to equity.
Therefore, a high ROE relative to ROA can reflect successful use of leverage, but it can also signal greater financial risk.
ROA and Debt-to-Equity
The debt-to-equity ratio provides additional context for ROA.
Consider:
Company A:
ROA = 8%
ROE = 10%
Company B:
ROA = 8%
ROE = 25%
Company B’s much larger gap may be partly explained by a more leveraged financing structure.
ROA focuses on the return generated by the asset base.
ROE focuses on the return relative to equity capital.
Debt-to-equity helps show how the assets are financed.
Return on Assets vs Return on Capital Employed
The workbook maps return on capital employed as a direct sibling.
ROA generally compares net income with average total assets.
ROCE typically uses an operating earnings numerator and a narrower definition of long-term capital employed.
As a result, ROCE attempts to assess returns generated from the capital committed to operations rather than from every reported asset.
Cash, current liabilities, financing definitions, and earnings treatment can make the metrics differ significantly.
The two should not be used interchangeably.
Return on Assets vs Return on Invested Capital
Return on invested capital also evaluates capital efficiency but normally uses an after-tax operating earnings numerator and a defined invested-capital denominator.
ROA is broader and often simpler:
Net Income ÷ Average Total Assets
ROIC attempts to answer a somewhat different question:
How effectively is the business generating operating returns on the capital invested in its operations?
Because ROIC definitions can involve several adjustments, this ROA page does not substitute for the dedicated ROIC calculation.
Return on Assets vs ROI
ROI is a general investment-return concept.
A common ROI framework compares a gain with an investment amount.
ROA specifically measures company earnings relative to company assets.
For example, buying a machine for $100,000 and earning a $20,000 project gain might be described as a 20% ROI under a simplified project calculation.
That does not mean the entire company has 20% ROA.
Company ROA uses the business’s earnings and broader average asset base.
Return on Assets vs Rental Property Returns
The workbook maps rental property returns directly to this article.
A rental property cap rate, for example, typically compares property NOI with property value.
ROA compares company-level net income with total assets.
Both relate earnings to assets or value, but their numerators and analytical purposes differ.
Therefore:
Cap Rate ≠ ROA
A property-level return percentage should not be relabeled as return on assets merely because the denominator involves real estate value.
Return on Assets and Receivables Turnover
The workbook also maps receivables turnover because inefficient receivable management can increase the asset base without creating corresponding profit.
Suppose two companies generate identical revenue and profit.
Company A collects customers quickly and maintains average receivables of $500,000.
Company B collects much more slowly and carries $2 million of receivables.
Company B needs a larger asset base to support the same level of earnings.
All else equal, that can reduce ROA.
Return on Assets and Inventory Turnover
Inventory turnover can affect ROA through a similar mechanism.
Suppose a retailer can support $10 million of annual sales with $1 million of average inventory.
Another requires $3 million of inventory for identical sales and margins.
The second retailer has more capital tied up in assets.
Unless the additional inventory generates corresponding profit, its asset efficiency is lower.
Improving inventory productivity can therefore improve asset turnover and potentially ROA.
Return on Assets and Working Capital
Working capital includes current operating assets such as receivables and inventory.
When excess working capital accumulates, total assets increase.
If those additional assets do not generate enough incremental earnings, ROA can decline.
However, businesses still need sufficient working capital to operate reliably.
The goal is not to minimize assets blindly.
It is to use the asset base efficiently while maintaining the liquidity and operating capacity the business actually needs.
Return on Assets and Quick Ratio
The workbook maps quick ratio because liquidity and asset efficiency can sometimes pull in different directions.
Suppose a business raises cash and holds the proceeds without investing them productively.
Its quick ratio may improve because liquid assets increase.
However, total assets also rise.
If earnings remain unchanged, ROA can fall.
A stronger liquidity buffer can therefore reduce measured asset efficiency temporarily.
Neither outcome is automatically wrong.
The company may deliberately accept lower current ROA in exchange for greater financial resilience.
Return on Assets and Current Ratio
The current ratio measures current assets relative to current liabilities.
ROA measures profit relative to total assets.
A large increase in current assets can strengthen the current ratio but weaken ROA when those assets generate little return.
For example, holding excessive cash or slow-moving inventory can make balance-sheet liquidity appear strong while reducing asset efficiency.
The two ratios therefore evaluate different financial priorities.
Return on Assets and Cash Ratio
The cash ratio focuses even more narrowly on highly liquid resources relative to current liabilities.
Large cash holdings can support financial safety.
Yet cash often produces lower returns than productive operating assets.
A company deliberately holding a substantial acquisition reserve may therefore report a lower ROA even though its liquidity position is conservative.
ROA should not be maximized at the expense of prudent liquidity management.
Return on Assets and Liquidity Ratios
Liquidity ratios answer whether a company appears capable of supporting short-term obligations.
ROA asks how effectively the overall asset base produces earnings.
A company can be:
highly liquid with low ROA;
less liquid with high ROA;
strong on both;
or weak on both.
Using both types of measure prevents profitability from being mistaken for short-term financial capacity.
ROA and Cash Flow
Return on assets is based on accounting earnings, not necessarily cash generated during the period.
Suppose net income is $1 million and average assets are $10 million:
ROA = 10%
If receivables rise sharply, actual cash generation may be much weaker than the net income figure suggests.
Consequently, operating cash flow provides an important companion measure.
A company can report respectable ROA while struggling to convert reported earnings into cash.
ROA and Free Cash Flow
Free cash flow provides another perspective because asset-intensive companies often need substantial capital expenditure.
Suppose two companies both report 10% ROA.
Company A requires little annual capital spending.
Company B needs enormous recurring investment merely to maintain its asset base.
Their accounting ROA figures can look identical while their free cash generation differs dramatically.
This is another reason ROA should not be interpreted as a complete measure of economic value.
How Asset Purchases Affect ROA
Suppose a company invests $5 million in a new factory near year-end.
The asset base rises immediately.
The factory may take a year or more to reach full production.
During the early period:
assets increase;
depreciation may begin;
operating costs can increase;
but incremental revenue and profit may still be limited.
ROA can therefore fall after a major investment even when management expects the project to create long-term value.
The correct analysis asks whether future earnings eventually justify the added asset base.
How Asset Sales Affect ROA
Selling underperforming assets can increase ROA if the remaining business maintains similar earnings with a smaller asset denominator.
Suppose:
Net income = $1 million
Average assets = $20 million
ROA = 5%
The business disposes of unproductive assets and later operates with $15 million of average assets while maintaining $1 million of profit.
ROA = $1M ÷ $15M
ROA ≈ 6.67%
Asset efficiency improved mathematically.
However, analysts should still determine whether the disposal is sustainable and whether one-time gains affected earnings.
How Acquisitions Affect ROA
Acquisitions can distort short-term ROA comparisons.
Suppose a company buys another business late in the year.
The acquired assets may be included in the balance sheet immediately, while only a short period of the acquired company’s earnings appears in consolidated net income.
ROA can decline even if the acquisition is economically attractive.
Using more granular average assets and understanding transaction timing can improve interpretation.
Goodwill and ROA
Acquisitions can create goodwill and other intangible assets.
These amounts increase total reported assets.
If acquired earnings are not sufficiently high relative to the added asset base, ROA can fall.
This creates an analytical choice.
Reported ROA reflects the full recognized asset base.
Some analysts may separately examine returns excluding goodwill or other acquired intangible assets.
Such adjusted measures can be useful, but they should be labeled clearly rather than presented as conventional ROA.
Depreciation and ROA
Depreciation affects both sides of ROA over time.
Depreciation expense reduces earnings.
Accumulated depreciation also reduces the carrying amount of certain assets.
As older assets become more heavily depreciated, a company can sometimes report a higher ROA simply because the recorded asset denominator has declined.
This can complicate comparisons between:
an older business using fully depreciated equipment;
and:
a newer competitor that recently invested in modern equipment.
The older company can appear more asset-efficient even when its physical operations are not necessarily superior.
Asset Age and ROA Comparability
Imagine two factories with similar production capacity.
Factory A’s equipment was purchased many years ago and is heavily depreciated.
Factory B recently replaced its machinery.
The newer equipment may have a much larger accounting carrying value.
Even if both businesses produce similar earnings, Factory A can report a higher ROA because its denominator is smaller.
This accounting effect is particularly important in capital-intensive industries.
Intangible Assets and Asset-Light Businesses
Asset-light companies can generate unusually high ROA because some valuable economic resources may not appear on the balance sheet at their full economic value.
Internally developed brands, workforce expertise, customer relationships, data, software, and organizational capabilities may contribute substantially to earnings without being recorded as large assets in the same way as purchased factories or real estate.
Therefore, comparing ROA between an asset-light service company and an asset-heavy manufacturer can reveal more about their business models than about management quality alone.
ROA and Business Valuation
Business valuation can benefit from ROA as an operating diagnostic, but ROA does not determine business value by itself.
Two companies can have identical ROA but very different:
growth rates;
risk;
cash-flow conversion;
competitive advantages;
capital requirements;
debt levels;
and future opportunities.
A 15% historical ROA does not automatically justify a particular valuation multiple.
ROA helps describe economic performance.
Valuation requires expectations about the future.
ROA and Profit
The broader profit concept explains the numerator side of the equation.
A company can increase ROA by earning more profit while keeping assets stable.
Suppose average assets remain $10 million.
At $500,000 profit:
ROA = 5%
At $1 million profit:
ROA = 10%
The company doubled ROA without changing its asset base.
However, profitability growth should still be tested for sustainability rather than assumed permanent.
ROA Growth Example
Suppose a company reports:
Year 1
Net income = $600,000
Average assets = $10 million
ROA = 6%
Year 2
Net income = $900,000
Average assets = $12 million
ROA = 7.5%
Profit increased by 50%.
Assets increased by 20%.
Because earnings grew faster than assets, ROA improved from 6% to 7.5%.
The company appears to be generating greater earnings from each asset dollar.
ROA Decline Example
Now suppose:
Year 1
Net income = $1 million
Average assets = $10 million
ROA = 10%
Year 2
Net income = $1.1 million
Average assets = $15 million
ROA ≈ 7.33%
Profit increased by 10%.
Assets increased by 50%.
The business earns more dollars, but ROA falls because the asset base expanded much faster than profit.
This can be a warning sign—or a temporary consequence of investing ahead of future growth.
Return on Assets for Banks
ROA is especially important in banking because banks operate with large asset bases and significant financial leverage.
Loans, securities, cash balances, and other financial assets dominate the balance sheet.
As a result, bank ROA percentages can be much smaller than those of many asset-light businesses while still representing meaningful profitability.
For banks, the metric is often described as return on average assets, or ROAA.
This is another reason cross-industry ROA comparisons should be made cautiously.
Annualizing Partial-Period ROA
When calculating ROA for a quarter or another period shorter than a year, analysts sometimes annualize the earnings numerator so the resulting percentage can be compared with annual figures.
For example, simply dividing one quarter’s $100,000 income by $10 million of average assets gives:
1% for the quarter
Annualizing mechanically would produce approximately:
4% annualized
However, this assumes the quarter is representative.
Seasonal companies can make such annualization misleading.
Whenever ROA is annualized, the methodology should be stated clearly.
Reported ROA vs Adjusted ROA
Companies can present adjusted profitability measures that remove specified expenses or gains.
If adjusted net income replaces reported net income in the numerator:
Adjusted ROA = Adjusted Net Income ÷ Average Assets
That is not automatically equivalent to reported ROA.
Suppose:
Reported net income = $500,000
Adjusted net income = $700,000
Average assets = $5 million
Reported ROA:
10%
Adjusted ROA:
14%
The four-percentage-point difference comes entirely from the adjusted numerator.
Readers should inspect what management excluded before comparing adjusted ROA with another company’s reported ROA.
ROA and One-Time Gains
Suppose a company normally earns $1 million annually but reports a $3 million gain from an unusual transaction.
Net income can increase sharply.
If the gain is included in the ROA numerator:
ROA rises sharply
even though normal asset productivity may not have changed.
For trend analysis, investors may therefore examine both reported results and appropriately defined recurring profitability.
However, adjustments should be transparent rather than selectively removing every unfavorable expense.
ROA and Asset Write-Downs
An impairment can have an unusual effect on ROA over time.
In the impairment period:
net income may fall because of the loss;
and:
assets may also decline because their carrying value is reduced.
Current-period ROA can deteriorate sharply because earnings are hit.
Future ROA may then improve mechanically because the asset denominator is smaller.
A sudden post-impairment ROA improvement should therefore not automatically be interpreted as operational progress.
ROA and Inflation
Historical-cost accounting can make long-term asset comparisons difficult during periods of substantial inflation.
Older assets may remain recorded at carrying values far below the current economic cost of replacing them.
A mature company’s denominator can therefore look comparatively small.
A newer competitor purchasing similar assets at much higher current prices may report lower ROA even if physical productivity is comparable.
This is another reason peer analysis requires context.
Comparing ROA Between Companies
Before comparing two companies, check:
whether both use net income;
whether both use average assets;
whether results cover the same period;
whether either ratio is annualized;
whether major acquisitions occurred;
whether adjusted earnings are used;
whether asset accounting differs materially;
and:
whether the businesses have similar asset intensity.
A one-percentage-point difference means little if the underlying definitions differ.
ROA and Business Models
ROA often reveals important differences in business design.
An asset-heavy business may earn relatively thin returns on a large base of physical assets.
An asset-light business can earn substantial income with fewer recorded assets.
A retailer may improve ROA through rapid inventory turnover.
A service company may improve ROA through high margins.
A bank may operate with very low ROA percentages but large leverage.
The ratio is therefore both a profitability measure and a window into how a company creates economic output.
Common Return on Assets Mistakes
A common mistake is using revenue rather than profit in the numerator. That calculates an asset-turnover-type ratio, not ROA.
Another is using ending assets when average assets are available and the asset base changed materially.
Users also compare ROA across unrelated industries without considering asset intensity.
A fourth mistake is assuming ROA and ROE are interchangeable.
Analysts can also compare a net-income ROA from one company with an adjusted operating-income return from another.
Another error is assuming a rising ROA always means operations improved; asset sales, write-downs, or delayed investment can increase the ratio mechanically.
Finally, high ROA should not be treated as proof of strong cash flow or an attractive valuation.
Limitations of Return on Assets
ROA is useful because it combines profitability with asset efficiency, but it has important limitations.
Accounting policies affect both earnings and asset values.
Asset age can distort comparisons.
Acquisitions and goodwill can increase the denominator.
Impairments can affect both numerator and denominator.
ROA uses accounting income rather than cash flow.
Industry asset requirements differ dramatically.
Financial leverage affects net income but does not reduce total assets in the same manner as the equity denominator used by ROE.
A simple beginning-and-ending asset average can also be inaccurate for highly seasonal businesses.
ROA is therefore most informative when paired with operating context and complementary ratios.
How to Analyze Return on Assets Properly
Start with the company’s net income for the period.
Then calculate a representative average total asset balance:
Average Assets = (Beginning Assets + Ending Assets) ÷ 2
Use more frequent asset balances when the asset base is highly volatile.
Then calculate:
ROA = Net Income ÷ Average Total Assets × 100
Compare the result with previous years and appropriate peers.
Next, decompose the ratio:
ROA = Net Profit Margin × Asset Turnover
Determine whether changes came primarily from profitability or asset utilization.
Then examine receivables, inventory, working capital, acquisitions, and major capital spending.
Compare ROA with ROE to understand the role of financing.
Finally, review operating and free cash flow to determine whether accounting earnings are converting into cash.
This approach transforms ROA from a percentage into an explanation of how efficiently the business converts its asset base into profit.
Why Return on Assets Matters
Return on assets connects two fundamental parts of company performance:
earnings and resources employed.
Its standard formula is:
ROA = Net Income ÷ Average Total Assets × 100
A company can improve ROA by earning greater profit from the same assets, generating the same profit with fewer assets, or improving both profitability and asset utilization.
The DuPont relationship shows the two operating drivers:
ROA = Net Profit Margin × Asset Turnover
Yet the percentage should never be interpreted mechanically.
High ROA can arise from strong margins, efficient assets, an asset-light model, old depreciated assets, or a temporarily reduced asset base.
Low ROA can reflect weak economics, heavy capital requirements, rapid investment, acquisitions, or an inherently asset-intensive business.
The best ROA analysis therefore asks not simply “Is the percentage high?” but “Why does the company generate this return from its assets, and is that performance sustainable?”
Frequently Asked Questions
What is return on assets in simple terms?
Return on assets measures how much accounting profit a company generates relative to its asset base. It is commonly used to evaluate profitability and asset efficiency together.
What is the return on assets formula?
A common formula is:
ROA = Net Income ÷ Average Total Assets × 100
How do you calculate average total assets?
A common method is:
Average Total Assets = (Beginning Total Assets + Ending Total Assets) ÷ 2
For companies with substantial asset fluctuations, monthly or quarterly averages may provide a better denominator.
What does a 10% ROA mean?
A 10% ROA means the company generated net income equal to approximately 10% of its average total assets during the period.
Is a higher return on assets better?
All else equal, higher ROA indicates more profit per asset dollar. However, differences in industry, accounting, asset age, leverage, acquisitions, and business model can materially affect the ratio.
What is a good ROA?
There is no universal good ROA. The most meaningful benchmark is usually the company’s own historical performance and comparable companies with similar asset requirements.
Can ROA be negative?
Yes. If the company reports a net loss while average assets remain positive, return on assets is negative.
Why use average assets instead of ending assets?
Net income accumulates throughout a period, while ending assets represent only one date. Average assets provide a better match between the period-based numerator and balance-sheet denominator.
What is the difference between ROA and ROE?
ROA compares net income with total assets. ROE compares net income with shareholders’ equity. Because companies can finance assets with debt, ROE can be substantially higher than ROA.
What is the difference between ROA and asset turnover?
ROA measures profit relative to assets. Asset turnover measures revenue relative to assets. A company can generate high sales from assets but still have low ROA if its profit margin is weak.
How are profit margin and asset turnover related to ROA?
When the underlying definitions are consistent:
ROA = Net Profit Margin × Asset Turnover
This shows that ROA depends on both profitability per sales dollar and revenue generated per asset dollar.
Can strong ROA coexist with poor cash flow?
Yes. ROA uses accounting earnings. If receivables, inventory, capital expenditures, or other cash requirements are significant, cash generation can be much weaker than the reported ROA suggests.




