


Profit is the financial amount left when the costs and expenses relevant to a calculation are subtracted from revenue, sales proceeds, or another form of economic benefit. At its simplest:
Profit = Revenue − Costs
If a business generates $500,000 of revenue and incurs $420,000 of applicable costs and expenses, its profit is:
Profit = $500,000 − $420,000
Profit = $80,000
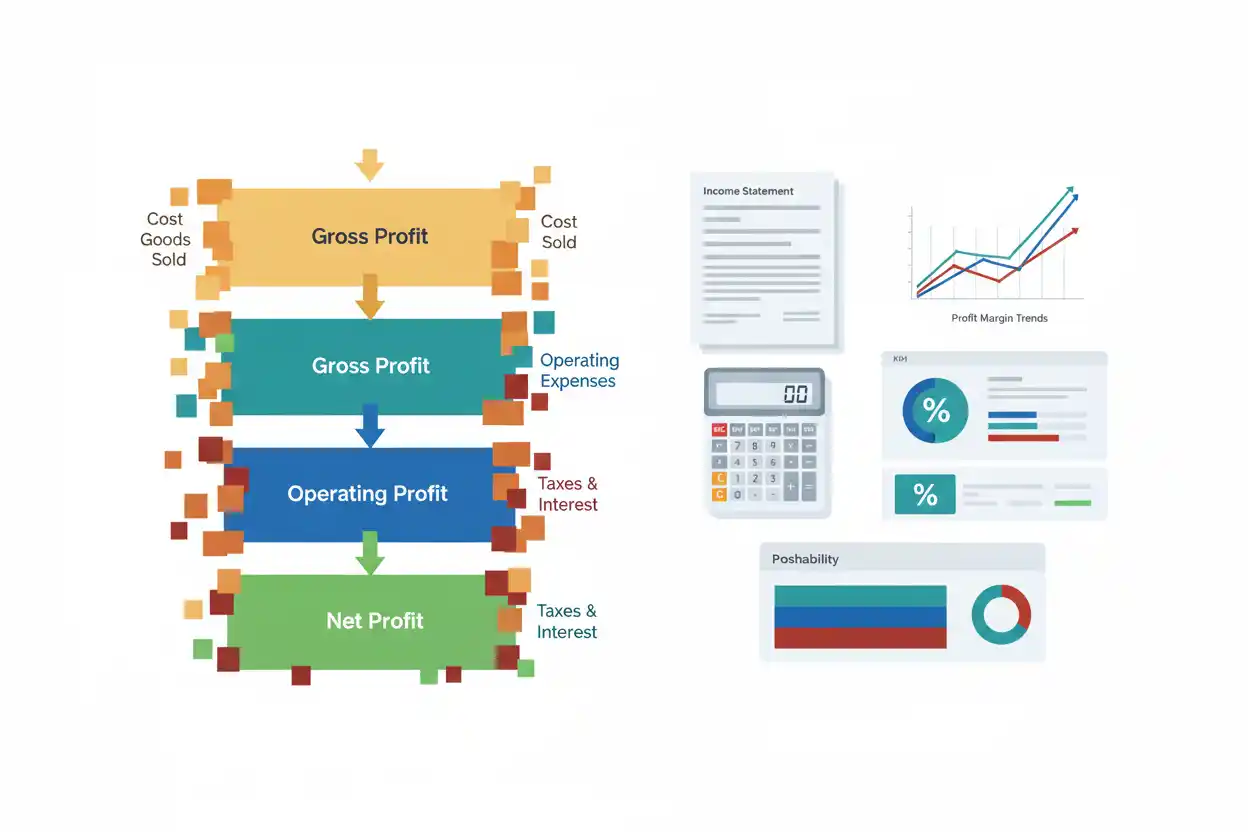
The word profit, however, can refer to several different levels of earnings. Gross profit subtracts the cost of goods sold. Operating profit goes further by subtracting operating expenses. Net profit reflects the broader final bottom-line result after additional applicable expenses.
That distinction matters because saying a business made “$100,000 profit” is incomplete unless the calculation makes clear which costs were deducted.
Within business finance, profit connects revenue, pricing, costs, margins, cash flow, break-even analysis, and returns. Understanding those relationships is more useful than memorizing one profit formula.
What Is Profit?
Profit is the amount by which revenue or proceeds exceed the costs and expenses included in a particular calculation.
The broad formula is:
Profit = Revenue − Expenses
For a simple product transaction:
Profit = Selling Price − Cost
For an entire business, the calculation becomes more detailed because different types of expenses are deducted at different stages of the income statement.
Suppose a product costs $60 and sells for $100:
Transaction Profit = $100 − $60
Transaction Profit = $40
That $40 represents profit above the stated $60 cost.
It does not automatically represent company-wide net profit because the business may still need to pay employees, rent, marketing, software, financing costs, taxes, and other expenses.
Profit Formula
The broadest profit formula is:
Profit = Total Revenue − Total Costs
If the result is positive, revenue exceeds the costs included in the calculation.
If the result is zero:
Revenue = Costs
If the result is negative:
Revenue < Costs
A negative profit is generally described as a loss.
However, a useful profit calculation should define its cost scope.
For example:
Gross Profit = Revenue − Cost of Goods Sold
Operating Profit = Gross Profit − Operating Expenses
Net Profit = Revenue − Total Applicable Expenses
Each formula answers a different profitability question.
Simple Profit Example
Suppose a small business sells 2,000 units of a product at $50 each.
Revenue is:
Revenue = 2,000 × $50
Revenue = $100,000
Assume total relevant costs are:
Product costs = $55,000
Marketing = $10,000
Payroll = $15,000
Other expenses = $8,000
Total costs:
$55,000 + $10,000 + $15,000 + $8,000 = $88,000
Profit:
$100,000 − $88,000 = $12,000
The business therefore earns $12,000 under the cost assumptions used.
The resulting final margin in this simplified example is:
Profit Margin = $12,000 ÷ $100,000 × 100
Profit Margin = 12%
Profit is the dollar amount.
Margin expresses that profit relative to revenue.
Profit vs Revenue
Revenue is money generated from sales or another recognized source before the associated expenses are subtracted.
Profit is what remains after relevant costs.
Suppose a business generates $1 million in revenue and $950,000 in expenses.
Profit = $1,000,000 − $950,000
Profit = $50,000
The company has $1 million of revenue but only $50,000 of profit.
This distinction matters because large sales do not automatically mean strong profitability.
Another company could generate only $500,000 of revenue but $100,000 of profit.
The smaller business has less revenue but twice as much profit.
Can Revenue Increase While Profit Falls?
Yes.
Suppose:
Year 1 revenue = $1,000,000
Year 1 costs = $850,000
Profit = $150,000
Year 2 revenue rises to $1,300,000, but costs rise to $1,200,000.
Profit = $100,000
Revenue increased 30%.
Profit fell by one-third.
Possible explanations include higher supplier costs, discounting, payroll growth, additional marketing, expansion costs, lower-margin sales, or inefficient operations.
This is why businesses should monitor profit rather than focusing only on sales growth.
Can Revenue Fall While Profit Rises?
Yes.
Suppose a business exits low-margin product lines.
Year 1:
Revenue = $2 million
Profit = $100,000
Year 2:
Revenue = $1.8 million
Profit = $250,000
The company became smaller by revenue but substantially more profitable.
This can happen when management improves product mix, eliminates unprofitable customers, raises prices, reduces unnecessary costs, or concentrates on higher-value activities.
More revenue is not always better revenue.
Gross Profit
Gross profit measures what remains after subtracting cost of goods sold from revenue.
Gross Profit = Revenue − Cost of Goods Sold
Suppose:
Revenue = $1,000,000
Cost of goods sold = $650,000
Then:
Gross Profit = $350,000
That $350,000 must still support operating expenses and other costs below the gross-profit level.
Gross profit therefore measures product or service economics before the broader expense structure.
It is not the same as final profit.
Gross Profit Example
Suppose a retailer sells goods for $500,000.
The merchandise sold originally cost $300,000.
Gross Profit = $500,000 − $300,000
Gross Profit = $200,000
If the business also incurs $170,000 of operating and other applicable expenses, much less profit ultimately remains.
The gross-profit figure helps reveal whether the fundamental sales-versus-product-cost relationship is attractive before considering the rest of the organization.
Gross Profit vs Gross Margin
Gross margin converts gross profit into a percentage of revenue.
Suppose:
Revenue = $500,000
Gross profit = $200,000
Then:
Gross Margin = $200,000 ÷ $500,000 × 100
Gross Margin = 40%
Gross profit is $200,000.
Gross margin is 40%.
The dollar figure measures absolute gross earnings.
The margin shows how much gross profit is produced from each revenue dollar.
Operating Profit
Operating profit goes further than gross profit.
A simplified formula is:
Operating Profit = Gross Profit − Operating Expenses
Suppose:
Gross profit = $400,000
Operating expenses = $250,000
Then:
Operating Profit = $150,000
Operating profit helps isolate earnings from the operating business before the broader effects of financing, taxes, and certain other items.
It is useful for assessing whether the core business model earns enough to support its operating cost structure.
Operating Profit vs Operating Margin
The workbook maps operating margin directly to this page because operating profit and its percentage form answer related but different questions.
Suppose:
Operating profit = $150,000
Revenue = $1,000,000
Operating margin is:
Operating Margin = $150,000 ÷ $1,000,000 × 100
Operating Margin = 15%
Operating profit tells you the dollar amount.
Operating margin tells you what percentage of revenue became operating profit.
Neither should be confused with final net profit.
Net Profit
Net profit represents the broader bottom-line earnings amount after applicable expenses have been recognized.
Suppose:
Revenue = $2,000,000
COGS = $1,000,000
Operating expenses = $700,000
Interest and taxes = $150,000
Net profit is:
$2,000,000 − $1,000,000 − $700,000 − $150,000
Net Profit = $150,000
This $150,000 is much narrower than the $1 million initially remaining after product costs alone.
Every profitability level therefore needs a clear label.
Net Profit Margin
Net profit margin expresses final profit relative to revenue.
Suppose:
Net profit = $150,000
Revenue = $2,000,000
Then:
Net Profit Margin = $150,000 ÷ $2,000,000 × 100
Net Profit Margin = 7.5%
That means approximately $0.075 of every revenue dollar becomes final net profit under the reported figures.
Profit vs Margin
Profit is normally a dollar amount.
Margin is a percentage.
Suppose a product sells for $100 and costs $60.
Profit:
$100 − $60 = $40
Margin:
$40 ÷ $100 × 100 = 40%
The product generates $40 of profit above the stated cost and a 40% margin relative to its $100 selling price.
The percentage becomes useful when comparing products or businesses of different sizes.
Profit vs Markup
Markup measures the difference between selling price and cost relative to cost, while margin measures profit relative to selling price.
Using:
Cost = $60
Price = $100
Profit = $40
Markup:
$40 ÷ $60 × 100 ≈ 66.67%
Margin:
$40 ÷ $100 × 100 = 40%
The same $40 profit therefore produces a 66.67% markup and a 40% margin.
The dedicated margin vs markup comparison owns the detailed conversion between those two percentages.
Why Cost Definition Matters
Profit changes depending on what is included as cost.
Suppose a product sells for $100 and its wholesale purchase price is $50.
A simple product profit calculation gives:
$100 − $50 = $50
Now add:
Shipping = $7
Payment fee = $3
Packaging = $4
Direct transaction costs become:
$50 + $7 + $3 + $4 = $64
Revised profit:
$100 − $64 = $36
Both calculations can be useful if clearly labeled.
The first measures selling price above wholesale cost.
The second captures a broader direct transaction cost.
The problem arises when a business uses the narrower $50 cost but interprets the resulting profit as though every relevant cost were included.
Profit and Cost of Goods Sold
Cost of goods sold is one of the most important cost categories in profitability analysis.
If COGS increases while revenue remains unchanged, gross profit falls.
Suppose:
Revenue = $1 million
Original COGS = $600,000
Gross Profit = $400,000
COGS rises to $700,000:
Gross Profit = $300,000
The $100,000 cost increase reduces gross profit by $100,000.
If no other items change, that pressure can eventually reduce operating and net profit as well.
Profit and Fixed Costs
Fixed costs remain relatively stable over a relevant activity range.
Suppose a business has:
Monthly contribution = $80,000
Fixed costs = $60,000
Profit before other relevant items is:
$80,000 − $60,000 = $20,000
If contribution grows to $100,000 while fixed costs remain at $60,000:
Profit = $40,000
Contribution increased 25%, but profit doubled.
This sensitivity is one reason fixed-cost structures can create substantial earnings leverage.
Profit and Variable Costs
Variable costs change more directly with sales or production.
Suppose a product sells for $100 and carries $65 of variable cost.
Contribution per sale is:
$100 − $65 = $35
If variable cost rises to $75:
Contribution = $25
Even if the selling price remains unchanged, each unit contributes $10 less toward fixed costs and profit.
At 100,000 units, that $10 difference represents:
$10 × 100,000 = $1,000,000
Small per-unit cost changes can therefore produce large total profit effects at scale.
Contribution Margin and Profit
Contribution margin connects sales with fixed costs and profit.
A simplified relationship is:
Contribution Margin = Revenue − Variable Costs
Then:
Profit = Contribution Margin − Fixed Costs
Suppose:
Revenue = $1 million
Variable costs = $600,000
Fixed costs = $300,000
Contribution margin:
$1,000,000 − $600,000 = $400,000
Profit:
$400,000 − $300,000 = $100,000
Once fixed costs are covered, additional contribution can flow more rapidly into profit.
Profit and Break-Even
Break-even analysis identifies the sales level at which profit equals zero under the selected cost model.
At break-even:
Revenue = Total Relevant Costs
Therefore:
Profit = $0
For a simple single-product model:
Break-Even Units = Fixed Costs ÷ Contribution Margin per Unit
Suppose:
Fixed costs = $100,000
Selling price = $50
Variable cost = $30
Contribution per unit:
$50 − $30 = $20
Break-even units:
$100,000 ÷ $20 = 5,000 Units
Below 5,000 units, the model produces a loss.
Above 5,000 units, the model produces profit.
Break-Even Point vs Profit
The break-even point identifies the exact activity level at which the result reaches zero profit.
Profit analysis asks what happens above or below that point.
Suppose fixed costs equal $100,000 and contribution margin per unit is $20.
At 5,000 units:
Profit = $0
At 7,000 units:
Contribution = 7,000 × $20 = $140,000
Profit = $140,000 − $100,000 = $40,000
At 4,000 units:
Contribution = $80,000
Loss = $80,000 − $100,000 = −$20,000
The break-even point therefore acts as the boundary between loss and profit in the simplified model.
Profit and Pricing
Pricing directly affects profit, but raising prices does not guarantee greater total profit.
Suppose 10,000 units sell for $50 each.
Revenue:
$500,000
If total relevant cost is $400,000:
Profit = $100,000
Now price rises to $55.
If sales volume remains at 10,000 units:
Revenue = $550,000
Assuming costs remain $400,000:
Profit = $150,000
Profit rises 50%.
However, if the higher price causes volume to fall sharply, the outcome could be worse.
Pricing decisions therefore require both arithmetic and demand analysis.
Profit and Cost-Plus Pricing
Cost-plus pricing starts with a defined cost and adds a desired markup or amount.
Suppose cost is $80 and the business applies a 25% markup:
Selling Price = $80 × 1.25
Selling Price = $100
The price produces $20 above the stated $80 cost.
However, that $20 is not necessarily final company profit.
Other operating expenses may still need to be paid.
Cost-plus pricing can help establish a price, but profitability analysis should check whether the resulting sales economics support the complete business.
Profit and Unit Economics
Unit economics measures the economics associated with an individual unit, order, customer, or transaction.
Suppose:
Selling price per order = $100
Product cost = $40
Fulfillment = $10
Payment fees = $3
Other variable cost = $7
Total variable cost:
$60
Contribution:
$100 − $60 = $40
If the company completes 50,000 orders:
Total Contribution = $40 × 50,000
Total Contribution = $2,000,000
If fixed costs are $1.5 million:
Profit = $500,000
Unit economics therefore provides the building blocks that eventually create company-level profit.
Profit and Customer Acquisition Cost
Customer acquisition cost can materially affect profitability when marketing or sales expenses are required to win new customers.
Suppose a first order generates $50 of contribution before customer acquisition.
If acquiring the customer costs $70:
Initial Customer Economics = $50 − $70
Initial Loss = $20
The relationship can still be attractive if the customer makes sufficiently profitable repeat purchases.
This is why businesses should evaluate customer acquisition alongside lifetime economics rather than focusing only on first-order product profit.
Profit and Inventory Turnover
Inventory turnover can materially affect how much profit a business generates from the capital committed to inventory.
Consider two products.
Product A earns $50 profit per sale but sells once per year.
Product B earns $20 per sale but turns ten times per year.
If the inventory investment is similar, Product B may generate more annual profit despite earning less on each individual sale.
Per-unit profitability and turnover therefore work together.
A large nominal margin on slow-moving inventory does not automatically produce attractive business economics.
Profit and Operating Leverage
Operating leverage explains why profit can change much faster than revenue when a business has meaningful fixed operating costs.
Suppose revenue increases 10%.
If operating profit rises 40%:
Degree of Operating Leverage = 40% ÷ 10%
DOL = 4
The same leverage also works in reverse.
A 10% revenue decline can cause a much larger percentage profit decline when fixed costs remain.
Profit therefore depends not only on revenue growth but also on how the cost structure responds to that growth.
Profit and Cash Flow
Profit and cash flow are not interchangeable.
Accounting profit can be recognized before the related cash is received.
For example, a company can make a profitable credit sale today but wait 90 days for customer payment.
Likewise, depreciation can reduce accounting profit without representing a current-period cash payment.
This is why operating cash flow provides important context.
A profitable company can experience weak cash generation.
A company with low current accounting profit can sometimes generate strong cash flow.
Both perspectives matter.
Profit vs Free Cash Flow
Free cash flow moves beyond accounting profit to examine cash remaining after operating cash generation and applicable capital expenditures under its formula.
Suppose:
Net profit = $500,000
Operating cash flow = $650,000
Capital expenditures = $800,000
A simplified free cash flow calculation gives:
Free Cash Flow = $650,000 − $800,000
Free Cash Flow = −$150,000
The company is profitable but consumes cash after capital expenditure.
This can be normal during expansion, but it shows why profit alone cannot reveal the complete financial picture.
Profit and Working Capital
Working capital can create large differences between profit and cash availability.
Suppose a company records $1 million of profitable new credit sales.
If customers have not yet paid, accounts receivable rises.
Accounting profit can increase while the business still needs cash to pay suppliers and employees.
Likewise, building inventory consumes cash even before the products are sold.
Profitability and liquidity therefore should not be confused.
Profit and Quick Ratio
The workbook maps quick ratio directly to this page because profitable companies can still have weak short-term liquidity.
Quick ratio compares relatively liquid assets with current liabilities.
Profit measures earnings.
A company could report strong annual profit while facing temporary payment pressure because cash is tied up in receivables or other assets.
Another company could report a current loss but still have substantial cash reserves and a strong quick ratio.
Profitability and liquidity answer different questions.
Profit and Net Present Value
Net present value evaluates an investment’s discounted future cash flows rather than accounting profit from one period.
Suppose a project generates $100,000 of annual profit.
That alone does not prove the investment creates value.
If the project required $10 million upfront, the return may be unattractive.
NPV incorporates initial investment, cash-flow timing, and a required return.
Profit tells you whether revenues exceeded relevant expenses.
NPV asks whether a particular investment created enough discounted value relative to the capital committed.
Profit and Profitability Index
The workbook directly maps profitability index to this page.
Profitability index compares the present value of future cash inflows with the investment required.
A common formula is:
Profitability Index = Present Value of Future Cash Flows ÷ Initial Investment
That metric is not another form of accounting profit.
A company can have profitable operations while a proposed project has a profitability index below the required level.
Likewise, an investment can have an attractive PI even though accounting profit during its early years is modest.
Profit and Payback Period
The workbook also maps payback period because profit and capital recovery should be kept separate.
Suppose an investment generates $50,000 of annual accounting profit.
Its annual incremental cash flow might be $70,000 because of noncash depreciation and other timing effects.
If the initial investment is $350,000, using accounting profit gives:
$350,000 ÷ $50,000 = 7 Years
Using the relevant $70,000 cash flow gives:
$350,000 ÷ $70,000 = 5 Years
Payback should therefore be calculated from incremental cash flow rather than blindly using the reported profit figure.
Profit and ROI
ROI relates return to the capital invested.
Suppose two businesses each generate $100,000 of annual profit.
Business A requires $500,000 of investment.
Business B requires $5 million.
The profit dollars are identical, but the capital efficiency is very different.
A simplified ROI comparison would produce dramatically different percentages.
Profit measures the earnings amount.
ROI places that earnings or gain in the context of investment.
Profit and Return on Assets
Return on assets examines profit relative to the assets used to generate it.
Suppose:
Company A profit = $1 million
Assets = $5 million
Company B profit = $1 million
Assets = $25 million
The companies earn identical profit dollars.
Company A uses far fewer assets to generate them.
This is why absolute profit should be considered alongside capital-efficiency measures.
Profit and Return on Equity
Return on equity relates earnings to shareholders’ equity.
Two companies can produce identical profit while using very different amounts of equity and debt.
A highly leveraged company may generate high ROE from modest profit relative to assets because shareholders have contributed less equity capital.
The resulting risk profile can also be very different.
Profit therefore provides only one layer of financial performance.
Profit and Business Valuation
Business valuation often considers earnings, cash flow, growth, risk, assets, capital requirements, and comparable market values.
A business generating $1 million of annual profit is not automatically worth the same amount as every other business earning $1 million.
One company may have strong recurring customers and growing earnings.
Another may be declining rapidly.
One may need very little capital.
Another may require constant heavy investment.
Profit matters, but value depends on the quality and expected durability of that profit as well.
Profit and Cash Flow Forecasting
Cash flow forecasting helps management understand when money is expected to enter and leave the business.
A company can forecast positive annual profit but still experience a cash shortage in a particular month.
For example, customers may pay in 60 days while payroll, suppliers, and taxes are due much sooner.
The profit forecast says the business may be economically profitable.
The cash forecast shows whether it can meet obligations on time.
Both are necessary.
Economic Profit vs Accounting Profit
Accounting profit generally follows financial-reporting definitions of revenue and expense.
Economic profit can use a broader conceptual framework that includes the opportunity cost of capital or resources.
Suppose an owner invests $1 million in a business and earns $70,000 of accounting profit.
If a comparable alternative could reasonably have produced $80,000 for similar risk, the business may appear profitable in accounting terms while providing less return than the alternative opportunity.
This does not make the accounting profit wrong.
It answers a different question.
Profit vs Income
The terms profit, income, and earnings are often used in overlapping ways, but their precise meaning depends on context.
For example:
Gross income may refer to one subtotal.
Operating income can correspond to operating profit.
Net income often refers to final net profit.
In tax contexts, statutory definitions may differ again.
When reading a financial statement or calculation, the actual formula and line items matter more than assuming every use of “income” and “profit” means the same thing.
Accounting Profit Is Not Cash in the Bank
A company can earn profit and still have little available cash.
Suppose it makes $500,000 of credit sales near year-end with an attractive margin.
Revenue and profit may be recognized under the applicable accounting rules.
But if customers have not yet paid, those transactions may not have added an equivalent $500,000 to cash.
Similarly, a company can borrow $1 million and have much more cash in the bank without earning $1 million of profit.
Cash balance and profit are distinct financial concepts.
What Causes Profit to Increase?
Profit can increase through several mechanisms.
Revenue can rise without proportional cost growth.
Pricing can improve.
Cost of goods sold can decline.
Product mix can shift toward higher-profit items.
Fixed costs can be spread across greater volume.
Operating efficiency can improve.
Financing costs can decline at the net-profit level.
However, the source matters.
A sustainable improvement in recurring operations is different from a one-time gain.
What Causes Profit to Fall?
Profit can fall when revenue declines or expenses rise.
Input inflation can increase product costs.
Competitive pressure can reduce selling prices.
Wages can rise.
Marketing may become less efficient.
Fixed capacity can become underutilized.
Interest expense can increase.
Returns, warranty costs, write-downs, or other expenses can also reduce earnings.
A falling profit figure should therefore be decomposed into its underlying revenue and cost drivers.
Profit Growth Formula
Profit growth can be measured as:
Profit Growth = (Current Profit − Previous Profit) ÷ Previous Profit × 100
Suppose:
Previous profit = $200,000
Current profit = $250,000
Then:
Profit Growth = ($250,000 − $200,000) ÷ $200,000 × 100
Profit Growth = 25%
The business increased profit by 25%.
However, when the previous period has zero or negative profit, percentage growth can become misleading or mathematically difficult to interpret.
In those cases, comparing dollar changes may be clearer.
Profit Margin Formula
A general profit margin is:
Profit Margin = Profit ÷ Revenue × 100
The exact name depends on which profit numerator is used.
Gross profit produces gross margin.
Operating profit produces operating margin.
Net profit produces net profit margin.
Suppose:
Revenue = $800,000
Profit = $120,000
Profit Margin = $120,000 ÷ $800,000 × 100
Profit Margin = 15%
The company generates $0.15 of the stated profit measure for each dollar of revenue.
Is a Higher Profit Always Better?
Higher profit is generally desirable when the improvement is sustainable and does not require disproportionate risk or investment.
However, profit should not be evaluated without context.
A company can increase current earnings by postponing essential maintenance.
It can reduce research spending.
It can cut marketing needed for future growth.
It can sell valuable assets.
It can use more leverage.
It can also generate more absolute profit simply because it is much larger.
The quality, durability, cash conversion, capital intensity, and risk behind the profit therefore matter.
What Is a Good Profit?
There is no universal dollar profit that is good for every business.
A $100,000 annual profit could be excellent for a small owner-operated business and immaterial for a billion-dollar company.
Profit should generally be evaluated relative to:
revenue;
capital invested;
assets;
equity;
business risk;
company size;
growth;
and realistic alternative uses of capital.
Absolute profit remains important, but scale and efficiency determine how meaningful that amount is.
Common Profit Mistakes
One common mistake is treating revenue as profit.
Another is failing to define which expenses have been deducted.
Businesses also confuse gross profit with net profit.
Markup can be mistaken for profit margin.
Accounting profit can be mistaken for cash flow.
A profitable sale can be treated as proof that the entire business is profitable.
Another error is comparing raw profit dollars between companies of radically different sizes.
Finally, a single profitable period can be distorted by unusual gains, tax effects, asset sales, or other temporary items.
Clear definitions prevent most of these mistakes.
Limitations of Profit as a Metric
Profit is fundamental, but it does not answer every financial question.
It does not directly measure liquidity.
It does not automatically equal cash flow.
It does not reveal how much capital was required.
It does not show the timing of returns.
It can be affected by accounting estimates and classifications.
It does not tell you whether an investment exceeded its required return.
Absolute profit also makes differently sized companies difficult to compare.
For these reasons, profit should be interpreted alongside margins, cash flow, balance-sheet measures, capital returns, and investment metrics.
How to Analyze Profit Properly
Start with revenue.
Then determine which costs are being deducted.
Calculate gross profit to understand the basic sales-versus-product-cost relationship.
Move to operating profit to incorporate the broader operating expense structure.
Then examine net profit for the final bottom-line result.
Convert relevant profit figures into margins.
Compare profit with operating cash flow and free cash flow.
Review break-even and unit economics.
Finally, consider the assets and capital required to generate those earnings.
This sequence answers more than “Did the business make money?”
It explains where the profit came from, how much was retained, whether it converted into cash, and how much investment was required to earn it.
Why Profit Matters
Profit is the economic result created when revenue exceeds the costs included in a calculation.
The simplest relationship is:
Profit = Revenue − Costs
But useful profitability analysis goes deeper.
Gross profit shows what remains after cost of goods sold.
Operating profit shows what remains after broader operating expenses.
Net profit shows the final bottom line.
Margins convert those dollar amounts into percentages.
Cash-flow analysis shows whether the accounting earnings converted into cash.
Return metrics show how much capital was required.
Profit therefore remains one of the most important business measures—but only when the word profit is defined precisely enough to show what has actually been subtracted.
Frequently Asked Questions
What is profit in simple terms?
Profit is the amount left when the costs and expenses included in a calculation are subtracted from revenue or sales proceeds.
What is the basic profit formula?
The broad formula is:
Profit = Revenue − Costs
The exact costs depend on whether you are calculating gross, operating, net, transaction, or another type of profit.
What is the difference between revenue and profit?
Revenue is the money generated from sales before relevant expenses are deducted. Profit is what remains after the applicable costs and expenses are subtracted.
What is the difference between gross profit and net profit?
Gross profit subtracts cost of goods sold from revenue. Net profit reflects the broader final earnings result after additional applicable operating, financing, tax, and other expenses.
What is the difference between profit and profit margin?
Profit is normally an absolute monetary amount. Profit margin expresses profit as a percentage of revenue.
Is markup the same as profit?
No. Markup is a percentage relationship between profit above a defined cost and that cost. Profit itself is the dollar difference between revenue or selling price and the applicable costs.
Can a company have revenue but no profit?
Yes. If a company earns revenue but its costs equal or exceed that revenue, it can break even or report a loss.
Can a profitable company have poor cash flow?
Yes. Profitable sales may remain unpaid in accounts receivable, inventory can consume cash, and capital expenditure can exceed operating cash generation.
What does negative profit mean?
Negative profit means the costs included in the calculation exceeded revenue. The negative result is normally called a loss.
How can a business increase profit?
Potential approaches include increasing economically sustainable sales, improving pricing, reducing unnecessary costs, improving product mix, increasing operational efficiency, and controlling fixed and variable expenses.
Is higher profit always better?
Higher sustainable profit is generally favorable, but it should be considered alongside risk, cash flow, capital requirements, future investment, and the quality of the earnings.
Why is profit important?
Profit shows whether a business or transaction generated more economic benefit than the relevant costs consumed. It helps support operations, investment, debt service, reserves, distributions, and future growth.




