


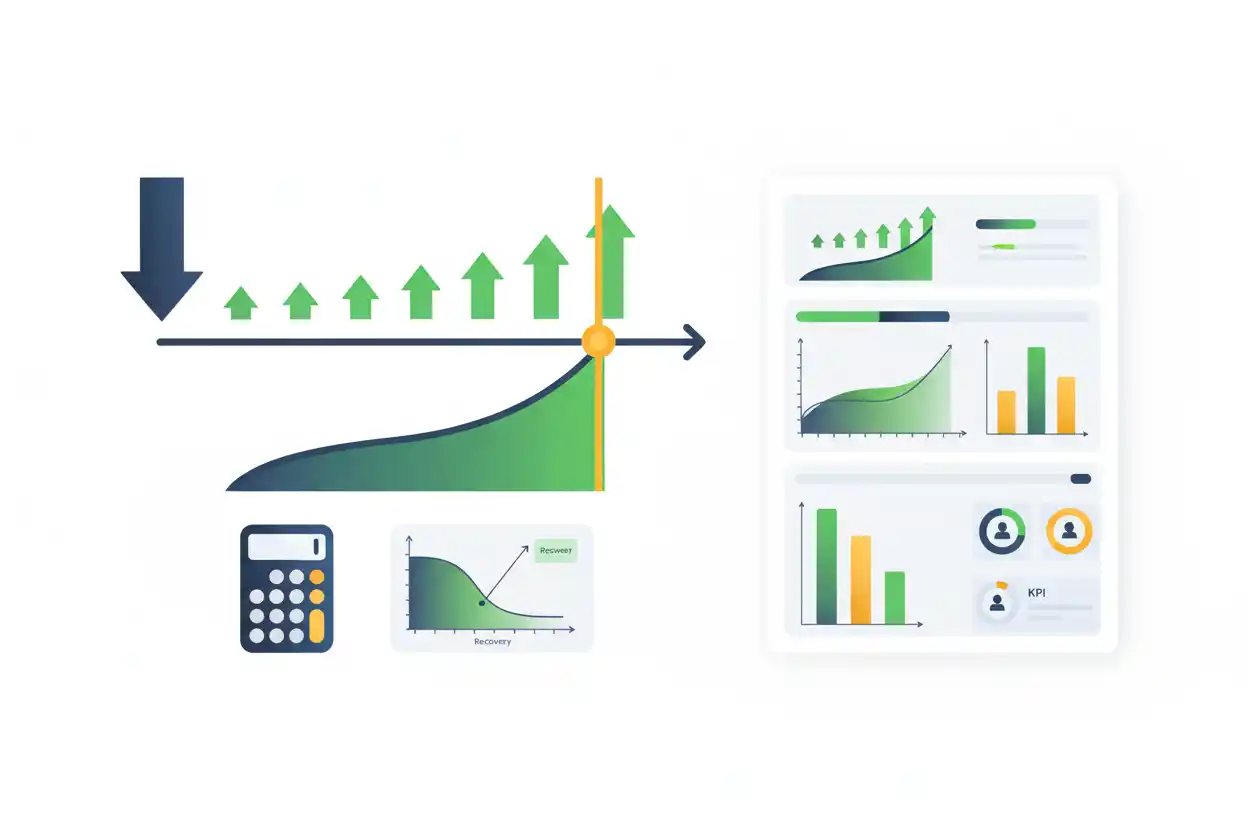
The payback period measures how long it takes for an investment’s cumulative cash inflows to recover its initial cash outflow. A shorter payback means the invested capital is recovered sooner, while a longer payback means the capital remains at risk for more time before the initial investment is fully recovered.
If a project costs $100,000 and generates $25,000 of cash inflow every year, its simple payback period is:
Payback Period = $100,000 ÷ $25,000
Payback Period = 4 Years
The calculation is straightforward when annual cash flows are equal. When cash flows vary from year to year, the payback period must be calculated by accumulating each cash flow until the unrecovered investment reaches zero.
Payback is useful as a screening and liquidity-oriented capital-budgeting measure, but it does not provide a complete investment decision by itself. Simple payback ignores the time value of money and generally ignores cash flows occurring after the investment has already paid back.
Within business finance, the payback period is therefore most useful alongside measures such as net present value, internal rate of return, profitability index, and cash-flow analysis.
What Is the Payback Period?
The payback period is the amount of time required for an investment’s cumulative cash benefits to equal its initial cost.
Conceptually:
Payback Occurs When Cumulative Cash Inflows = Initial Investment
Suppose a company spends $300,000 on equipment and expects the equipment to generate $75,000 of annual cash savings.
After one year, $75,000 has been recovered.
After two years, cumulative recovery reaches $150,000.
After three years, it reaches $225,000.
After four years:
$75,000 × 4 = $300,000
The investment has recovered its initial $300,000 cost.
Therefore:
Payback Period = 4 Years
Payback answers a specific question:
How long does the investment take to recover the money initially committed?
It does not directly answer how much total value the investment creates.
Payback Period Formula
When annual cash inflows are equal, the simple formula is:
Payback Period = Initial Investment ÷ Annual Net Cash Inflow
Suppose:
Initial investment = $240,000
Annual cash inflow = $60,000
Then:
Payback Period = $240,000 ÷ $60,000
Payback Period = 4 Years
This formula works only when the relevant net cash inflow is reasonably constant from period to period.
If the annual cash flows are uneven, use cumulative cash flows instead.
Payback Period Example
Suppose a business invests $150,000 in a new production system.
The system is expected to generate $30,000 of annual net cash savings.
Payback Period = $150,000 ÷ $30,000
Payback Period = 5 Years
At the end of Year 1:
Cumulative Recovery = $30,000
Year 2:
$60,000
Year 3:
$90,000
Year 4:
$120,000
Year 5:
$150,000
The original investment is fully recovered at the end of the fifth year.
How to Calculate Payback Period With Uneven Cash Flows
The simple division formula does not work when annual cash flows differ.
Instead, accumulate the expected cash inflows period by period.
Suppose an investment costs $200,000 and produces:
| Year | Cash Inflow | Cumulative Inflow |
|---|---|---|
| 1 | $45,000 | $45,000 |
| 2 | $55,000 | $100,000 |
| 3 | $65,000 | $165,000 |
| 4 | $70,000 | $235,000 |
The $200,000 initial investment has not been recovered by the end of Year 3.
At that point:
Unrecovered Investment = $200,000 − $165,000
Unrecovered Investment = $35,000
Year 4 is expected to generate $70,000.
Assuming the Year 4 cash flow is earned evenly throughout the year:
Fraction of Year = $35,000 ÷ $70,000
Fraction of Year = 0.50
Therefore:
Payback Period = 3 + 0.50
Payback Period = 3.5 Years
The project recovers its initial investment halfway through Year 4 under the even-within-year assumption.
Partial-Year Payback Formula
For uneven annual cash flows, after identifying the last full year before recovery:
Payback Period = Full Years Before Recovery + Unrecovered Amount at Start of Recovery Year ÷ Cash Flow During Recovery Year
Suppose:
Initial investment = $500,000
Cumulative inflow after Year 3 = $440,000
Year 4 inflow = $120,000
The unrecovered balance is:
$500,000 − $440,000 = $60,000
Fraction of Year 4 needed:
$60,000 ÷ $120,000 = 0.50
Therefore:
Payback Period = 3.5 Years
This fractional-year method assumes cash arrives evenly during the recovery year. If the timing of cash flows is known more precisely, the actual dates should be used instead.
What Does a 3-Year Payback Period Mean?
A three-year payback period means the cumulative cash inflows generated by the investment are expected to recover its initial cost after three years.
Suppose:
Initial investment = $600,000
Annual cash inflow = $200,000
Then:
$600,000 ÷ $200,000 = 3 Years
This does not mean the investment stops generating cash after three years.
It simply means the original $600,000 has been recovered by that point.
If the investment continues producing $200,000 annually for another seven years, those later cash flows can be economically important even though they do not affect the simple payback period.
Is a Shorter Payback Period Better?
All else equal, a shorter payback period means invested capital is recovered sooner.
This can reduce exposure to uncertainty and improve capital flexibility.
However, a shorter payback period does not automatically mean the investment creates more value.
Consider:
Project A
Initial investment = $100,000
Payback = 2 years
Total lifetime cash inflows = $130,000
Project B
Initial investment = $100,000
Payback = 3 years
Total lifetime cash inflows = $300,000
Project A returns the initial capital sooner.
Project B takes longer to recover the investment but ultimately produces far more cash.
If management chooses solely on payback, it could reject the economically superior long-term investment.
That is why payback should be treated as one decision metric rather than a complete capital-allocation rule.
What Is a Good Payback Period?
There is no universal payback period that is good for every project.
The acceptable period depends on factors such as:
investment risk;
business liquidity;
technology life;
economic life;
uncertainty;
strategic importance;
capital availability;
industry conditions;
alternative investments; and
management’s capital-allocation policy.
A two-year threshold may be reasonable for one type of rapidly changing technology and unnecessarily restrictive for long-lived infrastructure.
The appropriate benchmark should reflect the economics of the investment rather than an arbitrary universal rule.
Simple Payback Period
The standard payback calculation is often called simple payback.
For constant annual cash flow:
Simple Payback = Initial Investment ÷ Annual Cash Benefit
Suppose a machine costs $80,000 and saves $20,000 per year:
Simple Payback = $80,000 ÷ $20,000
Simple Payback = 4 Years
The word simple matters because this calculation does not discount future cash flows.
A dollar recovered four years from now is treated as equal to a dollar recovered today.
That limitation leads to the discounted payback period.
Discounted Payback Period
The discounted payback period adjusts future cash flows for the time value of money before determining how long it takes to recover the investment.
Instead of accumulating nominal future cash flows, first calculate their present values.
The present value formula is:
Present Value of Cash Flow = CFₜ ÷ (1 + r)ᵗ
Where:
CFₜ = cash flow in period t
r = discount rate
t = number of periods
Then accumulate the discounted cash flows until the initial investment is recovered.
Because future positive cash flows are discounted, discounted payback is normally longer than simple payback for a conventional project with a positive discount rate.
Discounted Payback Example
Suppose:
Initial investment = $100,000
Annual cash inflow = $30,000
Discount rate = 10%
Simple payback is:
$100,000 ÷ $30,000 = 3.33 Years
Now discount each annual $30,000 cash flow.
Year 1:
PV = $30,000 ÷ 1.10
PV ≈ $27,272.73
Year 2:
PV = $30,000 ÷ 1.10²
PV ≈ $24,793.39
Cumulative discounted recovery:
$52,066.12
Year 3:
PV = $30,000 ÷ 1.10³
PV ≈ $22,539.44
Cumulative:
$74,605.56
Year 4:
PV = $30,000 ÷ 1.10⁴
PV ≈ $20,490.40
Cumulative:
$95,095.96
The investment still has not paid back on a discounted basis.
Year 5:
PV = $30,000 ÷ 1.10⁵
PV ≈ $18,627.64
The discounted cash flow during Year 5 pushes cumulative recovery above $100,000.
The discounted payback period is therefore between Years 4 and 5.
Simple Payback vs Discounted Payback
Simple payback ignores discounting.
Discounted payback incorporates it.
Suppose a project has:
Simple payback = 4 years
Discounted payback = 5 years
The one-year difference reflects the fact that future cash flows are worth less in present-value terms when a positive required return is applied.
Discounted payback therefore addresses one major weakness of simple payback.
However, it still has another important limitation: once the investment pays back, later cash flows generally do not affect the payback result.
Payback Period vs Net Present Value
Net present value and payback period answer different capital-budgeting questions.
Payback asks:
How long until the investment is recovered?
NPV asks:
How much value do the investment’s discounted cash flows create relative to its cost?
Suppose:
Project A payback = 2 years
NPV = $20,000
Project B payback = 4 years
NPV = $200,000
Project A recovers capital more quickly.
Project B creates ten times as much modeled present value.
A company focused only on rapid capital recovery could prefer A.
A company seeking to maximize economic value may prefer B, depending on risk, capital constraints, and other considerations.
Why Payback Can Conflict With NPV
Payback ignores cash flows after the recovery date.
NPV does not.
Suppose both investments cost $100,000.
Project A cash flows:
Year 1 = $60,000
Year 2 = $50,000
Years 3–10 = $0
Project B:
Year 1 = $30,000
Year 2 = $30,000
Year 3 = $30,000
Year 4 = $30,000
Years 5–10 = $30,000 annually
Project A pays back sooner.
Project B may create substantially more total and present value because it continues generating cash for much longer.
Payback’s simplicity therefore comes at the cost of ignoring potentially valuable post-payback cash flows.
Payback Period vs IRR
IRR measures the discount rate at which an investment’s NPV becomes zero.
Payback measures recovery time.
An investment can have a fast payback but a relatively modest IRR.
Another can have slower recovery but higher lifetime return.
The metrics also treat timing differently.
IRR incorporates the timing of the full cash-flow sequence used in the calculation.
Simple payback does not discount cash flows at all.
When return percentage matters, internal rate of return provides a different perspective from simple recovery time.
Payback Period vs Profitability Index
The workbook maps profitability index directly to this article.
A common profitability-index formula is:
Profitability Index = Present Value of Future Cash Flows ÷ Initial Investment
Payback measures time.
Profitability index measures discounted value per unit of initial investment.
Suppose:
Project A pays back in 2 years but has PI of 1.05.
Project B pays back in 4 years but has PI of 1.40.
Project A returns capital faster.
Project B produces more discounted value relative to the capital invested.
Neither measure should automatically replace the other.
Payback Period vs ROI
ROI focuses on return relative to investment rather than how quickly the investment is recovered.
A basic ROI formula is:
ROI = Profit or Gain ÷ Investment Cost × 100
Suppose a $100,000 project generates $25,000 annually for four years and then stops.
Simple payback:
4 Years
Suppose another $100,000 project pays back in five years but eventually generates $250,000 of total net economic gain over a much longer life.
The second project has slower payback but can have much stronger lifetime ROI.
Time to recovery and total return are different investment characteristics.
Payback Period vs Profit
The workbook also maps the broader profit concept.
Profit measures the excess of revenue or proceeds over the applicable costs.
Payback measures how long cumulative cash benefits take to recover an initial investment.
Suppose an investment produces $20,000 of annual accounting profit but $35,000 of annual cash inflow because depreciation and working-capital effects differ from accounting earnings.
Using the $20,000 accounting-profit figure in a payback calculation could produce the wrong result.
Payback should generally be built from the relevant cash flows, not merely accounting profit.
Payback Period vs Operating Profit
The workbook maps operating profit directly to this page.
An investment can improve operating profit without creating an identical amount of annual cash flow.
Suppose new equipment costs $500,000 and increases annual operating profit by $100,000.
It may be tempting to calculate:
$500,000 ÷ $100,000 = 5 Years
But that is not necessarily the true cash payback.
The investment may affect depreciation, taxes, working capital, maintenance spending, and other cash flows.
Use the investment’s incremental cash benefit rather than automatically substituting accounting operating profit.
Payback Period vs Operating Margin
Operating margin measures operating profit as a percentage of revenue.
Payback measures capital-recovery time.
Suppose automation improves operating margin from 10% to 15%.
That tells management the business is generating more operating profit per revenue dollar.
It does not reveal how long the cash benefits take to recover the cost of the automation.
The investment could improve margin substantially but still require a long payback if the upfront expenditure is very large.
Payback Period and Operating Leverage
The workbook’s fifth mapped neighbor, operating leverage, can affect the uncertainty of a project’s expected cash benefits.
Suppose a capacity expansion requires substantial fixed operating costs.
If projected sales arrive, operating profit and cash generation may increase rapidly.
If demand falls short, the fixed-cost commitment can produce much weaker results.
A payback forecast based on one sales assumption can therefore be misleading when the project’s economics have high operating sensitivity.
Scenario analysis becomes particularly important.
Payback Period and Operating Cash Flow
Operating cash flow can provide useful inputs for investment analysis, but company-wide OCF should not automatically be used as the cash flow of one specific project.
Payback should use incremental cash flows attributable to the decision.
If a project increases company operating cash flow by $150,000 annually but requires $1 million upfront:
Simple Payback ≈ $1,000,000 ÷ $150,000
Simple Payback ≈ 6.67 Years
However, capital expenditures, working-capital effects, taxes, maintenance, and other project-specific cash movements may need to be included before that $150,000 is accepted as the correct benefit.
Payback Period and Free Cash Flow
Free cash flow can be closer to the economic perspective required for some capital-allocation decisions because it considers capital spending under its applicable definition.
However, company-wide free cash flow is still not automatically the same as project cash flow.
For a project payback calculation, include only the cash flows that occur because the company accepts the investment.
This incremental approach prevents unrelated company cash flows from distorting the result.
Payback Period and Cash Flow Forecasting
Cash flow forecasting is critical when future benefits are uneven.
Suppose a project is expected to generate:
Year 1 = $20,000
Year 2 = $50,000
Year 3 = $100,000
Year 4 = $150,000
The average annual inflow is:
$80,000
But simply dividing investment cost by the average could give a misleading payback because the cash does not arrive evenly.
The actual sequence matters.
Payback should be calculated from the forecast period by period.
Payback Period and Working Capital
Working capital can materially affect project payback.
Suppose a new product requires:
Equipment = $500,000
Additional inventory and receivables = $150,000
The total initial cash commitment may be closer to:
$500,000 + $150,000 = $650,000
If the payback model includes only the equipment cost, it understates the capital that needs to be recovered.
Likewise, some working capital may eventually be recovered when a project ends.
That later recovery may matter to full NPV analysis even if it occurs after the simple payback date.
Payback Period and Initial Investment
Defining the initial investment correctly is essential.
For equipment, the initial outlay may include more than purchase price.
Economically relevant cash costs can include installation, transportation, implementation, training, integration, setup, and incremental working capital.
Suppose:
Equipment price = $400,000
Installation = $50,000
Implementation = $30,000
Working-capital requirement = $20,000
Total initial investment:
$400,000 + $50,000 + $30,000 + $20,000
Total Initial Investment = $500,000
If annual cash benefits are $125,000:
Payback = $500,000 ÷ $125,000
Payback = 4 Years
Using only the $400,000 equipment invoice would incorrectly suggest a 3.2-year payback.
Payback Period and Maintenance Costs
Cash benefits should generally be calculated net of incremental operating costs.
Suppose a new machine saves $100,000 of labor annually but adds $20,000 of maintenance costs.
Net annual cash benefit is:
$100,000 − $20,000 = $80,000
If the machine costs $320,000:
Payback Period = $320,000 ÷ $80,000
Payback Period = 4 Years
Using the $100,000 gross savings would produce:
3.2 Years
That would overstate the speed of recovery.
Payback Period and Taxes
Taxes can affect investment cash flows, so a before-tax payback and after-tax payback may differ.
Suppose a project produces accounting earnings, depreciation deductions, asset-sale tax consequences, or other taxable effects.
Those items can change the cash actually retained.
For serious capital budgeting, the cash-flow basis and tax treatment should be internally consistent.
A simple screening model may use pretax cash flows, but the result should be labeled accordingly rather than presented as a complete after-tax investment analysis.
Payback Period and Depreciation
Depreciation is an accounting expense rather than a direct annual cash payment.
Therefore, simply subtracting depreciation from cash benefits can distort a payback calculation.
However, depreciation can affect taxes, and those tax effects may affect cash.
Suppose equipment costs $500,000 and generates $150,000 of annual operating cash benefit before tax.
The annual depreciation recorded on the income statement does not itself represent another cash outflow.
A detailed after-tax payback model should capture the tax consequences rather than treating depreciation as though the equipment were purchased again each year.
Payback Period and Salvage Value
An investment may have resale or salvage value at the end of its useful life.
If the salvage proceeds occur before the project otherwise pays back, they can affect the recovery period.
If they occur long after the payback date, simple payback will generally ignore them because the investment has already been recovered.
This is another limitation of payback.
A project with substantial terminal value can be economically attractive even if its simple payback is relatively long.
NPV captures later discounted value more comprehensively.
Payback Period and Project Life
A payback period should be compared with the investment’s expected economic life.
Suppose:
Project life = 3 years
Payback period = 5 years
Under the stated assumptions, the project does not recover its initial cost before its useful economic life ends.
Now suppose:
Project life = 20 years
Payback period = 5 years
The investment has approximately 15 years after payback in which it can potentially continue generating benefits.
Therefore, the same five-year payback can have very different implications depending on project life.
Payback Period and Technology Risk
A long payback can be particularly concerning when technology may become obsolete quickly.
Suppose software infrastructure requires a seven-year payback but is likely to need major replacement after four years.
The forecast requires careful scrutiny.
By contrast, a seven-year payback on infrastructure expected to operate reliably for 30 years may have a very different risk profile.
Recovery time should therefore be interpreted relative to the durability of the underlying asset or project.
Payback Period and Liquidity
A shorter payback can be attractive to businesses with limited liquidity ratios or scarce access to financing because capital returns to the business sooner.
However, payback should not be confused with liquidity itself.
A company could approve several individually fast-payback investments at once and still experience short-term cash pressure because the initial expenditures all occur immediately.
Investment selection and company-wide liquidity planning should therefore be coordinated.
Payback Period and Business Valuation
Business valuation usually requires a broader view than payback.
A business can take years to return an acquisition price but continue generating cash for decades.
Ignoring the cash flows after the payback date would omit much of the economic value.
For acquisitions and long-lived businesses, discounted cash-flow approaches, comparable valuations, and other methods are therefore generally more informative than payback alone.
Payback can still provide a useful perspective on capital recovery.
Payback Period for Rental Property
The concept can also be applied to rental property returns when an investor wants to estimate how long cumulative property cash flows take to recover the initial equity invested.
Suppose:
Initial equity investment = $100,000
Annual net property cash flow = $10,000
Ignoring changes in cash flow, financing complexities, taxes, appreciation, and sale proceeds:
Simple Payback = $100,000 ÷ $10,000
Simple Payback = 10 Years
However, property investments often derive substantial value from eventual sale proceeds and changing rents.
A simple ten-year payback therefore does not describe the full property return.
Payback Period for a Startup Investment
Startup valuation and startup investment analysis can involve highly uncertain cash flows.
A startup may consume cash for several years before generating positive distributions.
A traditional payback estimate can therefore become highly speculative.
Suppose an investor contributes $500,000 and expects no return for four years, followed by uncertain future distributions.
The timing and probability of those outcomes matter greatly.
A single payback number can hide substantial uncertainty.
Scenario analysis is more useful than presenting one forecast as though it were guaranteed.
Payback Period and Capital Constraints
Payback becomes particularly attractive as a screening metric when a company has limited capital and needs it returned quickly.
Suppose management can fund only one of several projects.
A shorter-payback project can recycle cash sooner into future investments.
However, a strict payback cutoff can also cause the company to reject long-lived investments that create substantial economic value after the cutoff date.
Capital constraints therefore make payback more relevant, but they do not eliminate the need for NPV and strategic analysis.
Payback Period Decision Rule
Some businesses establish a maximum acceptable payback.
For example:
Accept if Payback Period ≤ Required Maximum
Reject or Review if Payback Period > Required Maximum
If management requires recovery within four years:
Project A payback = 2.8 years → passes the screen.
Project B payback = 3.9 years → passes the screen.
Project C payback = 5.1 years → fails the screen.
This type of rule is simple and easy to communicate.
However, the cutoff is a management policy rather than a universal law of finance.
A project failing the payback screen can still have strongly positive NPV.
Why Payback Period Is Useful
Payback remains popular because it is intuitive.
Decision-makers can understand “three years to recover the investment” immediately.
It also focuses attention on near-term cash generation.
That can be useful when:
capital is scarce;
uncertainty rises sharply over time;
technology changes quickly;
management needs rapid screening;
liquidity is important; or
many small projects must be compared initially.
The calculation requires fewer assumptions than a full discounted cash-flow model.
Its simplicity is both its strength and its weakness.
Why Payback Period Can Be Misleading
Suppose two investments cost $100,000.
Project A:
Year 1 = $50,000
Year 2 = $50,000
Nothing afterward
Payback:
2 Years
Project B:
Year 1 = $40,000
Year 2 = $40,000
Year 3 = $40,000
Years 4–10 = $40,000 each
Payback:
2.5 Years
A simple payback ranking prefers Project A.
But Project B generates far more total cash over its life.
Without examining post-payback cash flows, the ranking can be economically misleading.
Simple Payback Ignores the Time Value of Money
This is the most widely recognized limitation of simple payback.
Suppose an investment returns:
Year 1 = $50,000
Year 2 = $50,000
Another returns:
Year 1 = $0
Year 2 = $100,000
Both recover $100,000 within two years.
Simple payback can make them appear similar.
Yet the first project returns half the capital one year earlier.
Present-value analysis recognizes that timing difference.
Simple payback does not fully do so.
Discounted payback partially corrects the problem.
Payback Ignores Cash Flows After Recovery
This limitation remains even with discounted payback.
Once cumulative discounted cash flows have recovered the investment, subsequent project cash flows no longer affect the payback period.
A project producing $1 million after payback and one producing nothing after payback could therefore report the same recovery time.
For maximizing total value, NPV is more comprehensive because it considers the full modeled cash-flow stream.
Payback Does Not Measure Profitability Directly
A short payback does not necessarily imply a high lifetime profit.
Suppose a project costs $100,000 and returns $55,000 in each of the first two years, then ends.
Its payback is under two years.
Total excess cash before considering discounting is only $10,000.
Another project may require four years to pay back but ultimately produce several hundred thousand dollars of additional cash.
Recovery speed and lifetime profitability are different characteristics.
Payback Does Not Provide a Required Return
The simple payback method does not explicitly incorporate a required rate of return.
A company requiring 15% annual returns and another requiring 5% could calculate the same simple payback period for an identical project.
Discounted payback can introduce a discount rate, but even then the metric only identifies recovery time rather than total value created at that rate.
This is another reason to combine it with NPV.
Payback Period With Monthly Cash Flows
Payback does not have to be expressed only in years.
Suppose an investment costs $120,000 and generates $10,000 per month.
Payback Period = $120,000 ÷ $10,000
Payback Period = 12 Months
If monthly cash flows vary, accumulate them month by month until cumulative recovery reaches $120,000.
Using the same period for both investment benefits and the final result prevents unit errors.
Payback Period With Quarterly Cash Flows
Suppose a $300,000 investment generates $50,000 per quarter.
Payback = $300,000 ÷ $50,000
Payback = 6 Quarters
Convert to years if desired:
6 ÷ 4 = 1.5 Years
The mathematical process is unchanged.
The key is matching the investment amount with cash flows measured consistently over the relevant periods.
Example: Comparing Three Projects
Suppose a business is evaluating three $200,000 projects.
Project A
Annual cash inflow = $100,000
Payback = 2 Years
Project B
Annual cash inflow = $80,000
Payback = 2.5 Years
Project C
Annual cash inflow = $50,000
Payback = 4 Years
Based only on payback:
A ranks first, B second, C third.
However, imagine Project A ends after Year 3 while Project C generates $50,000 annually for 20 years.
The ranking could look very different under NPV or lifetime cash-flow analysis.
Payback provides one dimension, not the complete ranking.
Common Payback Period Mistakes
One of the most common errors is using accounting profit rather than cash flow.
Another is using the simple initial-investment-divided-by-average-cash-flow formula when annual cash flows are uneven.
A third mistake is forgetting incremental working-capital requirements or implementation costs in the initial investment.
Users may also calculate simple payback and assume it accounts for the time value of money.
It does not.
Another error is interpreting a short payback as proof of high profitability.
Finally, comparing projects solely by payback can ignore enormous differences in cash flows after recovery.
Limitations of the Payback Period
The payback period is easy to calculate and communicate, but it has several important limitations.
Simple payback does not discount future cash flows.
It generally ignores cash flows after recovery.
It does not directly measure total profitability.
It does not provide a dollar value of wealth creation.
It does not inherently incorporate a required return.
Results depend on the quality of the cash-flow forecast.
Fractional-year calculations may assume cash arrives evenly within a period when it does not.
A management cutoff can also be arbitrary.
These limitations make payback more suitable as a screening and risk-oriented measure than as the sole basis for major capital-allocation decisions.
How to Analyze Payback Period Properly
Begin by identifying the complete incremental initial cash investment.
Then forecast the incremental cash benefits and costs period by period.
If cash flows are equal, calculate:
Payback = Initial Investment ÷ Annual Net Cash Inflow
If cash flows vary, accumulate them sequentially.
Identify when cumulative cash flow turns from negative to zero or positive.
For more rigorous analysis, calculate discounted payback using an appropriate discount rate.
Then compare the investment with NPV, IRR, profitability index, and other relevant metrics.
Finally, test different scenarios.
If a project has a 3.2-year payback only when sales meet an aggressive forecast, that uncertainty should be visible.
A useful payback calculation is not merely a formula. It is a transparent cash-recovery model.
Why the Payback Period Matters
The payback period answers one of the most practical investment questions:
How long will our money remain tied up before the project earns it back?
For equal annual cash flows:
Payback Period = Initial Investment ÷ Annual Net Cash Inflow
For uneven cash flows:
Payback = Full Years Before Recovery + Remaining Unrecovered Investment ÷ Cash Flow During Recovery Period
Its simplicity makes payback valuable for screening investments, understanding capital recovery, and comparing near-term cash exposure.
Yet that simplicity creates important blind spots.
Simple payback ignores discounting.
Payback ignores cash generated after recovery.
It does not calculate total value creation or required return.
For meaningful capital budgeting, use the payback period as one lens alongside NPV, IRR, profitability index, cash-flow forecasting, and strategic analysis.
Frequently Asked Questions
What is the payback period in simple terms?
The payback period is the amount of time required for an investment’s cumulative cash inflows to recover its initial cash cost.
What is the payback period formula?
For equal annual cash inflows:
Payback Period = Initial Investment ÷ Annual Net Cash Inflow
If a project costs $100,000 and generates $25,000 annually, the payback period is four years.
How do you calculate payback with uneven cash flows?
Add each period’s cash flow cumulatively until the initial investment is almost recovered. Then divide the remaining unrecovered amount by the cash flow expected during the recovery period to estimate the fractional period.
What does a 5-year payback period mean?
It means cumulative project cash inflows are expected to recover the initial investment after approximately five years.
Is a shorter payback period better?
A shorter payback returns invested capital sooner, which can reduce exposure and improve capital flexibility. However, it does not necessarily mean the project creates more total value or profit.
What is a good payback period?
There is no universal good payback period. The appropriate threshold depends on risk, project life, capital availability, business strategy, uncertainty, technology, and management’s investment criteria.
What is the difference between simple and discounted payback?
Simple payback uses undiscounted cash flows. Discounted payback first reduces future cash flows to present value using a discount rate, then measures how long the discounted amounts take to recover the investment.
Does payback period consider the time value of money?
Simple payback does not. Discounted payback does.
Does payback period include cash flows after payback?
No. Once the initial investment has been recovered, later cash flows generally do not change the project’s payback period. This is one of the metric’s main limitations.
What is the difference between payback period and NPV?
Payback measures recovery time. NPV measures the dollar value created by the full discounted cash-flow stream relative to the investment.
Can a project with a longer payback be better?
Yes. A longer-payback project can produce substantially greater cash flows after recovery and therefore have higher NPV, greater lifetime profit, or stronger overall investment economics.
Should payback use profit or cash flow?
Payback should generally use the incremental cash flows attributable to the investment rather than simply substituting accounting profit. Depreciation, working capital, taxes, capital expenditure, and other timing effects can cause profit and cash flow to differ.




