


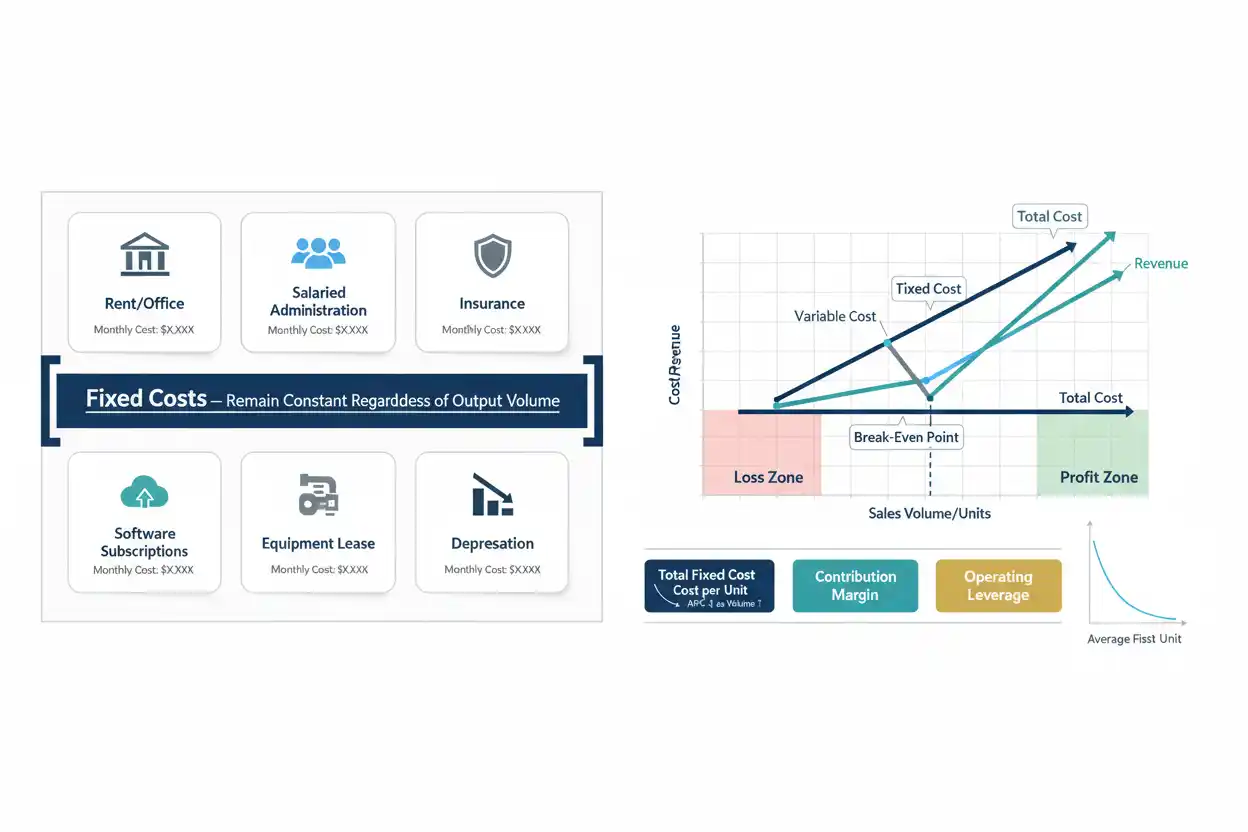
Fixed costs are business costs that do not change directly with the level of output or sales volume within a defined period and relevant operating range.
Common examples can include contractual rent, certain salaried positions, insurance premiums, software subscriptions, property-related costs, depreciation, and other commitments that remain substantially unchanged whether the business produces 1,000 units or 1,500 units during the period.
A simple fixed-cost relationship is:
Total Fixed Costs = Total Costs − Total Variable Costs
Suppose a company incurs $500,000 of total operating costs while $320,000 varies directly with production.
Total Fixed Costs = $500,000 − $320,000
Total Fixed Costs = $180,000
The business therefore has $180,000 of fixed costs under the cost classification used.
Fixed costs matter because they create a minimum operating-cost burden before the business generates profit. They directly affect break-even analysis, operating leverage, pricing decisions, cash requirements, and the amount of sales needed to cover the operating structure.
Within business finance, fixed costs should be analyzed together with variable costs, contribution margin, margins, cash flow, and the company’s capacity assumptions rather than treated as expenses that literally never change.
What Are Fixed Costs?
Fixed costs remain stable in total when activity changes within an expected operating range.
Suppose a warehouse lease costs $20,000 per month.
The business pays $20,000 whether it ships:
10,000 units,
15,000 units,
or 20,000 units,
provided those volumes can all be handled within the same facility and contract.
The lease is therefore fixed relative to unit volume within that range.
However, if sales grow enough that the company needs a second warehouse, total rent can rise.
This illustrates a central principle:
Fixed does not mean permanent.
It means the cost does not vary directly with activity within the time period and capacity range being analyzed.
Fixed Costs Formula
When total cost and variable cost are known:
Fixed Costs = Total Costs − Variable Costs
Suppose total monthly operating costs equal $250,000 and variable costs equal $160,000.
Fixed Costs = $250,000 − $160,000
Fixed Costs = $90,000
Another useful total-cost formula is:
Total Cost = Fixed Costs + Variable Costs
If fixed costs are $90,000 and variable costs total $160,000:
Total Cost = $90,000 + $160,000
Total Cost = $250,000
The distinction becomes particularly useful when building cost-volume-profit models.
Fixed Cost Per Unit Formula
Total fixed costs may stay constant, but fixed cost per unit changes as production volume changes.
The formula is:
Fixed Cost per Unit = Total Fixed Costs ÷ Units Produced
Suppose monthly fixed costs are $100,000.
At 10,000 units:
Fixed Cost per Unit = $100,000 ÷ 10,000
= $10 per unit
At 20,000 units:
Fixed Cost per Unit = $100,000 ÷ 20,000
= $5 per unit
The total fixed cost remained $100,000.
The fixed cost allocated to each unit fell because more units shared the same cost base.
This is one source of operating scale.
Average Fixed Cost
Average fixed cost uses the same economic relationship:
Average Fixed Cost = Total Fixed Cost ÷ Quantity Produced
Suppose fixed costs equal $60,000.
At 3,000 units:
Average Fixed Cost = $20
At 6,000 units:
Average Fixed Cost = $10
At 12,000 units:
Average Fixed Cost = $5
Average fixed cost therefore declines as quantity increases while total fixed cost remains unchanged.
It should not be confused with the total fixed-cost obligation the company actually needs to pay.
Fixed Costs vs Variable Costs
Variable costs change with activity.
If a business uses $20 of materials for every unit produced, material cost increases as production rises.
At 1,000 units:
Variable Cost = 1,000 × $20
= $20,000
At 5,000 units:
Variable Cost = 5,000 × $20
= $100,000
A fixed warehouse lease can remain $30,000 at both production levels.
Therefore:
Fixed costs remain stable in total within the relevant range.
Variable costs change with activity.
This distinction is essential to contribution-margin and break-even analysis.
Fixed Cost Example
Consider a small manufacturer with monthly expenses of:
Factory lease = $25,000
Salaried plant manager = $8,000
Insurance = $3,000
Software and systems = $2,000
Equipment depreciation = $7,000
Assuming these costs remain fixed relative to output during the month:
Total Fixed Costs = $25,000 + $8,000 + $3,000 + $2,000 + $7,000
Total Fixed Costs = $45,000
If the company produces 9,000 units:
Fixed Cost per Unit = $45,000 ÷ 9,000
= $5
If production rises to 15,000 units without requiring additional fixed capacity:
Fixed Cost per Unit = $45,000 ÷ 15,000
= $3
The company spreads the same fixed-cost base over more output.
Examples of Fixed Costs
Whether a cost is fixed depends on the specific business and time horizon, but common examples can include rent, property leases, salaried administrative staff, insurance, certain licenses, base software subscriptions, contracted security, depreciation, and some equipment leases.
Consider a company paying $5,000 per month for accounting software under a fixed enterprise contract.
If the monthly charge remains the same while sales volume changes, it behaves as a fixed cost for that analysis.
However, if the software provider charges per transaction, part or all of the expense may become variable.
Classification should follow actual cost behavior rather than the name of the expense.
Rent as a Fixed Cost
Rent is one of the clearest examples.
Suppose a retailer signs a five-year lease for $15,000 per month.
Monthly sales may be:
$100,000 in January,
$180,000 in February,
$130,000 in March.
The contractual rent remains $15,000.
It is therefore fixed relative to sales within the contract and capacity assumptions.
Yet rent can change after renegotiation, renewal, relocation, expansion, or the addition of another location.
Salaries as Fixed Costs
Some salaries behave as fixed costs.
A finance director earning $12,000 per month may receive the same salary whether the company sells 5,000 or 7,000 units.
That salary is fixed relative to short-term sales volume.
However, labor classification requires care.
Hourly production labor may vary with output.
Sales commissions can vary with revenue.
Overtime can increase when production rises.
A salaried department may also require additional employees once activity exceeds existing capacity.
Therefore, salary does not automatically mean fixed.
Insurance as a Fixed Cost
Insurance premiums often behave as fixed costs during a policy period.
Suppose annual business insurance costs $36,000.
Ignoring timing differences:
Monthly Fixed Insurance Cost = $36,000 ÷ 12
= $3,000
Sales fluctuations do not ordinarily change the contractual monthly allocation immediately.
However, insurance costs can change when coverage limits, payroll, asset values, locations, claims history, or renewal pricing change.
Depreciation as a Fixed Cost
Depreciation often behaves like a fixed accounting expense within a short-term cost-volume model.
Suppose equipment generates $120,000 of annual straight-line depreciation.
Monthly depreciation is approximately:
Monthly Depreciation = $120,000 ÷ 12
= $10,000
The expense can remain $10,000 whether production is 20,000 or 25,000 units.
However, depreciation can depend on the accounting method used, asset additions, disposals, impairment, or usage-based methods.
It should therefore be classified according to the actual analytical context.
Fixed Costs and Total Cost
The total cost relationship is:
Total Cost = Fixed Cost + Variable Cost
Suppose fixed costs are $100,000 and variable cost per unit is $12.
At 10,000 units:
Total Variable Cost = 10,000 × $12
= $120,000
Therefore:
Total Cost = $100,000 + $120,000
= $220,000
At 20,000 units:
Total Variable Cost = $240,000
Total Cost = $100,000 + $240,000
= $340,000
Total cost rises, but not as rapidly as output because the $100,000 fixed portion remains unchanged.
Fixed Costs and Contribution Margin
Contribution margin measures how much revenue remains after variable costs to cover fixed costs and then profit.
Contribution Margin = Revenue − Variable Costs
Suppose monthly revenue equals $400,000 and variable costs equal $240,000.
Contribution Margin = $160,000
If fixed costs are $100,000:
Operating Profit = $160,000 − $100,000
= $60,000
The contribution margin first covers the $100,000 fixed-cost requirement.
Only the amount beyond fixed costs becomes operating profit under the simplified model.
Fixed Costs and Break-Even Point
The break-even point is reached when total contribution equals total fixed costs.
For unit sales:
Break-Even Units = Fixed Costs ÷ Contribution Margin per Unit
Suppose:
Fixed costs = $120,000
Selling price per unit = $50
Variable cost per unit = $30
Contribution per unit:
Contribution Margin per Unit = $50 − $30
= $20
Break-even units:
Break-Even Units = $120,000 ÷ $20
= 6,000 units
The business needs to sell 6,000 units to cover its modeled fixed and variable operating costs.
How Higher Fixed Costs Change Break-Even
Suppose contribution margin per unit remains $20 but fixed costs rise from $120,000 to $180,000.
Old break-even:
$120,000 ÷ $20 = 6,000 units
New break-even:
$180,000 ÷ $20 = 9,000 units
The company must sell another 3,000 units before reaching break-even.
Higher fixed costs therefore increase the minimum contribution required before operating profit begins.
How Lower Fixed Costs Change Break-Even
Now suppose management reduces fixed costs to $80,000.
Break-Even Units = $80,000 ÷ $20
= 4,000 units
The business reaches operating break-even at a lower volume.
However, cost reduction should not be evaluated mechanically.
Cutting useful capacity, maintenance, product development, or staff can lower the break-even threshold while damaging revenue and long-term competitiveness.
Fixed Costs and Operating Leverage
Operating leverage describes how a fixed operating-cost structure can amplify changes in operating profit when sales change.
A company with high fixed costs and lower variable costs can generate substantial incremental profit after crossing break-even.
However, that same fixed-cost base creates downside risk when sales decline.
Consider two businesses each earning $100,000 of EBIT.
Company A has low fixed costs.
Company B has high fixed costs but strong contribution margin.
If revenue declines, Company B’s fixed costs remain, potentially causing a much larger percentage decline in EBIT.
That is the core operating-leverage effect.
Degree of Operating Leverage
One simplified formula is:
Degree of Operating Leverage = Contribution Margin ÷ EBIT
Suppose:
Contribution margin = $500,000
EBIT = $200,000
DOL = $500,000 ÷ $200,000
DOL = 2.5
A 1% change in sales is associated with an approximately 2.5% change in EBIT at that operating level, assuming the underlying cost relationships remain stable.
Fixed operating costs help create that sensitivity.
Fixed Costs vs Financial Leverage
The preceding financial leverage article concerns fixed financing costs such as interest.
Fixed operating costs occur before EBIT.
Fixed financing costs occur below EBIT.
For example:
Factory rent affects operating profit.
Interest on bank debt affects earnings after operating profit.
This distinction matters because the two types of fixed commitments create different forms of leverage.
Operating fixed costs create operating leverage.
Fixed financing costs create financial leverage.
Fixed Costs and Combined Leverage
The degree of combined leverage brings operating and financial leverage together.
The sequence is:
Sales → Contribution → Fixed Operating Costs → EBIT → Interest → Earnings to Equity
A company with substantial fixed operating costs and substantial debt can therefore experience two layers of earnings sensitivity.
Small sales changes can produce much larger percentage changes in earnings available to shareholders.
Fixed Costs and EBIT
EBIT reflects operating earnings after relevant operating expenses, including fixed operating costs.
Under a simplified contribution model:
EBIT = Contribution Margin − Fixed Operating Costs
Suppose contribution margin equals $900,000 and fixed operating costs equal $600,000.
EBIT = $300,000
If contribution increases by $100,000 while fixed costs remain constant:
New EBIT = $400,000
Contribution increased approximately 11.1%, but EBIT increased 33.3%.
That is operating leverage in action.
Fixed Costs and EBITDA
EBITDA can include many fixed operating expenses while adding back depreciation and amortization.
Suppose a business has substantial fixed payroll, rent, and software expenses.
Those costs still reduce EBITDA.
Depreciation on equipment, however, is added back when moving from EBIT to EBITDA.
Therefore, not every fixed cost is excluded from EBITDA.
This distinction prevents a common misconception that EBITDA represents earnings before fixed costs.
It does not.
Fixed Costs and Gross Profit
Gross profit does not necessarily show the full fixed-cost burden.
Some fixed manufacturing costs can be included in cost of goods sold under applicable accounting treatment, while many administrative, selling, and corporate fixed expenses appear below gross profit.
A business can therefore have attractive gross profit yet weak operating profit because overhead is substantial.
Gross profit should be connected with the full operating cost structure.
Fixed Costs and Gross Margin
Gross margin measures gross profit relative to revenue.
Suppose a company earns a 60% gross margin.
That sounds strong.
However, fixed operating costs equal 55% of revenue.
Only a small portion remains as operating profit.
A high gross margin therefore does not guarantee strong economics when the fixed-cost base is heavy.
Fixed Costs and Operating Margin
Operating margin captures the effect of broader operating expenses.
Suppose revenue equals $1 million.
Contribution before fixed costs equals $400,000.
Fixed operating costs equal $300,000.
Operating Profit = $100,000
Operating Margin = $100,000 ÷ $1,000,000
= 10%
If sales grow while fixed costs remain stable, operating margin can expand because the fixed-cost burden becomes smaller relative to revenue.
Fixed Costs and Scale
Fixed costs create potential economies of scale.
Suppose a company’s fixed operating infrastructure costs $1 million annually.
At $5 million of revenue:
Fixed-Cost Ratio = $1 million ÷ $5 million
= 20%
At $10 million of revenue with no increase in fixed cost:
Fixed-Cost Ratio = $1 million ÷ $10 million
= 10%
The same infrastructure consumes half as much revenue proportionately.
However, this benefit persists only while the existing capacity can support additional activity.
Relevant Range
The relevant range is the activity range over which the assumed cost behavior remains reasonably valid.
Suppose one facility can handle up to 100,000 units per month.
Monthly facility rent is $50,000.
Between 20,000 and 100,000 units, that rent may remain fixed.
At 110,000 units, the company needs another facility costing $35,000.
Total rent becomes:
New Total Fixed Rent = $50,000 + $35,000
= $85,000
The original $50,000 fixed-cost assumption no longer applies beyond the relevant range.
Step Costs
Some fixed costs behave as step costs.
They remain fixed across one activity range and then jump to another level.
Suppose one supervisor can manage up to 20 employees.
Supervisor salary = $70,000 annually.
At 20 employees:
Supervision Cost = $70,000
At 21 employees, management hires a second supervisor:
Supervision Cost = $140,000
The cost did not rise gradually with every worker.
It changed in a step.
This is common in staffing, facilities, equipment capacity, and logistics.
Committed Fixed Costs
Some fixed costs arise from long-term commitments.
Examples can include long-term property leases, core management salaries, major equipment commitments, or infrastructure contracts.
These costs can be difficult to reduce quickly without operational disruption or contractual penalties.
A business with substantial committed fixed costs therefore has less short-term flexibility when revenue falls.
Discretionary Fixed Costs
Other fixed costs are more discretionary.
Management can often change spending on advertising programs, certain consulting arrangements, training, research initiatives, or other planned expenditures.
However, “discretionary” does not mean economically unnecessary.
Cutting marketing or product development can improve short-term profit while weakening future revenue.
Cost flexibility should be evaluated strategically.
Fixed Costs and Sunk Costs
A fixed cost is not automatically a sunk cost.
Fixed refers to how a cost behaves as activity changes.
Sunk refers to whether the cost has already been incurred and cannot be recovered.
A future annual lease payment can be fixed but not yet sunk if the company has options to terminate or avoid it.
Money already spent on a failed project can be sunk even though it was not a recurring fixed operating cost.
The concepts answer different questions.
Fixed Costs and Direct Costs
A fixed cost can be direct or indirect depending on what is being measured.
Suppose a machine is dedicated exclusively to one product line and generates fixed depreciation.
For that product line, the depreciation can be a direct fixed cost.
Corporate headquarters rent may be an indirect fixed cost allocated across multiple divisions.
Therefore:
Fixed vs variable describes cost behavior.
Direct vs indirect describes traceability.
Fixed Costs and Product Pricing
Pricing needs to support the entire economic structure over time.
A company can price above variable cost and still lose money if total contribution does not cover fixed costs.
Suppose:
Selling price = $80
Variable cost = $50
Contribution Margin = $30 per unit
At 5,000 units:
Total Contribution = $150,000
If fixed costs are $200,000:
Operating Result = $150,000 − $200,000
= −$50,000
The product produces positive contribution on every unit but the company still loses money at that sales volume.
Fixed Costs and Cost-Plus Pricing
Cost-plus pricing can incorporate fixed overhead in different ways depending on the selected cost base.
Suppose a company allocates $10 of fixed overhead per unit based on expected volume.
If actual production is far below forecast, real fixed cost per unit becomes higher.
That can make a seemingly adequate markup insufficient.
Pricing models should therefore test volume assumptions rather than treating allocated fixed cost per unit as permanently constant.
Fixed Costs and Target Pricing
Target pricing can work backward from a competitive selling price and required profit to determine the allowable cost structure.
Suppose the market price is $100 and the company wants $20 of operating profit per unit at expected volume.
The combination of variable cost and allocated fixed cost must fit within the remaining $80.
If fixed costs are too high for expected volume, management may need greater scale, lower overhead, stronger contribution, or a different operating model.
Fixed Costs and Profit
Profit begins only after contribution covers the fixed-cost base under the simplified model.
Suppose:
Contribution = $500,000
Fixed costs = $500,000
Operating Profit = $0
Contribution rises to $600,000.
Operating Profit = $100,000
A 20% increase in contribution produced the first $100,000 of operating profit because the original contribution was entirely absorbed by fixed costs.
This threshold effect makes fixed-cost structure critical to profitability.
Fixed Costs and Margin of Safety
A company’s margin of safety reflects how far actual or forecast sales sit above break-even sales.
Higher fixed costs generally increase break-even sales and can reduce the margin of safety when other variables stay constant.
Suppose actual sales equal 10,000 units and break-even is 6,000 units.
Margin of Safety = 10,000 − 6,000
= 4,000 units
If fixed costs rise and break-even increases to 8,000 units:
New Margin of Safety = 2,000 units
The company has less room for sales to decline before reaching break-even.
Fixed Costs and Free Cash Flow
Free cash flow can be affected by fixed cash commitments, but accounting fixed costs and cash payments are not always identical.
Depreciation can be a fixed accounting cost without a current-period cash payment.
Rent and salaries are typically cash expenses.
Capital expenditure can require large cash outflows without appearing immediately as an operating fixed expense.
Therefore, fixed-cost analysis should distinguish accounting expense behavior from cash commitments.
Fixed Costs and Operating Cash Flow
Operating cash flow becomes particularly important when fixed cash expenses are large.
A company may need to pay rent, payroll, software, insurance, and other commitments every month even when customers pay slowly.
Weak cash collection can therefore create liquidity pressure before accounting profitability fully deteriorates.
The company needs enough operating cash to support its fixed cash burden.
Fixed Costs and Cash Flow Forecasting
Cash flow forecasting is useful because many fixed costs have predictable payment dates.
For example:
Rent may be due monthly.
Insurance may be paid quarterly or annually.
Software may be billed annually.
Salaries may be paid biweekly or monthly.
Debt-related fixed financing costs follow separate schedules.
A forecast translates the accounting cost structure into the actual timing of cash requirements.
Fixed Costs and Burn Rate
For cash-consuming companies, fixed cash costs can create a baseline burn rate.
Suppose a startup has:
Payroll = $150,000 per month
Rent = $20,000
Software = $15,000
Insurance and administration = $15,000
The fixed cash burden is approximately:
Monthly Fixed Cash Costs = $200,000
Before variable costs or revenue are considered, the company already needs roughly $200,000 of monthly cash to support that structure.
Reducing burn can therefore require changes to fixed commitments as well as variable spending.
Fixed Costs and Cash Runway
Cash runway depends heavily on the fixed cost structure when revenue is limited.
Suppose a company has $2 million of cash and $250,000 of monthly net burn.
Runway = $2,000,000 ÷ $250,000
= 8 months
Management reduces recurring fixed cash costs by $50,000 while everything else remains stable.
New burn:
$200,000 per month
New runway:
$2,000,000 ÷ $200,000
= 10 months
Reducing fixed commitments extended modeled runway by two months.
Fixed Costs and Financial Leverage
Operating fixed costs and financing fixed costs can interact.
Suppose a business has expensive facilities and substantial interest expense.
When sales decline, fixed operating costs reduce EBIT.
The company must then pay interest from the smaller EBIT amount.
This combination can create substantial earnings volatility.
That is why the fixed-cost structure should be considered before adding more debt.
Fixed Costs and the Equity Multiplier
The equity multiplier measures assets relative to shareholder equity.
A company can increase fixed costs by acquiring new facilities or equipment financed with liabilities.
The transaction can simultaneously increase operating commitments and balance-sheet leverage.
However, the two measures remain conceptually separate.
The equity multiplier describes financing structure.
Fixed costs describe cost behavior.
Fixed Costs and Economic Value Added
Economic value added asks whether after-tax operating profit exceeds the required capital charge.
Reducing unnecessary fixed expenses can raise operating profit and therefore potentially increase EVA.
However, eliminating productive fixed investment can reduce future operating returns.
For example, shutting a well-utilized facility lowers cost but can also eliminate revenue and contribution.
The economic question is whether the fixed-cost commitment produces adequate value.
Fixed Costs and Return on Assets
Return on assets can improve when fixed assets and associated costs are used efficiently.
Suppose an expensive production facility operates at only 30% capacity.
The company carries depreciation, property costs, and maintenance against a relatively low revenue base.
Higher utilization can improve operating profit without requiring proportionate additional fixed assets.
That can strengthen asset returns.
Fixed Costs and Asset Turnover
Asset turnover helps evaluate whether a fixed asset base generates adequate revenue.
A company that owns substantial factories but produces little sales may have both low asset turnover and a heavy fixed-cost burden.
Increasing productive utilization can improve both measures.
This is why capacity decisions affect profitability, asset efficiency, and operating leverage simultaneously.
Fixed Costs and Business Valuation
Business valuation is influenced by the durability and flexibility of the cost structure.
A company with predictable recurring revenue and scalable fixed infrastructure can produce strong incremental margins as sales grow.
A company with high fixed costs and volatile revenue may deserve greater risk scrutiny.
Buyers therefore care not only about current earnings but also about how costs behave if sales rise or fall.
High Fixed-Cost Business Model
A high fixed-cost model can offer attractive scalability.
Once fixed costs are covered, additional contribution can produce rapid profit growth.
Examples can include businesses with significant physical infrastructure, software platforms, manufacturing capacity, or specialized equipment.
The disadvantage is reduced flexibility.
If revenue falls sharply, many costs remain.
That can cause profits to contract faster than sales.
Low Fixed-Cost Business Model
A low fixed-cost model relies more heavily on expenses that vary with activity.
This can reduce downside operating risk because costs decline when volume declines.
However, variable costs also rise as sales increase, limiting margin expansion.
Outsourcing is one way businesses sometimes exchange fixed costs for variable costs.
The trade-off is flexibility versus scale economics.
Outsourcing and Fixed Costs
Suppose a company owns a production facility costing $1 million annually regardless of volume.
It considers outsourcing production for $10 per unit.
At low volume, outsourcing may be cheaper because the company avoids the fixed facility cost.
At high volume, per-unit outsourcing charges can exceed the cost of internal capacity.
The decision therefore depends on expected volume, quality, strategic control, supplier risk, and long-term economics.
Automation and Fixed Costs
Automation can convert variable labor or processing expenses into fixed technology and equipment costs.
Suppose manual production costs $12 in labor per unit.
An automated system reduces variable labor to $4 but adds $500,000 of annual fixed costs.
At sufficiently high volume, automation can reduce total unit cost.
At low volume, the fixed investment can make the automated model more expensive.
The break-even volume between the two structures should be calculated explicitly.
Automation Example
Manual process:
Total Cost = $12 × Units
Automated process:
Total Cost = $500,000 + $4 × Units
Set the costs equal:
$12Q = $500,000 + $4Q
$8Q = $500,000
Q = 62,500 units
At approximately 62,500 units, the simplified costs are equal.
Above that volume, automation becomes cheaper under the assumptions.
Below it, the manual process costs less.
Capacity Expansion and Fixed Costs
Growth often requires step increases in fixed costs.
Suppose existing capacity supports $5 million of annual sales with $1 million of fixed costs.
To exceed $5 million, the company must lease another facility adding $400,000 of fixed cost.
At $5.1 million of sales, the new capacity can temporarily reduce profitability.
As sales grow toward $8 million or $10 million, the additional fixed-cost burden can be spread across more revenue.
This creates a common pattern in growth businesses: margin pressure before scale benefits appear.
Seasonal Businesses and Fixed Costs
Seasonal businesses can face heavy fixed-cost pressure during low-demand periods.
A ski resort, holiday retailer, tourist property, or seasonal manufacturer may incur substantial annual fixed expenses while revenue is concentrated into a few months.
Average annual profitability can therefore hide periods of significant negative cash flow.
Seasonal businesses should model fixed costs month by month rather than assuming annual averages describe liquidity accurately.
Fixed Costs in Service Businesses
Service businesses can also carry meaningful fixed costs.
Examples include salaried professional staff, office leases, software platforms, insurance, licenses, and administrative departments.
A consultancy with mostly salaried employees can have significant operating leverage even though it holds little inventory or manufacturing equipment.
The nature of the business does not determine fixed-cost intensity by itself.
Fixed Costs in Manufacturing
Manufacturers commonly have substantial fixed costs from factories, equipment, salaried production management, maintenance contracts, property costs, and depreciation.
This can create strong economies of scale when facilities operate efficiently.
It can also create losses when plants operate far below capacity.
Capacity utilization therefore becomes an important companion to fixed-cost analysis.
Fixed Costs in SaaS Businesses
Software businesses can carry a mix of fixed and variable expenses.
Core engineering teams, administrative salaries, and some platform commitments may behave as fixed costs over a range.
Cloud hosting, payment processing, customer support, and sales commissions can vary with users or revenue.
The classification should be based on actual cost behavior, not the assumption that all software-company expenses are fixed.
Fixed Costs in Retail
Retailers can carry fixed costs from store leases, salaried management, systems, and insurance.
They also face variable or semi-variable costs from product purchases, card fees, shipping, hourly staffing, and sales commissions.
Store economics therefore depend on producing enough contribution from merchandise sales to cover the location’s fixed operating base.
Fixed Costs and Semi-Variable Costs
Some expenses contain both fixed and variable components.
These are often called mixed or semi-variable costs.
Suppose electricity includes:
Base monthly charge = $2,000
Usage charge = $0.05 per machine-hour
Then:
Total Electricity Cost = $2,000 + ($0.05 × Machine-Hours)
The $2,000 base is fixed.
The usage portion is variable.
Treating the entire bill as one category can distort cost-volume analysis.
Fixed Costs and Semi-Fixed Costs
Semi-fixed or step-fixed costs remain constant until activity crosses a threshold.
A delivery operation might need one dispatcher for up to 25 drivers and a second dispatcher after that.
The cost is fixed within each activity band but increases when capacity expands.
This is another reason analysts should define the relevant range explicitly.
Avoidable and Unavoidable Fixed Costs
A fixed cost may be avoidable or unavoidable depending on the decision.
Suppose a company closes one store.
Store-specific rent may eventually disappear if the lease can be terminated.
Corporate headquarters cost may remain regardless.
For the store-closure decision, the first cost can be avoidable while the second is not.
Decision-making should therefore focus on incremental cash flows, not merely allocated accounting fixed costs.
Allocated Fixed Costs
Businesses often allocate shared fixed expenses across products, departments, or locations.
Suppose headquarters costs $1 million annually and management allocates $100,000 to each of ten divisions.
Closing one division does not necessarily save $100,000.
The headquarters cost may remain $1 million and simply be reallocated to the remaining divisions.
Allocated fixed cost should therefore not automatically be treated as an avoidable cost.
Fixed Costs and Product Decisions
Suppose a product line generates:
Revenue = $500,000
Variable costs = $300,000
Direct avoidable fixed costs = $100,000
Allocated corporate fixed costs = $150,000
Reported result:
Profit = $500,000 − $300,000 − $100,000 − $150,000
= −$50,000
The product appears unprofitable.
However, if the $150,000 corporate allocation remains after discontinuation, removing the product eliminates $200,000 of contribution after variable costs but saves only $100,000 of avoidable fixed costs.
The company’s overall profit could decline by $100,000.
Decision analysis must distinguish allocated fixed cost from truly avoidable cost.
How to Reduce Fixed Costs
Potential approaches include renegotiating leases, consolidating facilities, automating administrative work, removing redundant software, refinancing certain commitments, adjusting staffing structures, selling unused assets, or outsourcing where economics support it.
However, fixed-cost reduction should focus on costs that do not support sufficient value.
A smaller cost base is not automatically better if the reduction damages productive capacity, revenue, quality, customer retention, or resilience.
Should a Business Minimize Fixed Costs?
Not necessarily.
Fixed investment can create major competitive advantages.
A proprietary factory can produce lower marginal cost.
A software platform can serve additional customers cheaply after development.
A specialized team can create higher-quality products.
The issue is not whether a cost is fixed.
The issue is whether the fixed commitment produces sufficient economic return and whether the business can support it during weak periods.
Fixed Cost Trend Analysis
Suppose annual fixed costs change:
Year 1 = $1.0 million
Year 2 = $1.2 million
Year 3 = $1.8 million
The increase deserves explanation.
Perhaps the company opened new facilities.
Management may have hired ahead of growth.
Software contracts may have expanded.
An acquisition may have added infrastructure.
The next question is whether revenue, contribution, EBIT, and cash generation increased enough to justify the larger fixed-cost base.
Fixed Cost Ratio
A simple analytical ratio is:
Fixed Cost Ratio = Fixed Costs ÷ Revenue × 100
Suppose fixed costs are $1.5 million and revenue equals $10 million.
Fixed Cost Ratio = $1.5 million ÷ $10 million × 100
= 15%
If revenue grows to $15 million while fixed costs remain $1.5 million:
New Fixed Cost Ratio = 10%
The business has achieved operating scale.
This ratio is management-defined rather than a universally standardized financial-statement measure, so comparisons should use consistent cost classification.
Common Fixed Cost Mistakes
A common mistake is assuming fixed costs never change.
Another is treating every salary as fixed and every material cost as variable without checking actual behavior.
Analysts can also confuse fixed cost with sunk cost.
Allocated corporate overhead is sometimes mistaken for avoidable cost.
Using fixed cost per unit as though it remains constant across production levels is another error; total fixed cost stays constant within the relevant range, while fixed cost per unit changes.
Finally, cost behavior should not be extrapolated beyond existing capacity.
Limitations of Fixed-Cost Analysis
Real business costs rarely divide perfectly into fixed and variable categories.
Many are mixed.
Some change in steps.
Long-term fixed costs can become variable as contracts expire or management changes capacity.
Variable-cost rates can also change at different volumes.
Inflation, wage increases, supplier terms, technology, and operational redesign can alter the entire cost structure.
Fixed-cost analysis is therefore most reliable when the time horizon and relevant range are clearly defined.
How to Analyze Fixed Costs Properly
Start with the company’s expense accounts and operational contracts.
Determine which costs change directly with activity and which remain stable.
Separate mixed costs into fixed and variable portions where possible.
Identify committed and discretionary fixed costs.
Define the relevant operating range.
Then calculate total fixed cost and fixed cost per unit at several production levels.
Connect fixed costs with contribution margin and break-even.
Measure operating leverage.
Run downside scenarios for lower sales.
Translate accounting fixed costs into actual cash commitments.
Finally, evaluate whether the fixed-cost base generates enough revenue, operating profit, cash flow, and economic return to justify the risk.
The objective is not to drive fixed costs toward zero.
It is to maintain the right fixed-cost structure for the scale, demand stability, competitive strategy, and financial capacity of the business.
Frequently Asked Questions
What are fixed costs?
Fixed costs are expenses that remain substantially unchanged as sales or production volume changes within a defined period and relevant operating range.
What is the fixed cost formula?
When total and variable costs are known:
Fixed Costs = Total Costs − Variable Costs
What is average fixed cost?
Average Fixed Cost = Total Fixed Costs ÷ Units Produced
Average fixed cost declines as production rises while total fixed costs remain unchanged.
What are examples of fixed costs?
Examples can include contractual rent, certain salaries, insurance, base software subscriptions, property-related expenses, equipment leases, and depreciation, depending on the business and time period.
Is rent always a fixed cost?
Rent commonly behaves as a fixed cost during a lease period, but total rent can change when contracts renew, locations change, or additional capacity is required.
Are salaries fixed costs?
Some salaries are fixed, but not all labor costs are. Hourly production labor, overtime, commissions, and staffing that changes with demand can behave differently.
Is depreciation a fixed cost?
Depreciation often behaves as a fixed accounting cost within a short-term operating range, but its behavior depends on the depreciation method and asset activity.
What is the difference between fixed and variable costs?
Fixed costs remain stable in total within the relevant range. Variable costs change with activity.
Do fixed costs affect break-even?
Yes.
Break-Even Units = Fixed Costs ÷ Contribution Margin per Unit
Higher fixed costs increase break-even volume when contribution per unit stays unchanged.
Why does fixed cost per unit fall when volume rises?
The same total fixed-cost amount is spread across more units.
Are fixed costs the same as sunk costs?
No. Fixed describes cost behavior relative to activity. Sunk describes a cost already incurred that cannot be recovered.
Are high fixed costs bad?
Not automatically. High fixed costs can produce strong economies of scale when demand is sufficient, but they also create greater downside risk when sales decline.
Final Perspective
Fixed costs create the operating base that a business must support before contribution becomes profit.
The fundamental relationship is:
Total Cost = Fixed Costs + Variable Costs
and:
Fixed Costs = Total Costs − Variable Costs
The defining characteristic is not that fixed costs never change.
It is that they do not change directly with activity within the relevant period and capacity range.
This creates an important economic trade-off.
A large fixed-cost base can reduce unit costs and produce strong profit growth as sales scale.
The same structure can cause earnings to fall rapidly when sales decline because the costs remain.
That is why fixed costs sit at the center of break-even analysis and operating leverage.
The strongest question is not:
“How can we eliminate fixed costs?”
It is:
“Which fixed commitments create productive capacity or competitive advantage, what sales volume is required to support them, and can the business survive periods when that volume does not materialize?”
Answering that question turns fixed-cost analysis from simple expense classification into a practical framework for pricing, capacity planning, profitability, cash management, and operating risk.




