


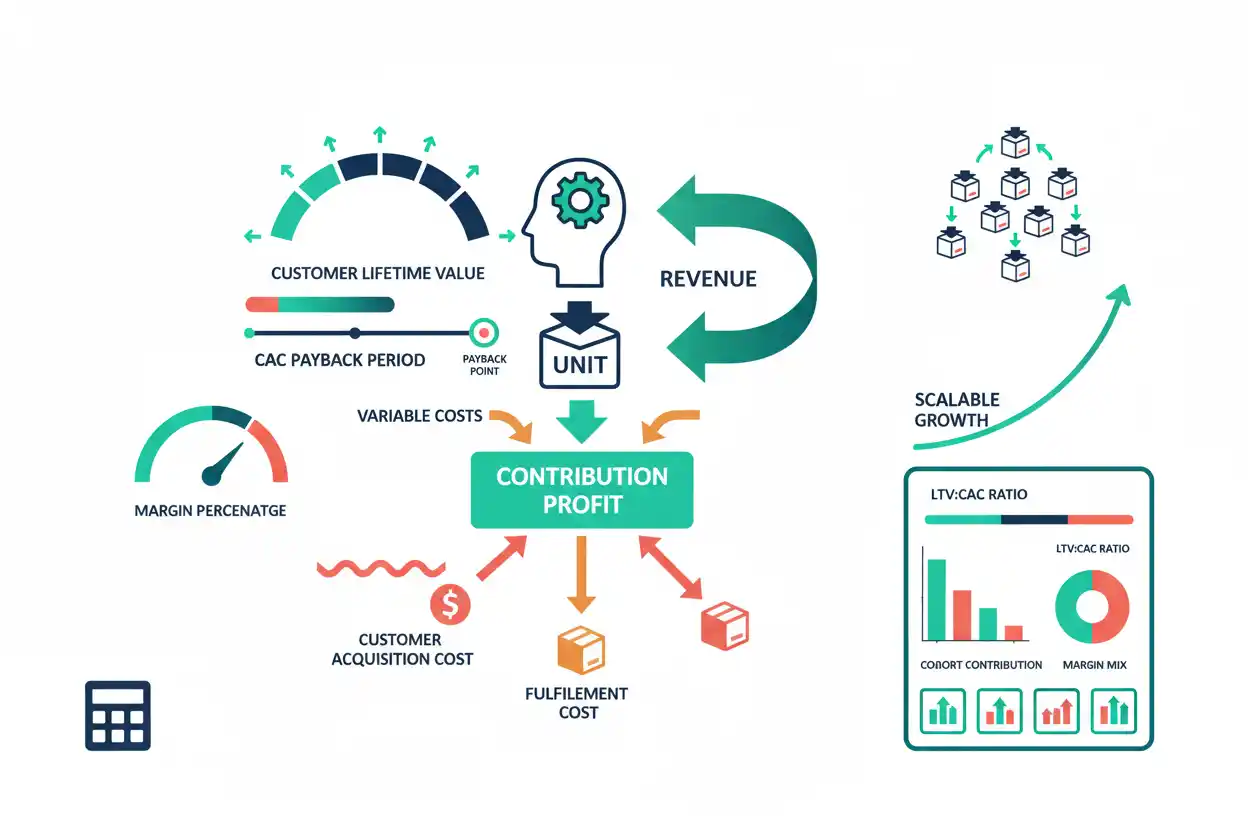
Unit economics measures the revenue and costs associated with one economically meaningful unit of a business. Depending on the model, that unit might be one product, one order, one customer, one subscriber, one ride, one delivery, one transaction, or one occupied room.
The basic question is simple:
Does an additional unit create or consume economic value?
For a straightforward product business, a useful starting formula is:
Unit Contribution = Revenue per Unit − Variable Cost per Unit
If a product sells for $100 and incurs $60 of variable cost:
Unit Contribution = $100 − $60
Unit Contribution = $40
Contribution margin is:
Contribution Margin = $40 ÷ $100 × 100
Contribution Margin = 40%
For customer-based businesses, the analysis can go further by comparing the value generated by a customer with the cost required to acquire that customer.
Within business finance, unit economics connects pricing, contribution margin, customer acquisition, lifetime value, retention, growth, cash requirements, and eventual profitability. Strong unit economics does not guarantee that the entire company is profitable, but weak unit economics makes profitable scale much harder.
What Is Unit Economics?
Unit economics evaluates the financial performance of the smallest repeatable unit that drives a business.
For a retailer, the unit may be one item or order.
For SaaS, it may be one customer or subscription.
For a marketplace, it may be one transaction.
For a delivery platform, it may be one delivery.
For a hotel, it could be one occupied room-night.
For a consulting business, it might be one billable hour or engagement.
The unit should be chosen so management can answer:
How much revenue does this unit generate?
What costs arise because the unit exists?
How much contribution remains?
If customer acquisition is required, how much does that acquisition cost?
How long does it take to recover that cost?
How much economic contribution can the customer create over the relationship?
Those questions form the core of unit economics.
Unit Economics Formula
There is no single universal unit economics formula.
For a product or transaction, a useful starting point is:
Unit Contribution = Revenue per Unit − Variable Cost per Unit
Contribution margin percentage is:
Unit Contribution Margin = Unit Contribution ÷ Revenue per Unit × 100
For customer-based businesses, additional measures can include:
CAC = Customer Acquisition Costs ÷ New Customers Acquired
A simplified lifetime-value framework may be:
Customer LTV = Expected Contribution per Period × Expected Customer Lifetime
Then:
LTV-to-CAC Ratio = Customer LTV ÷ CAC
And a simplified CAC payback calculation is:
CAC Payback Period = CAC ÷ Contribution per Customer per Period
These formulas need to match the business model. What counts as acquisition cost, variable cost, customer value, or contribution differs between companies.
Simple Unit Economics Example
Suppose an ecommerce company sells a product for $80.
Per-order economics are:
Selling price = $80
Product cost = $30
Fulfillment = $8
Payment processing = $2
Expected returns and refunds cost = $4
Total variable cost:
$30 + $8 + $2 + $4 = $44
Unit contribution:
$80 − $44 = $36
Contribution margin:
$36 ÷ $80 × 100
45%
Before customer-acquisition expense and fixed overhead, each order contributes approximately $36.
If acquiring the customer costs $24 and the company evaluates only the first order:
First-Order Contribution After CAC = $36 − $24
$12
The customer is contribution-positive on the first purchase under these assumptions.
Why Unit Economics Matters
Company-level financial statements can hide what happens on one incremental sale.
Suppose a startup reports:
Revenue = $10 million
and:
Net loss = $3 million.
That result alone cannot tell us whether the core model is broken.
One possibility is that every new customer loses money.
Another is that customers are highly profitable individually, while the company is spending heavily on research, management, technology, and geographic expansion.
Those are very different situations.
Unit economics helps separate:
the economics of serving a customer
from:
the fixed and strategic costs of operating the whole company.
Unit Economics vs Company Profit
Profit is measured across the overall business.
Unit economics examines a repeatable customer, product, transaction, or service unit.
Suppose:
Unit contribution = $50
The company sells 20,000 units.
Total contribution:
$50 × 20,000 = $1,000,000
But annual fixed costs are $1.5 million.
Company result before other items:
$1,000,000 − $1,500,000
= −$500,000
The unit economics are positive.
The company is still losing money.
If sales scale sufficiently without fixed costs increasing proportionately, the company might eventually become profitable.
Positive Unit Economics
Positive unit economics means the defined unit generates more economic contribution than the relevant costs assigned to it.
For a transaction:
Revenue per Transaction > Variable Cost per Transaction
For a customer relationship, the company may also require:
Customer Lifetime Contribution > Customer Acquisition Cost
Positive unit economics is necessary for many scalable models, but the definition matters.
A company can claim positive gross contribution while ignoring acquisition, support, refunds, or other economically significant costs.
The metric should therefore be specific about which costs are included.
Negative Unit Economics
Negative unit economics means each incremental unit loses money under the chosen definition.
Suppose:
Selling price = $50
Variable cost = $55
Then:
Unit Contribution = −$5
Selling more units at the same economics increases the loss:
At 1,000 units:
Loss = $5,000
At 100,000 units:
Loss = $500,000
Growth does not automatically fix negative contribution.
The company needs some combination of:
higher price;
lower cost;
better product mix;
greater repeat purchasing;
lower acquisition cost;
or another improvement to the underlying model.
Unit Revenue
Unit revenue is the amount of revenue attributable to one defined unit.
For a physical product, it can simply be the realized selling price.
For subscriptions:
Unit Revenue = Subscription Revenue per Customer per Period
For a marketplace:
Unit Revenue = Transaction Value × Take Rate
Suppose marketplace transaction value is $200 and the platform earns a 12% fee:
Platform Revenue per Transaction = $200 × 12%
$24
The platform’s unit economics should begin with its $24 revenue—not the entire $200 transaction value—unless it is actually the principal seller under the applicable business model.
Realized Price Matters
List price is not always unit revenue.
Suppose:
List price = $100
Average discount = $15
Average refund allowance = $5
Expected realized revenue:
$100 − $15 − $5
$80
If management calculates unit economics using $100 rather than the expected $80, contribution can be significantly overstated.
The target pricing model should therefore connect to actual realized prices rather than theoretical list prices.
Variable Cost per Unit
The workbook maps variable costs directly because unit economics depends heavily on costs that change with transaction or customer volume.
Examples can include:
product cost;
packaging;
shipping;
payment fees;
sales commissions;
usage-based hosting;
transaction fees;
delivery labor;
customer-specific servicing;
and expected refunds.
The relevant costs vary by model.
The central question is:
What additional economic cost arises when one additional unit is sold or served?
Contribution Margin
Contribution margin is one of the clearest unit-economics measures.
Per unit:
Contribution = Unit Revenue − Unit Variable Costs
As a percentage:
Contribution Margin = Contribution ÷ Revenue × 100
Suppose:
Price = $120
Variable cost = $72
Contribution:
$48
Margin:
$48 ÷ $120
40%
Each additional sale contributes $48 toward fixed costs and eventual profit.
Unit Economics vs Gross Margin
Gross margin and unit contribution margin can overlap, but they are not always identical.
Gross margin generally reflects revenue less cost of revenue or cost of goods sold according to the company’s accounting presentation.
A unit-economics model may include additional transaction-level costs that sit outside accounting COGS.
For example:
Gross profit per order = $50
but:
Payment fee = $3
Fulfillment support = $4
Returns handling = $5
Unit contribution could be:
$50 − $3 − $4 − $5
$38
The business can therefore report a 50% gross margin while generating a lower contribution margin after additional variable costs.
Unit Economics vs Net Profit Margin
Net profit margin measures final company profit relative to revenue.
Unit economics operates much earlier in the profitability chain.
Suppose:
Contribution margin = 60%
but:
marketing;
research;
management;
office;
legal;
and other fixed expenses
consume more than 60% of revenue.
The company can still report a net loss.
Positive unit economics creates the possibility of operating leverage.
It does not guarantee overall profitability.
Customer Acquisition Cost
For customer-based models, customer acquisition cost is one of the most important unit-economics inputs.
A simplified formula is:
CAC = Acquisition Spend ÷ New Customers Acquired
Suppose:
Sales and marketing acquisition spending = $300,000
New customers = 1,000
Then:
CAC = $300
The company spent approximately $300 for each acquired customer under that cost definition.
The difficult part is deciding what belongs in acquisition spend.
What Should CAC Include?
CAC may include:
advertising;
sales commissions;
marketing technology;
sales payroll;
agency costs;
promotions;
onboarding costs;
or other acquisition-related expenditures.
Different companies use different definitions.
For that reason, an LTV/CAC ratio from one business should not be compared casually with another unless the methodologies are compatible.
A CAC calculated from advertising spend alone will usually be lower than a fully loaded CAC that includes the sales organization.
Blended CAC vs Paid CAC
Blended CAC can include customers acquired through both paid and unpaid channels.
Suppose:
Acquisition spend = $100,000
Paid customers = 500
Organic customers = 500
Blended CAC:
$100,000 ÷ 1,000
$100
If management looks only at customers acquired through the paid campaign:
Paid CAC = $100,000 ÷ 500
$200
Both figures can be useful.
They answer different questions.
Labeling the methodology prevents the business from mistaking growing organic demand for improved paid-ad efficiency.
Customer Lifetime Value
Customer lifetime value estimates the economic value produced over a customer relationship.
A simplified contribution-based formula is:
LTV = Contribution per Customer per Period × Expected Customer Lifetime
Suppose:
Monthly customer revenue = $100
Monthly variable service cost = $20
Monthly contribution:
$80
Expected customer lifetime = 30 months
Simplified LTV:
$80 × 30
$2,400
If CAC is $480:
LTV-to-CAC Ratio = $2,400 ÷ $480
5.0
Under this simplified model, estimated lifetime contribution is five times acquisition cost.
LTV Is an Estimate
Unlike historical sales revenue, LTV often depends on future customer behavior.
The estimate can change because of:
churn;
retention;
price increases;
discounts;
expansion revenue;
service cost;
customer segmentation;
or changes in customer behavior.
A startup can make LTV look extremely high by assuming customers stay for an unrealistically long time.
Therefore, LTV should be grounded in cohort data whenever possible.
LTV-to-CAC Ratio
The relationship is:
LTV-to-CAC Ratio = Customer Lifetime Value ÷ Customer Acquisition Cost
Suppose:
LTV = $900
CAC = $300
Then:
LTV/CAC = 3.0
If LTV falls to $600:
LTV/CAC = 2.0
If CAC rises to $450 while LTV remains $900:
LTV/CAC = 2.0
The same ratio can deteriorate because customers become less valuable or because acquisition becomes more expensive.
Management should therefore examine both components.
Is 3:1 LTV-to-CAC Always Good?
No universal LTV/CAC ratio is optimal for every business.
The required economics depend on:
capital availability;
cash timing;
gross margin;
churn;
business risk;
industry;
sales-cycle length;
growth rate;
and the reliability of the LTV estimate.
A ratio can look excellent while the company still runs out of cash because customer value arrives slowly and acquisition cost is paid upfront.
Likewise, extremely high LTV/CAC can indicate that a company is underinvesting in growth when additional customers could be acquired profitably.
The ratio needs context.
CAC Payback Period
CAC payback estimates how long customer contribution takes to recover acquisition cost.
A simplified formula is:
CAC Payback = CAC ÷ Monthly Contribution per Customer
Suppose:
CAC = $600
Monthly customer contribution = $100
Then:
CAC Payback = 6 Months
After approximately six months, cumulative contribution equals the original acquisition cost under the simplified assumptions.
Contribution generated after that point can begin supporting fixed costs and profit.
CAC Payback Example
Suppose a SaaS company has:
Monthly subscription revenue = $150
Monthly variable service cost = $30
Monthly contribution:
$120
CAC:
$720
Payback:
$720 ÷ $120
6 Months
If the average customer stays for only four months, the economics are poor.
Expected lifetime contribution:
$120 × 4
$480
The business spends $720 to acquire $480 of expected contribution.
The customer relationship destroys $240 before fixed costs.
SaaS Unit Economics Example
Consider a subscription software business.
Monthly revenue per customer = $100
Variable hosting and service cost = $20
Monthly contribution = $80
CAC = $480
Expected lifetime = 30 months
Contribution margin:
$80 ÷ $100
80%
CAC payback:
$480 ÷ $80
6 Months
Simplified LTV:
$80 × 30
$2,400
LTV/CAC:
$2,400 ÷ $480
5.0
At first glance, these economics look attractive.
However, management should still examine whether the 30-month lifetime assumption is supported by actual retention and whether the $480 CAC includes all economically relevant acquisition costs.
SaaS Churn and Unit Economics
Churn can dramatically change customer value.
Suppose monthly contribution is $80.
If expected lifetime is 30 months:
LTV = $2,400
If customer lifetime falls to 15 months:
LTV = $1,200
Nothing changed about monthly revenue or margin.
Lifetime value was cut in half because retention deteriorated.
For subscription businesses, retention can therefore be as important as pricing or acquisition cost.
Cohort Economics
Company-wide averages can hide important changes.
Suppose old customers have:
LTV/CAC = 5×
while customers acquired this year have:
LTV/CAC = 2×
The aggregate company metric may still look strong because older customers dominate historical data.
Cohort analysis separates customers by acquisition period or another meaningful characteristic.
That helps reveal whether new growth is becoming more or less economically attractive.
Ecommerce Unit Economics
Consider an online retailer.
Selling price = $100
Product cost = $35
Shipping and fulfillment = $10
Payment fee = $3
Expected returns cost = $7
Contribution before acquisition:
$100 − $35 − $10 − $3 − $7
$45
If CAC = $30:
First-Order Contribution After CAC = $15
If 40% of customers make another purchase with $45 contribution and no new acquisition cost, repeat behavior can materially strengthen customer-level economics.
This shows why order economics and customer economics should sometimes be analyzed separately.
First-Order Economics vs Customer Economics
A business can intentionally lose money on the first transaction while generating attractive customer lifetime economics.
Suppose:
First-order contribution before CAC = $30
CAC = $50
Initial result:
−$20
The customer later places four additional orders that each generate $30 contribution.
Lifetime contribution:
5 × $30 = $150
Less CAC:
$150 − $50
$100 Lifetime Contribution After Acquisition
The first order loses money.
The customer relationship is profitable.
That strategy works only if repeat-purchase assumptions are credible.
Marketplace Unit Economics
A marketplace generally earns only part of the transaction’s gross merchandise value.
Suppose:
Transaction value = $200
Platform take rate = 15%
Platform revenue:
$30
Variable payment and servicing costs:
$8
Contribution:
$22
Contribution margin on platform revenue:
$22 ÷ $30
≈ 73.33%
Using the entire $200 transaction amount as revenue in the unit model would dramatically overstate the marketplace’s economics if only $30 belongs economically to the platform.
Delivery Business Unit Economics
Suppose a delivery platform receives $14 of revenue per order.
Driver or courier cost = $8
Payment processing = $0.50
Customer support and variable incentives = $1.50
Contribution:
$14 − $8 − $0.50 − $1.50
$4
Contribution margin:
$4 ÷ $14
≈ 28.57%
If acquisition cost is $40 per customer, the company needs enough repeat orders to recover that acquisition cost.
At $4 contribution per order:
Orders to Recover CAC = $40 ÷ $4
10 Orders
Service Business Unit Economics
For a professional service, the unit might be one billable hour.
Suppose:
Hourly price = $200
Direct professional labor = $100
Variable support and delivery cost = $20
Contribution:
$80 per billable hour
If annual fixed costs are $400,000:
Hours Required to Cover Fixed Costs = $400,000 ÷ $80
5,000 Hours
The service business then needs additional billable hours beyond that level to produce profit.
Unit Economics and Break-Even
Break-even analysis connects unit contribution to company-level fixed costs.
The common relationship is:
Break-Even Units = Fixed Costs ÷ Contribution per Unit
Suppose:
Contribution per unit = $40
Fixed costs = $800,000
Then:
Break-Even Units = $800,000 ÷ $40
20,000 Units
Positive unit contribution tells us each sale helps.
Break-even tells us how many sales are needed before total contribution covers the fixed-cost base.
Unit Economics and Break-Even Point
The break-even point is therefore separate from unit economics.
Suppose two companies both earn $50 contribution per customer.
Company A has $500,000 of fixed costs.
Company B has $5 million.
Their per-customer economics are identical.
Their required scale is not.
Company A needs far fewer customers before reaching company-level profitability.
Unit Economics and Fixed Costs
Fixed costs generally sit outside a basic unit contribution calculation because they do not rise directly with each incremental unit within the relevant range.
However, fixed costs cannot be ignored when evaluating the whole business.
Suppose:
Unit contribution = $100
Annual fixed costs = $10 million
The company needs:
$10M ÷ $100
100,000 Units
just to cover fixed costs.
Excellent unit economics can therefore coexist with large company losses when scale is still insufficient.
Unit Economics and Operating Leverage
Operating leverage explains why positive unit economics can become powerful at scale.
Suppose a software company’s infrastructure supports large additional customer volume with relatively little incremental cost.
Once fixed development and administrative costs are covered, much of the contribution from additional customers can flow toward operating profit.
By contrast, a consulting business may need to hire another employee for nearly every increment of sales.
Its variable or semi-variable labor requirement limits operating leverage.
Unit Economics and Scalability
Strong unit economics becomes especially valuable when the economics remain stable—or improve—as the company grows.
Growth can weaken unit economics if:
advertising becomes more expensive;
lower-quality customers are acquired;
service costs rise;
discounts deepen;
returns increase;
or supply constraints emerge.
Therefore, unit economics should be measured repeatedly rather than assumed constant.
A business is scalable only when growth can be supported at economically acceptable incremental returns.
Unit Economics and Target Pricing
The workbook maps Target Pricing directly because price is one of the fastest ways to change contribution economics.
Suppose:
Current price = $100
Variable cost = $70
Contribution:
$30
If management requires $40 contribution:
Target Price = $70 + $40
$110
Assuming variable cost remains unchanged, the 10% price increase raises contribution by:
33.33%
because contribution rises from $30 to $40.
Small price changes can therefore have large percentage effects on unit profit.
Unit Economics and Discounts
Suppose:
Price = $100
Variable cost = $60
Contribution:
$40
A 20% discount reduces realized price to:
$80
New contribution:
$80 − $60
$20
The price fell 20%.
Unit contribution fell 50%.
This asymmetry makes discounting particularly important in unit-economics analysis.
Unit Economics and Startup Valuation
The workbook maps startup valuation because investors often care not only about growth but whether growth has credible economics.
Consider two startups each growing 80% annually.
Startup A spends $1 to acquire $4 of credible lifetime contribution.
Startup B spends $1 to acquire only $1.10.
Their headline growth rates are identical.
Their underlying economics are not.
Strong unit economics can support the argument that additional growth capital can be invested productively.
Weak unit economics can imply that scaling will simply magnify losses.
Unit Economics and ROI
The workbook maps ROI because customer acquisition can be viewed as an investment.
Suppose:
CAC = $200
Lifetime contribution = $500
Net customer contribution after CAC:
$500 − $200
$300
A simplified acquisition ROI is:
$300 ÷ $200
150%
However, this does not account for how long the $500 contribution takes to arrive.
A customer generating the value within six months has different cash economics from one requiring five years.
Unit Economics and ROIC
Return on invested capital provides a broader company-level capital-efficiency perspective.
Strong customer-level economics can still coexist with weak ROIC if the business requires enormous inventories, equipment, warehouses, or other invested capital.
Conversely, an asset-light business with attractive unit contribution and little capital requirement can potentially generate strong returns on invested capital.
Unit economics should therefore be interpreted within the complete capital model.
Unit Economics and WACC
The workbook maps weighted average cost of capital to this article because eventually the business must produce returns sufficient to justify the capital committed to it.
However, a customer-level LTV/CAC ratio should not be compared mechanically with WACC.
They are different types of measurements.
WACC is an annualized company financing hurdle under its methodology.
LTV/CAC compares modeled lifetime customer value with acquisition cost.
Time, risk, taxes, and capital definitions differ.
The connection belongs at the broader capital-allocation level, not through a direct numerical comparison.
Unit Economics and Cash Flow
A business can have attractive lifetime economics and still face serious cash pressure.
Suppose:
CAC = $1,200 paid today.
Monthly customer contribution = $100.
Payback period:
12 Months
If the company adds 10,000 customers rapidly, acquisition spending is:
$12 million
The eventual customer economics may be attractive.
The business still needs $12 million upfront before those customer contributions are recovered.
This is why cash flow forecasting matters alongside unit economics.
Unit Economics and Burn Rate
Burn rate can increase when a startup accelerates customer acquisition.
Suppose each acquired customer is expected to produce attractive lifetime value, but CAC is paid upfront.
Rapid growth can temporarily increase cash losses because the business is funding acquisition before receiving future customer contribution.
This creates a key startup distinction:
good lifetime economics do not necessarily mean positive current cash flow.
Unit Economics and Cash Runway
Cash runway determines how long the company can continue funding those economics before requiring additional capital.
Suppose:
Cash = $5 million
Monthly burn = $500,000
Simplified runway:
10 Months
If management accelerates customer acquisition and burn rises to $800,000:
Runway = 6.25 Months
The acquisition economics may still be attractive.
Financing risk increased sharply.
Unit Economics and Working Capital
Working capital matters especially for product businesses.
Suppose a retailer has excellent $30 contribution per order but must purchase inventory four months before receiving customer cash.
Rapid growth can require substantial working capital.
A subscription software company paid annually in advance can have the opposite profile.
The two businesses can have identical unit margins but dramatically different financing requirements.
Unit Economics and Customer Payment Timing
Suppose a business earns $500 contribution from a customer relationship.
Scenario A collects the full amount upfront.
Scenario B collects it over two years.
The nominal lifetime contribution is identical.
The cash economics are not.
Timing affects liquidity, financing needs, risk, and present value.
This is why sophisticated customer models can move beyond simple LTV toward discounted customer cash flows.
Discounted Customer Lifetime Value
A more rigorous LTV model can discount expected future customer contribution.
Conceptually:
Discounted LTV = Sum of Expected Future Customer Cash Contributions ÷ (1 + Discount Rate)^t
This recognizes that future contribution is not economically identical to cash received today.
However, discounting does not fix poor underlying assumptions.
A model still depends on credible forecasts of retention, revenue, costs, and customer behavior.
Unit Economics and Pricing Power
A company with genuine pricing power can improve unit economics through higher realized revenue per customer without equivalent cost growth.
Suppose:
Price increases from $100 to $110.
Variable cost remains $60.
Original contribution:
$40
New contribution:
$50
Price increased 10%.
Contribution increased 25%.
However, this improvement only holds if customer demand and retention remain sufficiently strong after the increase.
Unit Economics and Cost Reduction
Suppose:
Price = $100
Variable cost = $70
Contribution = $30
Management reduces variable cost to $60.
New contribution:
$40
Again, contribution increases by 33.33%.
Pricing and cost reduction can therefore have similar effects mathematically.
The commercially preferable route depends on customer demand, competition, supplier economics, product quality, and operational feasibility.
Unit Economics and Product Mix
A company-level average can hide very different product economics.
Product A:
Contribution margin = 70%
Product B:
Contribution margin = 10%
If sales shift heavily toward Product B, total revenue can rise while company contribution margin falls.
Management should therefore calculate unit economics at a sufficiently granular level to identify which products, segments, or customers create economic value.
Customer Segment Economics
The same product can have different unit economics across customer segments.
Enterprise customers may have:
higher revenue;
higher sales expense;
longer implementation;
greater support;
and stronger retention.
Small-business customers may have:
lower revenue;
self-service acquisition;
lower support;
and higher churn.
A single blended CAC or LTV can hide those differences.
Segment-level economics can produce better pricing and acquisition decisions.
Channel Economics
Acquisition channels can also differ.
Suppose:
Organic CAC = $50
Paid-search CAC = $200
Partner-channel CAC = $120
If customer lifetime contribution is $400 across all channels:
Organic LTV/CAC:
8×
Paid search:
2×
Partners:
3.33×
The blended company average may look acceptable while one acquisition channel has relatively weak economics.
Channel-level analysis can identify where incremental growth capital should—or should not—be deployed.
Marginal vs Average Unit Economics
Average unit economics describes the average customer or transaction already in the business.
Marginal unit economics asks:
What are the economics of the next customer we expect to acquire?
This distinction matters during growth.
Suppose historical CAC is $100.
The company has already captured the easiest customers.
New acquisition now costs $180.
Using historical $100 CAC to justify future growth overstates the economics of the next marketing dollar.
Capital allocation should focus heavily on marginal economics.
Unit Economics and Growth
Growth is attractive when additional units continue to create enough contribution to justify the resources required.
Suppose:
Year 1 CAC = $100
Year 2 CAC = $130
Year 3 CAC = $180
while customer contribution remains constant.
Growth becomes progressively more expensive.
Eventually, the marginal customer’s economics may no longer justify acquisition.
Unit economics therefore helps determine not only whether a company should grow but how aggressively.
Unit Economics and Economies of Scale
Some costs fall per unit as the business grows.
For example:
shipping rates can improve;
supplier prices can decline;
server utilization can improve;
manufacturing overhead can spread across greater volume.
If variable cost per unit falls from $60 to $50 while price stays $100:
Contribution rises from:
$40
to:
$50
Scale improved unit economics.
However, not every business experiences this pattern.
Congestion, labor shortages, customer-support complexity, and advertising saturation can make marginal costs rise instead.
Unit Economics and Fixed-Cost Allocation
Some analysts allocate fixed costs to each unit.
That can be useful for fully loaded profitability.
However, the result needs to be distinguished from contribution economics.
Suppose:
Contribution per unit = $50
Allocated fixed overhead = $30
Fully loaded unit profit:
$20
If volume doubles without fixed overhead doubling, the allocation per unit can fall.
The contribution remains $50.
This is why contribution margin is generally more useful for evaluating incremental economics, while fully loaded unit profit can help test total business sustainability.
Unit Economics and Operating Profit
Operating profit emerges after contribution from all units is sufficient to cover operating expenses.
Conceptually:
Operating Profit ≈ Total Unit Contribution − Fixed Operating Costs
This relationship is simplified because real financial statements contain cost classifications and other operating items that may not fit perfectly into binary variable/fixed categories.
Still, the framework explains how good unit economics can translate into company profitability as scale develops.
Unit Economics and Operating Margin
Operating margin provides the company-level outcome:
Operating Margin = Operating Profit ÷ Revenue
Unit contribution margin can be much higher.
Suppose:
Unit contribution margin = 60%
Company operating margin = 10%
The 50-percentage-point difference can represent sales, product development, administration, facilities, corporate technology, and other operating costs not assigned to each incremental unit.
This gap helps management understand how much scale is required to support the full organization.
Unit Economics and Startup Losses
A startup with negative net profit can still have an attractive business model when:
contribution is strong;
CAC is recoverable quickly;
retention is strong;
and fixed spending is building capabilities that do not need to increase proportionately forever.
Conversely, a startup can make company losses worse as it grows when every customer has negative contribution after realistic acquisition and servicing costs.
Unit economics helps distinguish investment ahead of scale from scaling an economically defective model.
Unit Economics and Startup Valuation Expectations
High valuations often assume the company can grow without destroying unit economics.
If a forecast assumes:
CAC stays flat;
retention improves;
gross margins expand;
and service costs decline,
those assumptions should be tested individually.
A valuation can become fragile when it requires every unit-economics input to improve simultaneously.
Observed cohorts provide stronger evidence than theoretical mature-state assumptions.
Unit Economics Sensitivity Analysis
Suppose base-case customer economics are:
Monthly contribution = $80
Lifetime = 24 months
CAC = $400
LTV:
$1,920
LTV/CAC:
4.8×
Now customer lifetime falls to 18 months:
LTV = $1,440
LTV/CAC = 3.6×
CAC rises to $600 as well:
$1,440 ÷ $600
2.4×
Two moderate assumption changes cut the ratio in half.
This is why LTV/CAC should not be reported without sensitivity testing.
Unit Economics Scenario Analysis
A customer model might use:
Downside
CAC = $700
Monthly contribution = $60
Lifetime = 15 months
LTV = $900
LTV/CAC ≈ 1.29×
Base Case
CAC = $500
Monthly contribution = $75
Lifetime = 24 months
LTV = $1,800
LTV/CAC = 3.6×
Upside
CAC = $400
Monthly contribution = $85
Lifetime = 30 months
LTV = $2,550
LTV/CAC = 6.38×
The range shows how dependent the economics are on acquisition efficiency and customer retention.
Improving Unit Economics
Unit economics generally improves through one or more of four levers:
higher unit revenue;
lower variable cost;
lower acquisition cost;
or greater customer lifetime contribution.
A company can raise price, reduce discounts, improve product mix, negotiate supplier costs, automate fulfillment, improve retention, increase repeat purchasing, reduce churn, or improve acquisition efficiency.
The important point is to identify the actual weak variable rather than applying a generic growth tactic.
When Strong Unit Economics Can Mislead
Even excellent unit economics can be misleading if:
the market is tiny;
the metrics exclude important costs;
CAC rises rapidly with scale;
retention data is immature;
regulatory or operational risk is ignored;
fixed costs are enormous;
or the company requires excessive capital.
Unit economics evaluates one important layer of the business.
It is not a complete valuation or risk model.
When Weak Unit Economics May Improve
Early economics are not always permanent.
A new manufacturing company may initially pay high supplier prices.
A marketplace may operate inefficiently before reaching local density.
A software business may improve hosting costs with scale.
A young sales team may become more productive.
Improvement is possible.
However, projections of future unit economics should be supported by a credible mechanism rather than simply assuming margins will improve because the company becomes larger.
Common Unit Economics Mistakes
One common mistake is choosing the wrong unit.
Another is using list price rather than realized revenue.
Businesses can omit refunds, fulfillment, sales commissions, payment fees, or support costs.
CAC may include only advertising while excluding sales labor.
LTV may assume unrealistic customer lifetimes.
A company can use blended averages that hide deteriorating new customer cohorts.
Management can also focus on lifetime value while ignoring a dangerously long CAC payback period.
Another mistake is treating positive contribution as proof that the entire company is profitable.
Finally, historical average economics can be used to justify growth even when marginal acquisition economics have become much worse.
Limitations of Unit Economics
Unit economics is not standardized across industries or companies.
The definition of a unit varies.
Cost allocation varies.
CAC methodology varies.
LTV methodology varies.
Retention estimates can be uncertain.
Contribution margin can exclude substantial fixed expenses.
Company averages can hide weak cohorts.
Customer lifetime models may rely on immature data.
Positive lifetime economics can coexist with severe short-term cash burn.
The metrics can therefore be highly useful while still being sensitive to methodology.
Transparency matters.
How to Analyze Unit Economics Properly
First, define the correct economic unit.
Then calculate realized revenue per unit.
Identify the variable costs required to deliver that unit.
Calculate:
Unit Contribution = Revenue per Unit − Variable Cost per Unit
and:
Contribution Margin = Unit Contribution ÷ Unit Revenue
For customer-based models, calculate acquisition cost:
CAC = Acquisition Spend ÷ New Customers Acquired
Estimate customer contribution over a defensible lifetime:
LTV = Expected Contribution per Period × Expected Lifetime
Then:
LTV/CAC = LTV ÷ CAC
and:
CAC Payback = CAC ÷ Contribution per Period
Next, segment the results by cohort, customer group, product, geography, and acquisition channel where meaningful.
Test sensitivity to:
higher CAC;
lower retention;
lower prices;
and higher costs.
Finally, connect the customer economics to fixed costs, cash flow, working capital, and company-level capital requirements.
That process reveals whether the repeatable engine of the business becomes stronger—or weaker—as the company grows.
Why Unit Economics Matters
Unit economics asks whether the basic repeatable transaction of a business creates enough value to support growth.
For a product:
Unit Contribution = Selling Price − Variable Cost
For a customer-based model:
LTV-to-CAC = Customer Lifetime Value ÷ Customer Acquisition Cost
And for cash recovery:
CAC Payback = CAC ÷ Periodic Customer Contribution
These measures describe different pieces of the same economic engine.
A business with strong contribution but unsustainable acquisition costs has a problem.
A company with attractive LTV but five-year payback may have a financing problem.
A startup with positive customer economics but enormous fixed costs may still need substantially more scale.
Therefore, strong unit economics does not mean simply finding one attractive ratio.
It means showing that revenue, variable costs, acquisition expense, retention, customer contribution, cash timing, and required scale combine into a repeatable model that can plausibly create value as the business grows.
Frequently Asked Questions
What is unit economics in simple terms?
Unit economics measures the revenue and relevant costs associated with one repeatable unit of a business, such as a product, customer, order, subscription, or transaction.
What is the basic unit economics formula?
For a simple product or transaction:
Unit Contribution = Revenue per Unit − Variable Cost per Unit
Contribution margin divides that contribution by unit revenue.
What are good unit economics?
There is no universal benchmark. Good unit economics generally means the defined unit creates enough contribution to support customer acquisition, fixed costs, capital requirements, and an acceptable return, with assumptions appropriate to the business.
What is CAC?
Customer acquisition cost measures the cost of acquiring a customer:
CAC = Acquisition Spend ÷ New Customers Acquired
The exact acquisition costs included should be stated.
What is LTV?
Customer lifetime value estimates the value generated over a customer relationship. One simplified contribution-based model multiplies periodic customer contribution by expected customer lifetime.
What is LTV-to-CAC?
LTV/CAC = Customer Lifetime Value ÷ Customer Acquisition Cost
It compares estimated customer value with acquisition cost, but its interpretation depends heavily on how both metrics are calculated.
What is CAC payback period?
CAC payback estimates how long customer contribution takes to recover the acquisition cost:
CAC Payback = CAC ÷ Contribution per Customer per Period
Can a company have positive unit economics and still lose money?
Yes. Positive contribution can be outweighed by large fixed operating expenses, research spending, administration, expansion, or other company-level costs.
Can a company grow with negative unit economics?
Yes, temporarily, but scaling unchanged negative unit contribution generally increases losses. The business ultimately needs improved price, cost, retention, acquisition efficiency, or another structural change.
What is the difference between unit economics and gross margin?
Gross margin follows the company’s accounting cost-of-revenue structure. Unit economics may include additional variable costs such as fulfillment, payment fees, acquisition, or servicing depending on the metric being analyzed.
Why is CAC payback important if LTV/CAC is strong?
A company can have attractive lifetime economics but wait years to recover acquisition spending. Long payback can create substantial cash requirements and financing risk.
How often should unit economics be reviewed?
They should be reviewed whenever pricing, costs, customer behavior, acquisition channels, retention, product mix, or growth strategy changes materially. Cohort and channel analysis is particularly useful for detecting deterioration hidden by company-wide averages.




