


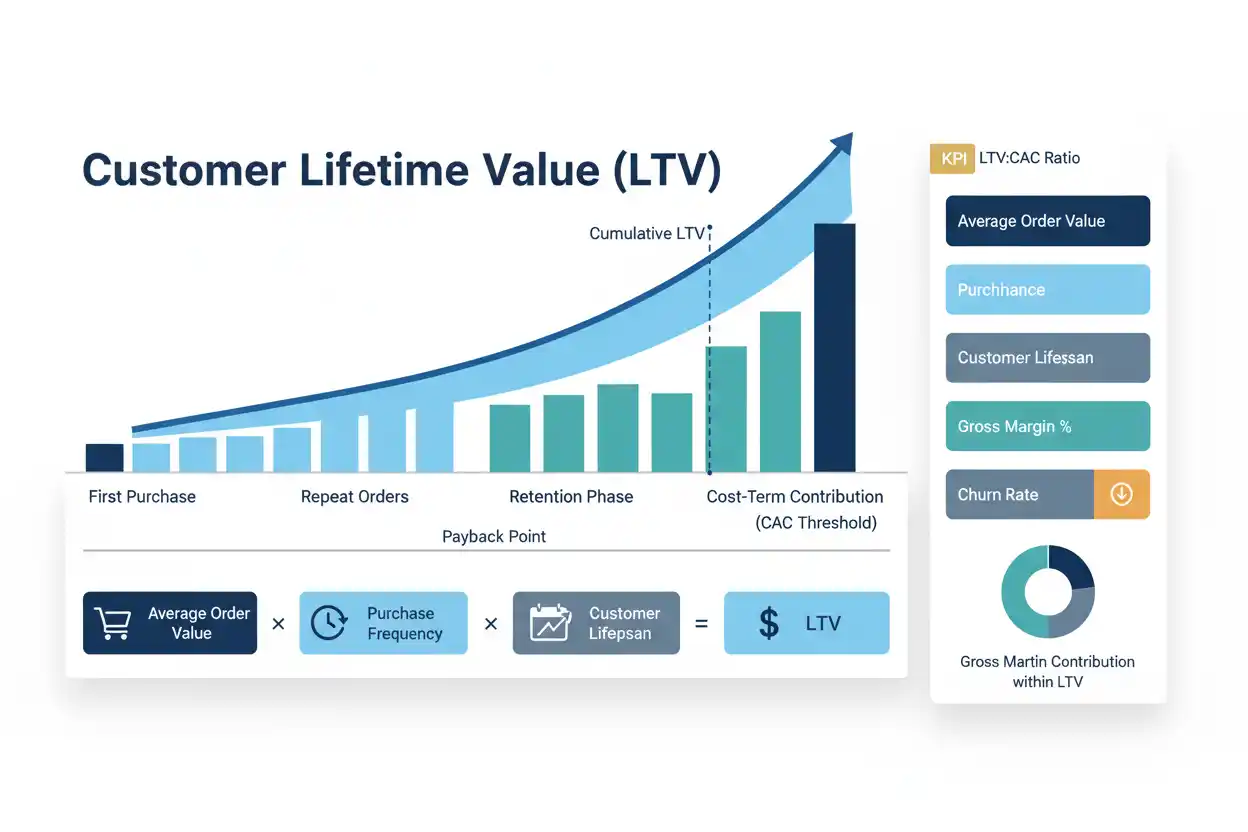
Customer lifetime value estimates the economic value a business expects to receive from a customer over the customer’s relationship with the company. It is commonly abbreviated CLV or LTV.
There is no single customer lifetime value formula that fits every business. A retailer may estimate value from average order value, purchase frequency and customer lifespan. A subscription company may use recurring revenue, gross margin and churn. A more rigorous analysis may measure the cumulative contribution generated by actual customer cohorts.
A simple revenue-based model is:
Customer Lifetime Value = Average Order Value × Purchase Frequency × Average Customer Lifespan
If a customer spends an average of $80 per purchase, buys five times per year and remains active for four years:
Customer Lifetime Value = $80 × 5 × 4
Revenue-Based CLV = $1,600
However, $1,600 of revenue is not $1,600 of economic contribution. Fulfillment, product costs, payment fees, service, retention expenses and other customer-related costs may consume a substantial share of that revenue.
For financial decisions, customer lifetime value becomes more useful when it is connected with contribution margin, customer acquisition cost, retention, cash timing and the broader business finance model.
What Is Customer Lifetime Value?
Customer lifetime value estimates what a customer relationship is worth over a defined economic lifetime.
The metric looks beyond the first transaction.
A customer who spends $50 today but purchases every month for five years can be far more valuable than a customer who spends $200 once and never returns.
CLV therefore connects several parts of customer economics: revenue per customer, purchase frequency, retention, margin and relationship duration.
The precise definition matters. SEC-filed companies use different LTV methodologies, including cumulative revenue, contribution-profit approaches and churn-based formulas. That variation is why CLV should always be accompanied by an explanation of how it was calculated.
Customer Lifetime Value Formula
For a repeat-purchase business, a common simplified model is:
CLV = Average Purchase Value × Average Purchase Frequency × Average Customer Lifespan
Suppose:
Average purchase value = $60
Purchase frequency = 8 purchases per year
Average customer lifespan = 3 years
Then:
CLV = $60 × 8 × 3
CLV = $1,440
This result represents estimated customer revenue over the modeled lifetime.
It does not yet account for the costs required to produce, deliver and support that revenue.
Contribution-Based Customer Lifetime Value
A more financially informative approach applies an economic margin to expected customer revenue.
A simplified formula is:
Contribution-Based CLV = Lifetime Customer Revenue × Contribution Margin Rate
Suppose lifetime customer revenue is $1,440 and the relevant contribution margin rate is 40%.
Contribution-Based CLV = $1,440 × 0.40
Contribution-Based CLV = $576
The customer is expected to produce $576 of contribution under the assumptions used.
That $576 is much more useful when comparing the relationship with acquisition spending than the $1,440 revenue figure.
Public-company disclosures demonstrate this distinction in practice. Mytheresa has defined LTV using cumulative contribution profit by customer cohort rather than cumulative revenue alone, while other issuers have used different definitions.
Customer Lifetime Value Example
Consider an e-commerce business with the following customer economics:
Average order value = $90
Average annual purchase frequency = 4
Average active customer lifespan = 5 years
Contribution margin rate = 35%
First calculate expected lifetime revenue:
Lifetime Revenue = $90 × 4 × 5
Lifetime Revenue = $1,800
Now apply the contribution margin:
Contribution-Based CLV = $1,800 × 35%
Contribution-Based CLV = $630
Under this simplified model, the average customer produces $1,800 of revenue and approximately $630 of contribution across the modeled relationship.
If customer acquisition cost is $180, the relationship can then be assessed relative to the cost of obtaining that customer.
CLV vs LTV
CLV generally means customer lifetime value.
LTV usually means lifetime value.
In many commercial contexts, the abbreviations are used for the same concept.
However, terminology does not guarantee identical calculation methods.
One company may call cumulative customer revenue “LTV.” Another may use gross profit. Another may use contribution profit after fulfillment or retention costs.
SEC filings illustrate precisely this problem: different issuers define LTV differently even while using the same abbreviation.
The calculation definition therefore matters more than whether the label says CLV or LTV.
Revenue-Based CLV vs Profit-Based CLV
A revenue-based CLV tells you how much sales revenue the customer is expected to generate.
A contribution- or profit-based CLV estimates how much of that revenue remains after specified costs.
Suppose expected lifetime revenue is $2,000.
Customer-related variable and fulfillment costs total $1,300.
Lifetime Contribution = $2,000 − $1,300
Lifetime Contribution = $700
If the customer costs $500 to acquire, revenue-based CLV makes the relationship appear extremely attractive:
Revenue CLV:CAC = $2,000 ÷ $500 = 4×
But contribution-based value gives:
Contribution CLV:CAC = $700 ÷ $500 = 1.4×
The second result provides a much more demanding view of the economics.
Customer Lifetime Value and Average Order Value
Average order value influences customer lifetime value because larger transactions can increase revenue generated by each relationship.
Suppose a customer makes four purchases per year for three years.
At $50 average order value:
Lifetime Revenue = $50 × 4 × 3 = $600
At $80 average order value:
Lifetime Revenue = $80 × 4 × 3 = $960
The relationship gains $360 of modeled revenue.
However, higher order value is useful only if the additional sales produce sufficient economic contribution.
Bundling, upselling or premium products can increase order value while also changing costs and margins.
Customer Lifetime Value and Purchase Frequency
Purchase frequency measures how often the customer buys during a defined period.
If average order value remains $75 and the relationship lasts four years:
At two purchases per year:
CLV = $75 × 2 × 4 = $600
At six purchases per year:
CLV = $75 × 6 × 4 = $1,800
Tripling purchase frequency triples revenue-based CLV under this simplified model.
That explains why repeat purchasing can materially change customer economics even when the acquisition cost and first-order value remain unchanged.
Customer Lifetime Value and Customer Lifespan
Customer lifespan represents how long the business expects a customer relationship to remain economically active.
If annual customer revenue is $500:
Two-year lifespan:
Lifetime Revenue = $500 × 2 = $1,000
Five-year lifespan:
Lifetime Revenue = $500 × 5 = $2,500
Longer relationships can therefore increase CLV significantly.
The difficulty is estimating lifespan credibly, particularly for young businesses that do not yet have several years of customer history.
In those cases, cohort analysis and retention modeling can provide more useful evidence than arbitrary lifespan assumptions.
Customer Lifetime Value and Retention
Retention is one of the strongest drivers of lifetime value because customers must remain active to continue generating economic benefits.
SBA customer-service guidance explicitly links stronger customer experience with increased retention, repeat business and referrals.
If retention improves, more customers remain in later periods.
That can increase cumulative revenue and contribution without requiring the company to reacquire the same customers repeatedly.
Retention should nevertheless be assessed economically. Spending $500 to retain a customer who produces only $100 of additional contribution does not create value simply because retention improved.
Customer Lifetime Value and Churn
Churn represents customer loss during a period and is particularly important for recurring-revenue businesses.
Under highly simplified steady-state assumptions, expected customer lifetime is sometimes approximated using the inverse of churn:
Estimated Customer Lifetime ≈ 1 ÷ Churn Rate
If monthly churn is 5%:
Estimated Lifetime ≈ 1 ÷ 0.05
Estimated Lifetime ≈ 20 months
This shortcut depends on strong assumptions about a stable retention process and should not replace observed cohort data when reliable history exists.
SEC-filed Nuvini has disclosed an LTV methodology that incorporates average churn, ARPU and gross margin, illustrating how recurring-revenue businesses may connect retention directly with economic value.
Churn-Based CLV Formula
A simplified subscription model can be expressed as:
CLV ≈ Average Revenue per Customer × Gross Margin Rate ÷ Churn Rate
Suppose monthly revenue per customer is $100, gross margin is 70%, and monthly churn is 4%.
Monthly gross profit per customer is:
Monthly Gross Profit = $100 × 0.70 = $70
Approximate CLV:
CLV ≈ $70 ÷ 0.04
CLV ≈ $1,750
This simplified model assumes stable churn, revenue and margins.
When those factors change by customer age or cohort, a more detailed retention model is preferable.
Why Cohort Analysis Improves CLV
A cohort groups customers by a shared starting period or characteristic.
For example, all customers making their first purchase in January can form one acquisition cohort.
Management can then track that cohort’s subsequent purchases, revenue, contribution and retention over time.
Suppose a January cohort contains 1,000 new customers.
After one year, it has produced $400,000 of cumulative contribution.
Cumulative Contribution per Original Customer = $400,000 ÷ 1,000
Cumulative Contribution = $400
If cumulative contribution reaches $650,000 after two years:
Two-Year Contribution per Original Customer = $650
This method measures what the cohort actually produced rather than relying solely on average-frequency assumptions.
Mytheresa’s SEC disclosures provide a real example of defining LTV from cumulative contribution profit attributable to a customer cohort.
Historical CLV vs Predictive CLV
Historical CLV measures value already generated by customers.
Predictive CLV estimates value customers may generate in the future.
Historical calculations require fewer assumptions but cannot describe value that has not yet been realized.
Predictive calculations support forward decisions but depend on retention, purchasing, margin and lifespan assumptions.
A mature business may have enough customer history to build robust models.
A new business may have to rely more heavily on early cohorts and scenario ranges.
The distinction should be explicit whenever CLV is used for budgeting or valuation.
Customer Lifetime Value and CAC
Customer lifetime value is frequently compared with customer acquisition cost.
The relationship is commonly written:
LTV:CAC = Customer Lifetime Value ÷ Customer Acquisition Cost
Suppose contribution-based CLV is $900 and CAC is $300.
LTV:CAC = $900 ÷ $300
LTV:CAC = 3×
The estimated customer value is three times acquisition cost under those definitions.
Remitly has disclosed LTV/CAC as lifetime value divided by CAC and described the metric as a way to assess return on marketing spend.
The important qualification is that a ratio is only as meaningful as the underlying LTV and CAC definitions.
Is a 3:1 LTV:CAC Ratio Always Good?
No.
The frequently repeated idea that every business should target a specific universal LTV:CAC ratio oversimplifies customer economics.
Two companies can both report 3× but face very different realities.
One may recover CAC in two months while another waits three years.
One may calculate LTV using contribution profit while another uses revenue.
One may have highly predictable retention while another depends on uncertain forecasts.
Cash requirements, overhead, capital intensity, customer concentration and growth rates also differ.
Use LTV:CAC as a decision metric, not a universal grading scale.
Customer Lifetime Value and CAC Payback
LTV:CAC measures the eventual relationship between modeled customer value and acquisition cost.
CAC payback asks how quickly acquisition cost is recovered.
Suppose CAC is $600 and monthly customer contribution is $100.
CAC Payback = $600 ÷ $100
CAC Payback = 6 months
Now consider another customer with the same $600 CAC and the same total lifetime contribution but only $25 of contribution per month.
CAC Payback = $600 ÷ $25
CAC Payback = 24 months
Both relationships might ultimately generate the same CLV, yet the second requires much more financing time.
This is why CLV should be connected with cash flow forecasting rather than evaluated only as an eventual total.
Customer Lifetime Value and Contribution Margin
Contribution margin determines how much customer revenue remains after relevant variable costs.
Suppose two customer segments each generate $2,000 of expected lifetime revenue.
Segment A has a 60% contribution margin:
Contribution CLV = $2,000 × 0.60 = $1,200
Segment B has a 20% contribution margin:
Contribution CLV = $2,000 × 0.20 = $400
Revenue CLV is identical.
Economic contribution is not.
Customer lifetime value should therefore use a value definition aligned with the decision being made.
Customer Lifetime Value and Gross Margin
Gross margin is frequently incorporated into subscription LTV models because it adjusts customer revenue for cost of sales.
Suppose a customer generates $1,500 of expected lifetime revenue.
At 80% gross margin:
Gross-Profit-Based LTV = $1,500 × 0.80 = $1,200
At 30% gross margin:
Gross-Profit-Based LTV = $1,500 × 0.30 = $450
The same revenue produces dramatically different economic value.
Karooooo’s 2026 SEC-filed results describe an LTV approach incorporating subscription revenue gross margin and churn, demonstrating how company-specific unit economics can combine these inputs.
Gross Margin CLV vs Contribution CLV
Gross-margin-based CLV deducts cost of sales.
Contribution-based CLV can deduct additional customer-related variable expenses.
Suppose lifetime revenue is $1,000.
Cost of sales is $300.
Gross profit:
Gross Profit = $1,000 − $300 = $700
Suppose another $150 is expected for fulfillment, payment charges and customer-specific service.
Contribution value becomes:
Contribution Value = $700 − $150 = $550
Which number should be called CLV depends on the company’s methodology.
For customer acquisition decisions, the $550 figure may provide a more conservative economic basis.
CLV and Discounts
Discounts can affect CLV in competing ways.
A discount reduces revenue or margin per transaction.
However, it may increase purchase frequency, retention or customer conversion.
Suppose a loyalty offer reduces contribution per order from $30 to $27 but increases average annual purchases from four to six.
Before:
Annual Contribution = $30 × 4 = $120
After:
Annual Contribution = $27 × 6 = $162
The discount lowers unit contribution but increases annual contribution under the example.
The decision should therefore consider total customer behavior rather than the percentage discount alone.
CLV and Pricing
Pricing influences lifetime value through revenue, margin, purchase frequency and retention.
A higher price can increase contribution per sale while potentially reducing purchase frequency or increasing churn.
A lower price can improve conversion or retention but compress margins.
Cost-plus pricing begins from costs, while target pricing approaches pricing from another financial objective.
Customer lifetime value adds a longer-term customer perspective:
How does the pricing decision affect value across the full relationship rather than only the first sale?
CLV and Product Mix
Customers do not necessarily purchase the same product repeatedly.
A customer may begin with an entry-level product and later buy premium services, accessories or complementary offerings.
That means historical first-order value can be a weak proxy for lifetime economics.
Customer-level analysis can reveal which initial purchases lead to stronger long-term relationships.
This is especially important for companies using low-margin entry products to acquire customers for higher-value future purchases.
CLV and Cross-Selling
Cross-selling can increase lifetime value by expanding the range of products purchased by an existing customer.
Suppose a customer’s core product relationship generates $500 of contribution.
Relevant complementary products add another $200 over the relationship.
Expanded Customer Contribution = $500 + $200
Expanded CLV = $700
The acquisition cost has already been incurred, although cross-selling itself can involve marketing and servicing expense.
Its economics should therefore be evaluated on incremental contribution rather than added revenue alone.
CLV and Upselling
Upselling moves customers toward higher-value versions, plans or quantities.
If the additional revenue produces attractive incremental contribution without causing excessive churn, lifetime value can rise.
However, pressuring customers into unsuitable upgrades can damage retention and future value.
CLV is useful precisely because it discourages optimizing a single transaction at the expense of the relationship.
Customer Service and Lifetime Value
Customer service can influence retention, repeat purchasing and referrals.
SBA customer-service programs explicitly connect positive customer experiences with stronger retention and repeat business.
The financial question is whether service investment generates sufficient incremental customer value.
Suppose enhanced service costs $40 per customer but increases expected lifetime contribution by $150.
The incremental economics are potentially attractive.
If the same program costs $200 and adds only $50 of contribution, the result is different.
Customer Lifetime Value and Referrals
Some customers create value beyond their own purchases by referring new customers.
A sophisticated CLV framework may analyze referral effects separately.
Suppose an existing customer generates $700 of direct contribution and historically produces referral activity associated with another $100 of expected contribution after relevant acquisition costs.
A broader relationship-value framework could recognize both sources.
However, speculative referral value should not be added mechanically to every customer.
It should be supported by observed behavior and a clear methodology.
Customer Lifetime Value and Cash Flow
CLV can be economically attractive while the business still experiences cash pressure.
Suppose a customer costs $500 to acquire today and is expected to generate $1,500 of contribution over five years.
That relationship appears attractive in total.
Yet the company still needs to finance the initial $500 acquisition expenditure while waiting for future customer cash.
Cash flow forecasting provides the timing dimension that lifetime value alone lacks.
Value and liquidity are related, not identical.
Customer Lifetime Value and Burn Rate
A fast-growing company can increase burn rate while acquiring economically attractive customers.
Suppose every $300 of CAC is expected to generate $1,200 of contribution over several years.
Acquiring 10,000 customers quickly could require $3 million of upfront acquisition expenditure.
The eventual CLV may support the investment, yet current cash consumption can still become substantial.
Growth rate therefore needs to be aligned with available financing.
Customer Lifetime Value and Cash Runway
Cash runway can shorten when customer acquisition is financed upfront and customer value arrives slowly.
Suppose a company has $2 million of cash.
Increasing acquisition spending raises net monthly burn from $100,000 to $250,000.
Before expansion:
Runway = $2,000,000 ÷ $100,000 = 20 months
After expansion:
Runway = $2,000,000 ÷ $250,000 = 8 months
The company may still be creating valuable customer relationships, but it has dramatically reduced the time available before additional cash is required.
Strong CLV does not eliminate financing risk.
Customer Lifetime Value and Break-Even
Break-even analysis can incorporate customer-level contribution when customers are the economically meaningful unit.
Suppose fixed costs are $300,000 and expected contribution per customer after qualifying variable costs is $150.
Break-Even Customers = $300,000 ÷ $150
Break-Even Customers = 2,000 customers
If customer acquisition itself is a variable cost in the model, that cost needs to be reflected in the contribution available to cover fixed expenses.
Using lifetime revenue instead of economic contribution can substantially understate the true break-even requirement.
Customer Lifetime Value and Business Valuation
Business valuation may be influenced by customer retention, repeat revenue, margins and the scalability of customer economics.
A company with durable customer relationships and attractive acquisition economics may support stronger future cash-flow assumptions than an otherwise similar business with poor retention.
However, CLV is not itself a valuation multiple.
Company value also depends on overhead, capital requirements, competitive risk, financing, customer concentration, taxes, growth and other factors.
Customer lifetime value provides evidence about one component of the operating model.
Customer Lifetime Value and Startup Valuation
Startup valuation often involves businesses whose current accounting profit does not yet represent expected future economics.
CLV can help explain the potential value of a growing customer base.
However, early-stage CLV estimates are particularly sensitive to limited retention history.
A startup with only 12 months of operations should be careful about projecting five- or ten-year customer relationships from a small amount of data.
Scenario ranges and cohort evidence are generally more informative than false precision.
Customer Lifetime Value and Average Revenue per User
Average revenue per user can be an input into subscription CLV models.
Suppose monthly ARPU is $80, gross margin is 75%, and expected customer lifetime is 24 months.
Monthly gross profit per customer:
Monthly Gross Profit = $80 × 0.75 = $60
Estimated gross-profit-based LTV:
LTV = $60 × 24
LTV = $1,440
ARPU by itself measures revenue intensity, while CLV extends that economics across the expected relationship duration.
CLV and Customer Segmentation
One company-wide average can hide very different customer groups.
Suppose:
Segment A CLV = $200
Segment B CLV = $900
Segment C CLV = $3,000
A blended company average of $800 does not accurately describe any of those segments.
Segment analysis can influence acquisition budgets, service levels, retention programs and product strategy.
The objective is not necessarily to abandon low-CLV customers. Some segments may have low servicing costs, strategic importance or referral value.
Segmentation simply exposes economics hidden inside the average.
How to Improve Customer Lifetime Value
Customer lifetime value can increase through higher purchase value, greater purchase frequency, stronger retention, longer relationships, better contribution margins or an economically sound combination of these factors.
A business might improve product quality, customer onboarding, service, cross-selling, pricing, loyalty programs or retention communications.
Cost improvements can also raise contribution-based CLV even when revenue does not change.
The objective is sustainable economic value.
Artificially raising prices can increase short-term revenue while reducing retention. Excessive discounts can increase repeat purchasing while destroying contribution.
Every intervention should therefore be evaluated across the customer relationship.
Is a Higher CLV Always Better?
Generally, more economic value per customer is desirable.
However, increasing CLV can require additional spending.
Suppose a premium support program raises CLV by $100 but costs $150 per customer.
Headline revenue-based CLV may increase while actual economics weaken.
Similarly, customers with very high projected CLV can require long payback periods or substantial working capital.
The goal is not maximum theoretical CLV. It is attractive risk-adjusted and cash-aware customer economics.
What Is a Good Customer Lifetime Value?
There is no universal good CLV amount.
A $500 CLV might be outstanding for a company acquiring customers for $20.
A $20,000 CLV might be inadequate when CAC is $18,000 and service costs remain high.
The number must be interpreted against customer acquisition cost, margins, retention, payback period, overhead and cash requirements.
Cross-company CLV comparisons are particularly risky because companies can define lifetime value differently. SEC filings show revenue-based, contribution-based and churn-based methodologies in actual use.
Common Customer Lifetime Value Mistakes
The biggest mistake is presenting revenue as economic value without saying so.
Another is assuming customer lifespan without enough retention evidence.
Using a simple inverse-churn shortcut when churn changes significantly by customer age can also distort results.
Businesses may combine old and new customer cohorts whose economics differ materially.
CLV can also be overstated by ignoring fulfillment, service, retention or other customer-related costs.
Finally, comparing one company’s CLV with another company’s number without checking definitions can be meaningless.
How to Calculate CLV Properly
Begin by defining what “value” means for the decision.
Is the objective lifetime revenue, gross profit, contribution profit or another economic measure?
Then define the customer cohort and measurement period.
Estimate or observe purchase value, purchase frequency and retention.
Apply the relevant cost or margin assumptions.
Compare predicted results with mature historical cohorts where possible.
Next, connect CLV with CAC and payback.
Finally, test downside assumptions.
A model that produces one precise number without showing how retention, margins or customer behavior affect the result provides less decision value than a transparent range.
Frequently Asked Questions
What is customer lifetime value?
Customer lifetime value estimates the revenue, gross profit, contribution or other defined economic value expected from a customer over the customer relationship.
What does CLV stand for?
CLV stands for customer lifetime value.
What does LTV stand for?
LTV stands for lifetime value. In customer economics, LTV and CLV are often used for closely related concepts, although calculation definitions vary.
What is the customer lifetime value formula?
A simple repeat-purchase formula is:
CLV = Average Purchase Value × Purchase Frequency × Customer Lifespan
More advanced models may incorporate margin, retention, churn or cohort behavior.
How do you calculate contribution-based CLV?
A simplified approach is:
Contribution-Based CLV = Lifetime Customer Revenue × Contribution Margin Rate
What is the difference between CLV and CAC?
CLV estimates value generated by the customer relationship. CAC measures the cost of acquiring the customer.
What is LTV:CAC?
LTV:CAC = Lifetime Value ÷ Customer Acquisition Cost
It compares modeled customer value with acquisition cost.
Is 3:1 always a good LTV:CAC ratio?
No. Definitions, margins, payback time, retention reliability, overhead and cash requirements differ across businesses. There is no universal ratio that determines financial quality.
How does churn affect customer lifetime value?
Higher churn generally shortens customer relationships and reduces modeled lifetime value when other factors remain unchanged.
Does CLV include gross margin?
It can. Some models use revenue only, while others use gross-profit or contribution-based value. The methodology should state which version is being calculated.
Can customer lifetime value be negative?
Yes, under an economic-value framework a customer relationship can produce negative value if acquisition, fulfillment, service, retention and other attributable costs exceed the economic benefits generated.
How can a business increase CLV?
Higher purchase value, greater purchase frequency, stronger retention, improved margin, cross-selling and better customer economics can increase CLV when the incremental benefits exceed their costs.
Final Perspective
Customer lifetime value shifts financial analysis from the first transaction to the complete customer relationship.
A simple revenue model is:
CLV = Average Purchase Value × Purchase Frequency × Customer Lifespan
A contribution-based model goes further:
Contribution-Based CLV = Lifetime Revenue × Contribution Margin Rate
The second calculation often provides a stronger basis for financial decisions because revenue alone does not show what the business keeps.
CLV becomes even more informative when paired with acquisition cost:
LTV:CAC = Customer Lifetime Value ÷ Customer Acquisition Cost
Yet none of these formulas eliminates the need for judgment.
Retention can change. Margins can move. New cohorts can behave differently from old ones. Customer value can arrive slowly even when the eventual economics are attractive.
The useful question is therefore not merely:
“How much is a customer worth?”
It is:
“How much sustainable economic value does this customer relationship generate, how confidently can we estimate it, what did it cost to acquire, and how long does it take for that value to become real?”




