


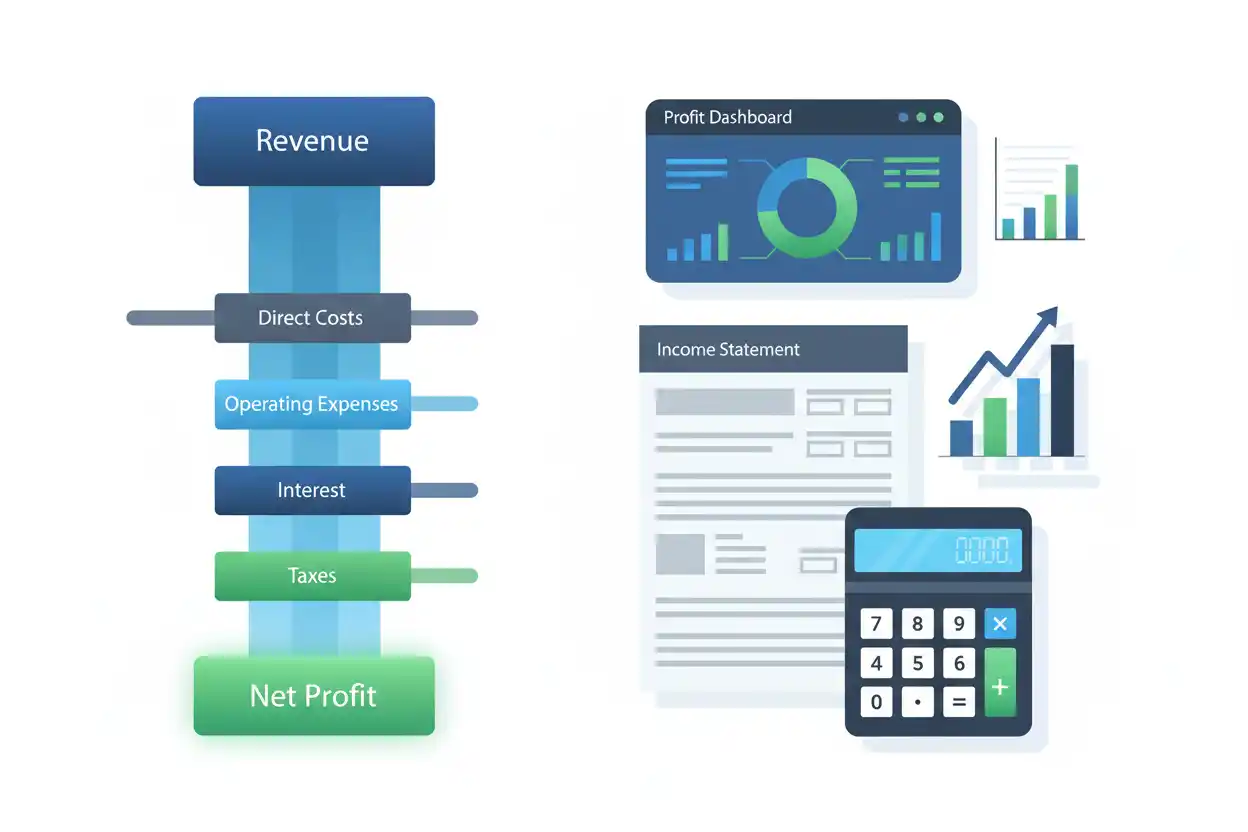
Net profit is the amount of earnings left after a business subtracts all expenses recognized for the period from its revenue. It sits at the bottom of the income statement, which is why net profit is often called the bottom line.
If a business earns $1 million in revenue and records $900,000 of total expenses, its net profit is $100,000.
Net Profit = $1,000,000 − $900,000 = $100,000
That $100,000 represents final accounting profit for the period under the figures included in the calculation. It is different from gross profit, operating profit, cash flow, and the percentage-based net profit margin.
Within business finance, net profit provides one of the clearest summaries of whether the revenue generated during a period ultimately exceeded the expenses recognized against it.
What Is Net Profit?
Net profit is the final amount remaining after all applicable costs and expenses have been deducted from revenue.
In a simplified income statement:
Revenue
− Cost of goods sold
= Gross profit
− Operating expenses
= Operating profit
− Interest and other expenses
− Taxes
= Net profit
The exact presentation can differ between businesses, but the economic idea remains the same: net profit represents the final earnings after moving through the major layers of the income statement.
Net profit can be positive, zero, or negative.
A negative net profit is normally described as a net loss.
Net Profit Formula
The broad formula is:
Net Profit = Total Revenue − Total Expenses
A more detailed version can be represented as:
Net Profit = Revenue − Cost of Goods Sold − Operating Expenses − Interest − Taxes − Other Net Expenses
Depending on the company’s financial statements, gains, losses, non-operating income, discontinued operations, and other items may also affect the final reported result.
The important principle is that net profit sits after the broader set of recognized revenues, costs, and expenses.
How to Calculate Net Profit
Suppose a company reports:
Revenue = $2,000,000
Cost of goods sold = $1,100,000
Operating expenses = $500,000
Interest expense = $80,000
Taxes = $90,000
First calculate gross profit:
Gross Profit = $2,000,000 − $1,100,000
Gross Profit = $900,000
Next subtract operating expenses:
Operating Profit = $900,000 − $500,000
Operating Profit = $400,000
Then subtract interest:
Profit Before Tax = $400,000 − $80,000
Profit Before Tax = $320,000
Finally subtract taxes:
Net Profit = $320,000 − $90,000
Net Profit = $230,000
The company’s net profit is $230,000.
This example simplifies the income statement, but it shows how revenue passes through multiple cost layers before reaching final profit.
Net Profit Example
Consider a small business with annual results of:
Sales revenue: $750,000
Cost of products sold: $300,000
Employee and administrative expenses: $230,000
Rent and other operating costs: $90,000
Interest expense: $20,000
Taxes: $25,000
Total expenses are:
$300,000 + $230,000 + $90,000 + $20,000 + $25,000 = $665,000
Net profit is:
Net Profit = $750,000 − $665,000
Net Profit = $85,000
The business therefore earned $85,000 after the expenses in this simplified example.
The calculation does not mean $85,000 necessarily arrived in cash during the year. Accounting earnings and cash generation can differ materially.
Why Net Profit Is Called the Bottom Line
On a traditional income statement, revenue appears near the top and progressively broader categories of expenses are deducted as the statement moves downward.
The final earnings figure therefore appears near the bottom.
That is the origin of the expression bottom line.
When someone says a decision “improves the bottom line,” they generally mean it increases final profit rather than merely increasing sales or gross profit.
However, a higher top line—meaning revenue—does not automatically produce a higher bottom line.
Revenue can grow while net profit falls if costs rise faster than sales.
Net Profit vs Gross Profit
Gross profit is calculated much earlier in the income statement.
Its basic formula is:
Gross Profit = Revenue − Cost of Goods Sold
Net profit includes a much broader set of expenses.
Suppose:
Revenue = $1,000,000
Cost of goods sold = $600,000
Other expenses = $330,000
Gross profit is:
$1,000,000 − $600,000 = $400,000
Net profit is:
$400,000 − $330,000 = $70,000
The business therefore has $400,000 of gross profit but only $70,000 of final net profit.
Gross profit tells you what remains after direct cost of sales.
Net profit tells you what remains after the broader expense structure.
Net Profit vs Gross Margin
Gross margin expresses gross profit as a percentage of revenue.
Suppose gross profit is $400,000 on revenue of $1 million.
Gross Margin = $400,000 ÷ $1,000,000 × 100
Gross Margin = 40%
That does not mean the company earns 40% net profit.
If its final net profit is $70,000, considerably less remains after operating expenses, financing costs, taxes, and other applicable items.
Gross margin helps evaluate the economics between sales and direct cost of sales. Net profit measures the final accounting outcome.
Net Profit vs Operating Profit
Operating profit measures profit generated from the company’s operations before certain non-operating and financing items.
Suppose:
Gross profit = $600,000
Operating expenses = $350,000
Operating profit:
$600,000 − $350,000 = $250,000
If interest and taxes then total $80,000:
Net Profit = $250,000 − $80,000
Net Profit = $170,000
Operating profit helps isolate operating performance.
Net profit incorporates additional items that determine the final earnings attributable to the period.
Net Profit vs Operating Margin
Operating margin converts operating profit into a percentage of revenue.
For example, operating profit of $250,000 on $1 million of revenue gives:
Operating Margin = 25%
If net profit is $170,000:
Net Profit Margin = 17%
The gap reflects expenses and other items recognized between operating profit and net profit.
This distinction makes operating margin useful for evaluating core operations without allowing financing or tax differences to dominate the comparison.
Net Profit vs EBIT
EBIT means earnings before interest and taxes.
A simplified relationship is:
EBIT − Interest − Taxes ≈ Net Profit
provided no additional material items change the calculation.
Suppose:
EBIT = $500,000
Interest expense = $80,000
Taxes = $100,000
Then:
Net Profit ≈ $500,000 − $80,000 − $100,000
Net Profit ≈ $320,000
EBIT intentionally stops before financing costs and taxes.
Net profit incorporates them.
Net Profit vs EBITDA
EBITDA sits even farther from final net profit because it excludes interest, taxes, depreciation, and amortization under its standard interpretation.
A company can therefore report substantial EBITDA while generating comparatively little net profit.
Suppose:
EBITDA = $1,000,000
Depreciation and amortization = $300,000
Interest = $200,000
Taxes and other net expenses = $150,000
In this simplified example:
Net Profit = $1,000,000 − $300,000 − $200,000 − $150,000
Net Profit = $350,000
EBITDA can provide useful operating context, but it should not be presented as though it were final earnings.
Net Profit vs Net Profit Margin
Net profit and net profit margin are directly related but answer different questions.
Net profit is a dollar amount.
Net profit margin is a percentage of revenue.
The margin formula is:
Net Profit Margin = Net Profit ÷ Revenue × 100
Suppose:
Revenue = $800,000
Net profit = $80,000
Then:
Net Profit Margin = $80,000 ÷ $800,000 × 100
Net Profit Margin = 10%
This article owns the core net profit earnings calculation. The dedicated Net Profit Margin page owns the percentage calculation and deeper margin interpretation.
What Does Positive Net Profit Mean?
Positive net profit means the company’s recognized revenue exceeded its recognized expenses for the period.
If revenue is $2 million and total expenses are $1.8 million:
Net Profit = $200,000
The business has positive accounting earnings.
However, positive net profit does not automatically mean the company has strong liquidity, positive free cash flow, low debt, or a high investment return.
It answers one specific question:
Did reported revenues exceed reported expenses after the applicable income-statement items were recognized?
What Does Negative Net Profit Mean?
Negative net profit means expenses exceeded revenue.
Suppose:
Revenue = $500,000
Total expenses = $575,000
Net Profit = $500,000 − $575,000
Net Profit = −$75,000
The company therefore reports a $75,000 net loss.
A single loss period does not always mean the underlying business is permanently uneconomic.
Losses can result from startup investment, restructuring, cyclical weakness, unusual charges, depreciation, interest burden, litigation, impairments, or declining operations.
The cause matters.
A business losing money because of a temporary one-time expense is different from one whose normal sales consistently fail to cover its recurring cost structure.
Can Net Profit Be Zero?
Yes.
If total revenue exactly equals total expenses:
Net Profit = $0
The business breaks even at the final accounting-profit level.
This does not necessarily mean its operating break-even point was exactly met under every managerial definition.
The dedicated break-even analysis framework focuses on the relationship among price, variable costs, fixed costs, and sales volume.
Net profit reflects the final reported result after the broader income-statement structure.
What Increases Net Profit?
Net profit can increase when revenue rises faster than expenses, costs decline without an offsetting decline in sales, pricing improves, product mix becomes more profitable, financing costs decrease, tax expense declines, or other income improves.
Suppose revenue rises by $100,000 while total expenses rise by only $60,000.
All else equal:
Increase in Net Profit = $100,000 − $60,000
Increase in Net Profit = $40,000
However, the reason for the change should be examined.
A company that increases net profit through sustainable operating improvements presents different economics from one whose profit rose because of a one-time asset gain.
What Reduces Net Profit?
Net profit decreases when expenses grow faster than revenue or when revenue declines without an equivalent reduction in costs.
Higher materials costs, wages, rent, marketing expense, depreciation, interest, taxes, warranty claims, returns, restructuring expenses, or other losses can reduce final profit.
The distinction between fixed costs and variable costs becomes important when evaluating how expenses respond to changes in sales volume.
A business with high fixed costs may experience a sharp decline in net profit when revenue falls because much of its expense base remains in place.
Net Profit and Pricing
Pricing can influence net profit through both revenue and unit economics.
Suppose a company sells 10,000 units for $100 each.
Revenue is:
10,000 × $100 = $1,000,000
If the selling price rises to $105 and sales volume remains unchanged:
10,000 × $105 = $1,050,000
Revenue increases by $50,000.
If costs do not materially change, much of that increase can flow toward additional profit.
However, higher prices can also reduce sales volume. Consequently, pricing decisions should evaluate demand as well as arithmetic.
The difference between markup and selling-price margin is particularly important when determining whether a price actually supports the intended economics.
Net Profit and Margin vs Markup
The workbook directly maps margin vs markup because pricing percentages can affect the path toward final profit.
Markup measures profit above a defined cost relative to that cost.
Margin measures profit relative to selling price or revenue.
Neither represents company-wide net profit unless the calculation includes every relevant expense.
For example, a product can carry a 100% markup while the company ultimately generates a 5% net profit margin because operating expenses, marketing, interest, taxes, and other costs consume most of the gross profit.
Net Profit and Cost of Goods Sold
Cost of goods sold directly influences the path from revenue to final profit.
Suppose sales remain $1 million while COGS rises from $500,000 to $600,000.
If nothing else changes, gross profit falls by $100,000, which can reduce net profit by roughly the same pretax amount.
Businesses therefore often investigate supplier prices, manufacturing efficiency, purchasing terms, labor, materials, and product mix when profitability declines.
Reducing COGS can improve net profit, but cutting cost in ways that damage quality or sales can produce the opposite result over time.
Net Profit and Interest Expense
Interest expense can materially reduce net profit even when operating performance is strong.
Suppose EBIT is $500,000.
Company A pays $50,000 in interest.
Company B pays $250,000.
Before considering taxes and other differences, Company B has $200,000 less earnings remaining after financing costs.
This is why interest coverage provides useful context alongside net profit. It focuses specifically on the relationship between earnings and the interest burden.
Net Profit and Financial Leverage
Financial leverage can magnify the effects of financing on earnings available to equity holders.
Debt financing may allow a business to operate with less equity capital, but it introduces interest expense and contractual payment obligations.
If borrowed capital produces operating returns above its cost, leverage may benefit equity returns.
If operations weaken, the interest burden can reduce net profit more sharply.
Net profit therefore reflects some of the consequences of financing choices without, by itself, measuring the full amount of leverage.
Net Profit and Debt-to-Equity
The debt-to-equity ratio measures capital structure rather than profitability.
A highly leveraged company can report strong net profit.
A company with little debt can report a net loss.
However, debt levels can influence future net profit through interest expense and financial risk.
For that reason, profitability and leverage metrics should be evaluated together rather than assuming one substitutes for the other.
Net Profit vs Operating Cash Flow
Net profit is an accounting earnings measure. Operating cash flow measures cash generated or consumed through operating activities.
They can differ substantially.
Suppose a company sells $500,000 of products on credit and recognizes the related revenue and profit today.
If customers have not yet paid, the income statement can show profit before the related cash has been collected.
Likewise, noncash expenses such as depreciation can reduce accounting profit without representing a current-period cash payment.
Therefore:
Net Profit ≠ Operating Cash Flow
Both metrics are useful, but they answer different questions.
Net Profit vs Free Cash Flow
Free cash flow considers cash generation after relevant capital expenditures under its formula.
A company can report positive net profit and negative free cash flow when it invests heavily in property, equipment, working capital, or other long-term needs.
For example:
Net profit = $300,000
Operating cash flow = $400,000
Capital expenditure = $600,000
A simplified free cash flow calculation would be:
Free Cash Flow = $400,000 − $600,000
Free Cash Flow = −$200,000
The company is profitable on an accounting basis but consumes cash after capital investment.
This distinction becomes particularly important for capital-intensive businesses.
Net Profit and Working Capital
Changes in working capital can create differences between reported profit and cash generation.
Suppose net profit rises because sales increase rapidly.
If most of those additional sales remain unpaid in accounts receivable, the company may need more cash to finance operations despite reporting higher earnings.
Likewise, purchasing large amounts of inventory can use cash before the products are sold.
Net profit therefore shows accounting performance, while working-capital movements help explain why cash may move differently.
Net Profit and Cash Flow Forecasting
Historical net profit shows what happened during a prior period.
Cash flow forecasting addresses the timing of future cash receipts and payments.
A profitable business can still run short of cash if major payments fall due before customer collections arrive.
For management purposes, profitability analysis and cash forecasting should therefore operate together.
Net profit helps answer whether the business model is producing earnings.
Cash forecasting helps answer whether enough cash will be available at the required time.
Net Profit vs Net Present Value
The workbook directly maps net present value to this page because the words “net” and “profit” can cause users to confuse accounting earnings with investment value.
Net profit measures earnings over a reporting period.
NPV discounts an investment’s expected cash flows across multiple periods and compares them with the required investment.
A project can generate positive annual net profit yet have negative NPV if the initial investment is too large or the returns arrive too slowly.
Conversely, a project can create positive NPV while reporting limited accounting profit in its early years.
The metrics answer fundamentally different questions.
Net Profit and Return on Assets
Return on assets places profit in the context of the asset base used to generate it.
Suppose two businesses each earn $500,000 of net profit.
Company A uses $2 million of assets.
Company B uses $10 million.
Their net profit dollars are identical, but their asset efficiency may be very different.
Net profit therefore becomes more informative when paired with return measures that show how much capital or assets were required to generate those earnings.
Net Profit and Return on Equity
Return on equity relates profit to shareholders’ equity.
Suppose:
Net profit = $200,000
Average shareholders’ equity = $1,000,000
A simplified ROE calculation is:
ROE = $200,000 ÷ $1,000,000 × 100
ROE = 20%
The net profit figure is the earnings amount.
ROE uses that earnings amount to evaluate return relative to equity capital.
This is another example of why absolute profit and return percentages should not be confused.
Net Profit and Business Scale
A higher net profit does not automatically mean a company is more efficient.
Suppose Company A earns $10 million of net profit on $500 million of revenue.
Company B earns $5 million on $25 million of revenue.
Company A earns more total profit dollars, but Company B retains a much larger portion of each sales dollar.
This is where net profit margin provides additional context.
Absolute profit measures scale.
Margin measures profitability relative to revenue.
Net Profit Growth
Net profit growth measures how final earnings change between periods.
A basic growth calculation is:
Net Profit Growth = (Current Net Profit − Previous Net Profit) ÷ Previous Net Profit × 100
Suppose net profit rises from $200,000 to $250,000:
Net Profit Growth = ($250,000 − $200,000) ÷ $200,000 × 100
Net Profit Growth = 25%
The company increased net profit by 25%.
However, the source of that growth matters. Analysts should distinguish sustainable operating improvements from unusual gains, tax effects, financing changes, or temporary expense reductions.
Revenue Growth Without Net Profit Growth
A business can grow sales while becoming less profitable.
Suppose:
Year 1 revenue = $1 million
Year 1 net profit = $100,000
Year 2 revenue = $1.5 million
Year 2 net profit = $75,000
Revenue increased by 50%, but net profit fell by 25%.
Possible explanations include lower pricing, rising product costs, additional employees, higher marketing expense, interest costs, expansion expenses, or other pressures.
Growth therefore should not be judged only from the top line.
The quality of growth depends on what happens to profitability and cash generation.
Falling Revenue With Rising Net Profit
The opposite can also occur.
Suppose a company exits unprofitable product lines.
Revenue falls from $10 million to $9 million, but net profit rises from $200,000 to $600,000.
The company has become smaller by revenue but more profitable in dollar terms.
This example illustrates why revenue growth alone does not determine business performance.
Pricing, product mix, cost structure, and operating discipline all affect the bottom line.
Net Profit and Taxes
Taxes can materially affect the final amount reported as net profit.
Two companies with identical operating profit can report different net profit if their tax expense differs.
Tax outcomes may be influenced by jurisdiction, deductions, credits, loss carryforwards, legal structure, deferred tax accounting, and other factors.
For analytical purposes, users should therefore avoid assuming that a change in net profit necessarily originated from the company’s core operations.
Examining operating profit and the tax line separately can help identify the source.
Net Profit and One-Time Items
Unusual gains or losses can distort net profit for a particular period.
Examples can include asset sales, impairments, restructuring expenses, legal settlements, acquisition-related costs, and other nonrecurring items.
Suppose normal operations generate $2 million of earnings but an asset sale produces an additional $5 million gain.
Reported net profit may rise dramatically even though the recurring business did not improve by the same amount.
Analysts should therefore distinguish reported net profit from the underlying drivers of that result.
Any adjusted measure should be clearly defined rather than assuming every excluded expense is irrelevant.
Net Profit and Depreciation
Depreciation reduces accounting earnings even though it does not represent a current cash payment in the period in which the expense is recognized.
Suppose equipment was purchased in an earlier period and its cost is allocated through depreciation over several years.
Each year’s depreciation expense can reduce operating profit and net profit.
However, the cash outflow occurred when the equipment was purchased.
This timing difference helps explain why net profit and cash flow can diverge.
Net Profit and NFT Profit
The workbook maps NFT profit as a specific sibling use case.
An asset-level profit calculation involving NFTs may need to account for purchase cost, sale proceeds, marketplace fees, creator royalties, network fees, and other transaction expenses.
That calculation remains narrower than company-wide net profit.
A business’s net profit includes the broader revenues and expenses reported for the entire accounting period, while NFT Profit owns the transaction-specific fees-and-royalties intent.
Is Higher Net Profit Always Better?
Higher net profit is generally preferable if it reflects sustainable earnings and does not require disproportionate risk or capital.
However, the number should be interpreted in context.
A company can increase net profit by taking on excessive debt.
It can cut essential research or maintenance expenses.
It can sell valuable assets.
It can benefit temporarily from unusual tax effects.
It can also generate more net profit simply because it is much larger.
The quality, durability, cash conversion, and capital requirements behind the earnings therefore matter in addition to the headline number.
What Is a Good Net Profit?
There is no universal dollar amount that qualifies as good net profit.
A $100,000 profit could be excellent for a small business and insignificant for a multinational company.
Absolute net profit is therefore most useful when comparing the same business over time or evaluating it relative to its scale, assets, equity, capital employed, and strategic objectives.
For cross-company comparison, percentage and return measures can often provide more context than raw profit dollars alone.
Common Net Profit Mistakes
One frequent mistake is treating revenue as profit.
Another is confusing gross profit with net profit.
Businesses can also mistake cash in the bank for accounting profit, even though borrowing can increase cash without generating profit and profitable credit sales can increase profit before cash is collected.
Another error is confusing markup or gross margin with final profitability.
Users can also compare net profit between companies of vastly different sizes without adjusting for revenue or capital.
Finally, a single reporting period may be distorted by unusual gains, losses, taxes, impairments, or restructuring costs.
Understanding the income statement behind the number is therefore essential.
Limitations of Net Profit
Net profit is one of the most important accounting measures, but it cannot describe every dimension of business performance.
It does not measure liquidity.
It does not equal cash flow.
It does not reveal the amount of capital required to generate the earnings.
It can be influenced by accounting estimates, depreciation, tax effects, financing structure, and unusual items.
It does not show how much profit comes from each dollar of revenue unless converted into a margin.
It also cannot determine whether an investment creates enough value relative to its required return.
For these reasons, net profit is best interpreted alongside profitability margins, cash-flow measures, return ratios, and balance-sheet analysis.
How to Analyze Net Profit
Start by examining the absolute net profit amount and whether it is positive or negative.
Then compare it with prior periods.
Next, determine whether revenue, gross profit, and operating profit are moving in the same direction.
Look at financing and taxes to understand the difference between operating profit and the bottom line.
Compare net profit with operating cash flow to assess cash conversion.
Finally, place earnings in context using margins and return measures.
This progression helps answer not only how much profit the company reported, but also where that profit came from and how economically useful it is.
Why Net Profit Matters
Net profit condenses the entire income statement into one final earnings figure.
Its core logic is straightforward:
Net Profit = Total Revenue − Total Expenses
Yet interpreting that figure requires understanding the layers above it.
Gross profit explains the economics after direct cost of sales.
Operating profit reflects broader operating expenses.
Interest shows the effect of financing.
Taxes and other items affect the final reported result.
Net profit brings those elements together into the bottom line.
Used carefully, it helps business owners, managers, lenders, analysts, and investors evaluate whether the company’s reported activities ultimately generated earnings during the period.
Frequently Asked Questions
What is net profit in simple terms?
Net profit is the amount left after all applicable business expenses are deducted from revenue. If revenue is $500,000 and total expenses are $450,000, net profit is $50,000.
What is the net profit formula?
The broad formula is:
Net Profit = Total Revenue − Total Expenses
A detailed calculation may include cost of goods sold, operating expenses, interest, taxes, and other applicable gains or losses.
Is net profit the same as gross profit?
No. Gross profit subtracts cost of goods sold from revenue. Net profit reflects the broader set of expenses recognized before reaching final earnings.
Is net profit the same as net profit margin?
No. Net profit is an absolute monetary amount. Net profit margin expresses net profit as a percentage of revenue.
Can net profit be negative?
Yes. When expenses exceed revenue, net profit becomes negative and is generally called a net loss.
What does zero net profit mean?
Zero net profit means recognized revenue and expenses are equal for the period, leaving no final accounting profit or loss.
Is net income the same as net profit?
The terms are commonly used to refer to the final earnings figure after applicable revenues and expenses. However, terminology and presentation can vary, so the specific financial statement and definition should be checked.
Does net profit equal cash flow?
No. Net profit is an accounting earnings measure. Cash flow reflects actual cash movements and can differ because of receivables, inventory, payables, depreciation, capital expenditure, and other timing differences.
Does net profit include taxes?
Final net profit normally reflects applicable income-tax expense when the income statement includes taxes before arriving at the bottom line.
Why can revenue rise while net profit falls?
Revenue can grow while costs grow even faster. Higher product costs, payroll, marketing, interest, taxes, expansion expenses, or lower-margin sales can reduce final profit despite higher revenue.
How can a business increase net profit?
Potential methods include increasing economically sustainable sales, improving pricing, reducing unnecessary costs, improving product mix, increasing operating efficiency, lowering financing costs, and managing expenses more effectively. The best approach depends on the cause of weak profitability.
Why is net profit important?
Net profit shows whether the business’s recognized revenues ultimately exceeded its expenses after the broader income-statement cost structure. It provides the final accounting-profit result for the period, although it should be considered alongside margins, cash flow, and return measures.




