


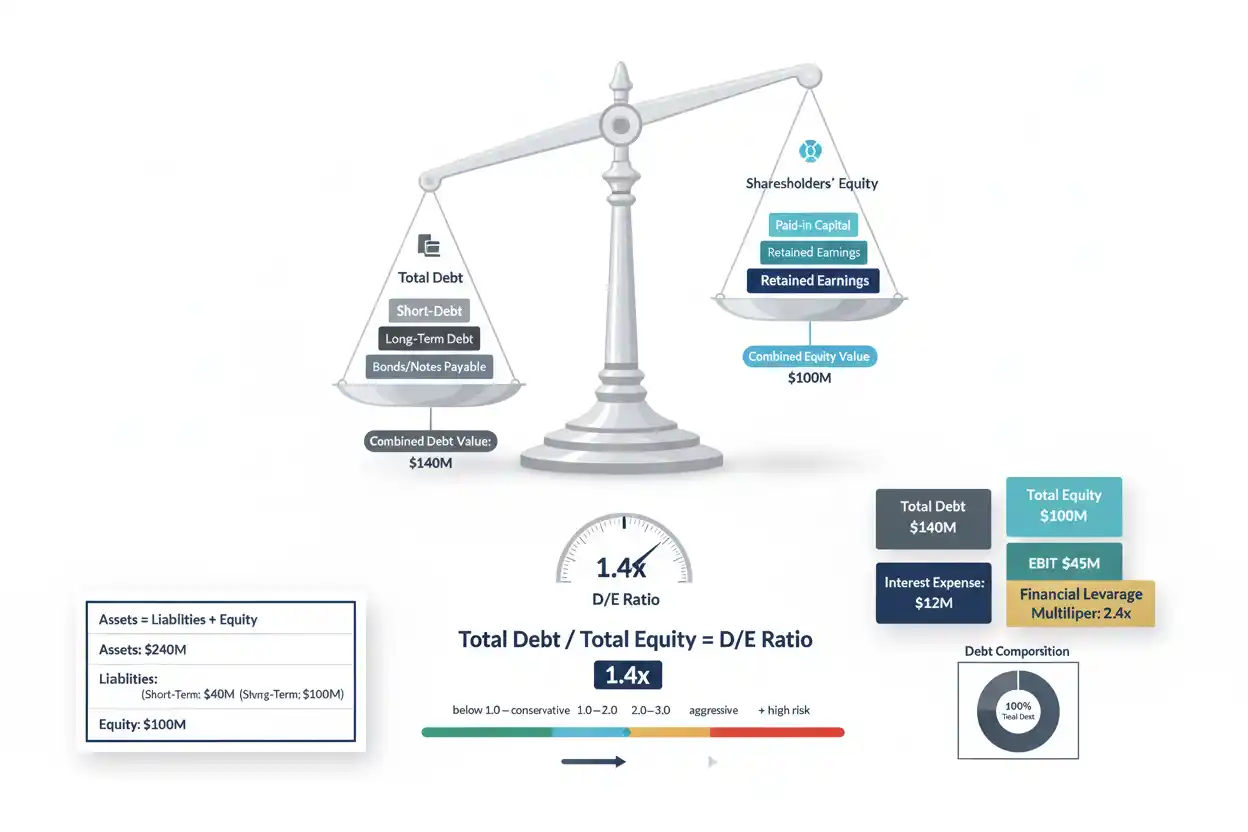
The debt-to-equity ratio, often abbreviated D/E ratio, compares a company’s debt with the amount of shareholder equity supporting the business. It is one of the most widely used measures of financial leverage.
A common formula is:
Debt-to-Equity Ratio = Total Debt ÷ Shareholders’ Equity
If a company has $4 million of debt and $5 million of shareholder equity:
Debt-to-Equity Ratio = $4,000,000 ÷ $5,000,000
Debt-to-Equity Ratio = 0.80
The company therefore carries approximately $0.80 of debt for every $1 of shareholder equity under this definition.
A higher debt-to-equity ratio generally indicates greater reliance on borrowing relative to equity. A lower ratio indicates less debt relative to the owners’ book capital.
Neither result is automatically good or bad.
A company with stable cash flows, productive assets and manageable financing costs may safely operate with more debt than a volatile company with unpredictable earnings. Industry structure, debt maturity, interest rates, profitability, cash flow and asset quality all influence whether leverage is sustainable.
That makes the debt-to-equity ratio an important part of business finance, but not a complete assessment of financial health.
What Is the Debt-to-Equity Ratio?
The debt-to-equity ratio measures the relationship between creditor financing and shareholder financing.
Businesses can obtain capital primarily from two broad sources.
Owners can contribute equity.
Lenders and other creditors can provide debt.
The D/E ratio compares those financing sources.
Suppose a company has:
Debt = $3 million
Shareholders’ equity = $3 million
Debt-to-Equity Ratio = $3,000,000 ÷ $3,000,000
Debt-to-Equity Ratio = 1.0
The company has approximately $1 of debt for each $1 of equity.
If debt rises to $6 million while equity remains $3 million:
Debt-to-Equity Ratio = $6,000,000 ÷ $3,000,000
Debt-to-Equity Ratio = 2.0
The company now carries approximately $2 of debt for each $1 of shareholder equity.
The SEC describes debt-to-equity analysis similarly, explaining that the ratio compares a company’s debt with shareholder equity and is derived from balance-sheet information.
Debt-to-Equity Ratio Formula
The common formula is:
Debt-to-Equity Ratio = Total Debt ÷ Shareholders’ Equity
To express the ratio as a percentage:
Debt-to-Equity Percentage = Total Debt ÷ Shareholders’ Equity × 100
Suppose:
Total debt = $2.4 million
Shareholders’ equity = $4 million
Debt-to-Equity Ratio = $2,400,000 ÷ $4,000,000
Debt-to-Equity Ratio = 0.60
As a percentage:
Debt-to-Equity Percentage = 60%
That means debt equals approximately 60% of shareholder equity.
The ratio is more commonly reported as 0.60× or 0.60:1 rather than as a percentage.
What Counts as Debt?
The word debt needs a clear definition.
A narrower D/E calculation commonly includes interest-bearing borrowings such as bank loans, notes, bonds, short-term borrowings and the current portion of long-term debt.
Some financial references instead use total liabilities in the numerator.
That broader formulation is:
Liabilities-to-Equity Ratio = Total Liabilities ÷ Shareholders’ Equity
The SEC’s introductory financial-statement material uses total liabilities divided by shareholders’ equity when illustrating debt-to-equity.
However, companies and analysts also calculate debt-to-equity using specifically defined debt balances. SEC-filed company disclosures show long-term debt-to-equity calculations based on long-term debt divided by shareholders’ equity.
Therefore, definition consistency matters more than the label alone.
Debt-to-Equity Ratio Example
Suppose a company reports:
Short-term borrowing: $250,000
Current portion of long-term debt: $150,000
Long-term debt: $1,600,000
Shareholders’ equity: $2,500,000
Total debt is:
Total Debt = $250,000 + $150,000 + $1,600,000
Total Debt = $2,000,000
The debt-to-equity ratio is:
Debt-to-Equity Ratio = $2,000,000 ÷ $2,500,000
Debt-to-Equity Ratio = 0.80
The company carries approximately $0.80 of debt for every $1 of shareholder equity.
Whether that amount is financially conservative or aggressive cannot be determined from the ratio alone.
What Does a Debt-to-Equity Ratio of 1 Mean?
A debt-to-equity ratio of 1.0 means the debt amount used in the numerator equals reported shareholder equity.
For example:
Debt = $5 million
Equity = $5 million
Debt-to-Equity Ratio = 1.0
The company’s debt and shareholder equity are equal under the selected definitions.
That does not mean creditors and shareholders necessarily face equal economic risk.
Debt generally has contractual payment terms and can have priority over equity.
Shareholders bear residual risk after liabilities are satisfied.
The ratio compares amounts, not legal rights.
What Does a Debt-to-Equity Ratio of 2 Mean?
A D/E ratio of 2.0 means debt equals twice shareholder equity.
Suppose:
Debt = $10 million
Equity = $5 million
Debt-to-Equity Ratio = $10,000,000 ÷ $5,000,000
Debt-to-Equity Ratio = 2.0
The business has approximately $2 of debt for every $1 of reported equity.
This represents greater financial leverage than a ratio of 0.5 or 1.0, all else equal.
However, the sustainability of 2.0 depends on the business.
A stable infrastructure operator and a volatile technology startup can face very different risks at the same ratio.
What Does a Low Debt-to-Equity Ratio Mean?
A relatively low D/E ratio means shareholders finance a larger portion of the capital structure relative to debt.
For example:
Debt = $1 million
Equity = $5 million
Debt-to-Equity Ratio = 0.20
The company uses approximately $0.20 of debt for every $1 of equity.
Potential advantages can include lower interest obligations, lower refinancing exposure and greater borrowing flexibility.
However, very low leverage does not automatically mean the business is financially optimized.
Appropriate borrowing can finance productive assets and investments without requiring additional shareholder capital.
What Does a High Debt-to-Equity Ratio Mean?
A high debt-to-equity ratio indicates heavier use of borrowing compared with shareholder equity.
Higher leverage can increase potential shareholder returns when borrowed capital earns more than its financing cost.
It can also magnify losses and increase financial pressure when performance deteriorates.
Debt usually requires contractual payments regardless of whether revenue rises or falls.
Shareholders therefore face greater sensitivity to business performance when leverage is substantial.
SEC investor materials warn more broadly that leverage can magnify losses, which is central to interpreting debt-heavy capital structures.
What Is a Good Debt-to-Equity Ratio?
There is no universal good debt-to-equity ratio.
Appropriate leverage varies substantially across industries.
Utilities, telecommunications companies, real estate businesses and other asset-intensive organizations can use significant borrowing.
Asset-light businesses may operate with very different capital structures.
Cyclicality also matters.
A company with stable contracted revenues may support more debt than one whose earnings swing sharply during economic downturns.
Instead of applying an arbitrary universal target, compare the company with its own history, genuinely similar businesses, debt-service capacity and cash-flow stability.
Debt-to-Equity Ratio vs Debt Ratio
The debt ratio compares debt with assets.
Debt Ratio = Debt ÷ Total Assets
The debt-to-equity ratio compares debt with shareholder equity.
Debt-to-Equity Ratio = Debt ÷ Shareholders’ Equity
Suppose:
Debt = $4 million
Equity = $6 million
Assets = $10 million
Debt ratio:
Debt Ratio = $4,000,000 ÷ $10,000,000
Debt Ratio = 40%
Debt-to-equity ratio:
Debt-to-Equity Ratio = $4,000,000 ÷ $6,000,000
Debt-to-Equity Ratio ≈ 0.67
Both describe leverage, but they answer different questions.
The first asks how much debt exists relative to assets.
The second asks how debt compares with shareholder capital.
Debt-to-Equity and the Accounting Equation
The balance-sheet relationship is:
Assets = Liabilities + Shareholders’ Equity
This relationship helps explain why leverage ratios are connected.
Suppose assets are $10 million and total liabilities are $6 million.
Equity is:
Equity = $10,000,000 − $6,000,000
Equity = $4,000,000
Using total liabilities as the D/E numerator:
Liabilities-to-Equity = $6,000,000 ÷ $4,000,000
= 1.50
The SBA describes the same underlying balance-sheet structure: assets equal liabilities plus owners’ equity.
Debt-to-Equity vs Financial Leverage
Financial leverage describes the broader economic effect of using borrowed or fixed-cost financing.
Debt-to-equity is one balance-sheet measure of that leverage.
A company with little debt generally has lower financial leverage than an otherwise identical company financed heavily through loans or bonds.
However, leverage can also be evaluated through debt-to-EBITDA, interest coverage, equity multipliers and earnings sensitivity.
D/E should therefore be treated as one lens rather than the complete leverage picture.
Debt-to-Equity vs Degree of Combined Leverage
Degree of combined leverage measures the sensitivity of shareholder earnings to changes in sales through both operating and financial leverage.
Debt-to-equity does not measure sensitivity directly.
A company may have a relatively high D/E ratio but low operating leverage.
Another business may carry little debt but have extremely high fixed operating costs.
The second company’s earnings can still be highly sensitive to changes in sales.
Combined leverage brings those effects together.
Debt-to-Equity and EBIT
EBIT represents earnings before interest and taxes.
Debt creates interest expense, so EBIT provides one important measure of operating earnings before the financing cost of debt.
Suppose:
EBIT = $2 million
Interest expense = $500,000
The company has substantial room between operating earnings and interest expense.
If EBIT falls to $600,000 while interest remains $500,000, debt becomes much more burdensome.
The D/E ratio could remain unchanged in both periods.
This shows why balance-sheet leverage should be paired with earnings analysis.
Debt-to-Equity and Interest Coverage
Interest coverage evaluates whether operating earnings are sufficient relative to interest expense.
A common formula is:
Interest Coverage = EBIT ÷ Interest Expense
Suppose Company A and Company B each have a debt-to-equity ratio of 1.5.
Company A:
EBIT = $10 million
Interest = $1 million
Interest Coverage = 10×
Company B:
EBIT = $2 million
Interest = $1 million
Interest Coverage = 2×
Their balance-sheet leverage is identical.
Their ability to service financing costs is not.
Debt-to-Equity and EBITDA
EBITDA is often used in credit analysis because lenders and investors can compare borrowing with a measure of operating earnings before interest, taxes, depreciation and amortization.
Debt-to-EBITDA therefore answers a different question from debt-to-equity.
Suppose two companies each have $10 million of debt and $5 million of equity.
Both report:
D/E = 2.0
Company A generates $8 million of EBITDA.
Company B generates $1 million.
The same D/E ratio masks a large difference in operating earnings capacity.
Debt-to-Equity and Operating Cash Flow
Ultimately, debt must be serviced with cash.
Operating cash flow therefore adds critical context.
A company can report substantial shareholder equity because it owns valuable assets while generating weak cash flow.
Another company may have a higher D/E ratio but consistently generate enough cash to meet principal and interest obligations.
Lenders therefore care not only about capitalization but also about repayment capacity.
Debt-to-Equity and Free Cash Flow
Free cash flow can determine how quickly a company can reduce leverage without raising new equity or selling assets.
Suppose a business generates $5 million of annual free cash flow and carries $15 million of debt.
It may be able to deleverage relatively quickly.
Another company with the same debt and equity but negative free cash flow may depend on refinancing.
The D/E ratio is identical.
The financial trajectory differs.
Debt-to-Equity and Return on Equity
Debt can increase return on equity because borrowing allows a company to support a larger asset base with less shareholder capital.
Consider an asset investment generating $150,000 before financing costs.
Scenario A uses $1 million of equity and no debt.
Pre-Financing Return on Equity = $150,000 ÷ $1,000,000 = 15%
Scenario B uses $500,000 of equity and $500,000 of debt.
Before interest:
Return Relative to Equity = $150,000 ÷ $500,000 = 30%
The apparent return doubles because the equity denominator is smaller.
Interest expense reduces that benefit.
Losses are also magnified.
How Debt Magnifies Losses
Suppose the same $1 million asset loses $100,000 in economic value.
With $1 million of equity and no debt:
Loss Relative to Equity = $100,000 ÷ $1,000,000
= 10%
With $500,000 of debt and $500,000 of equity:
Loss Relative to Equity = $100,000 ÷ $500,000
= 20%
Leverage magnifies both favorable and unfavorable outcomes for owners.
Debt-to-Equity and Return on Assets
Return on assets measures profit relative to assets.
The relationship between ROA and borrowing helps determine whether leverage is economically productive.
If assets generate returns comfortably above the cost of debt, leverage can enhance shareholder outcomes.
If asset returns fall below financing costs, debt can erode shareholder value.
A high D/E ratio is therefore most defensible when the financed assets generate durable returns and cash flows.
Debt-to-Equity and Asset Turnover
Asset turnover measures how efficiently assets generate revenue.
A heavily leveraged company that purchases assets but fails to increase productive activity can end up with higher debt and weak utilization.
Suppose an acquisition doubles the asset base and significantly increases debt, but revenue barely changes.
Debt-to-equity can rise while asset turnover falls.
That combination deserves closer analysis because more financing is supporting less-efficient assets.
Debt-to-Equity and Business Valuation
Business valuation often distinguishes the value of the operating business from the value attributable to shareholders.
Debt affects that bridge.
A simplified relationship is:
Equity Value = Enterprise Value − Relevant Debt + Relevant Excess Cash
Suppose enterprise value is $25 million and relevant net debt is $10 million.
Equity Value ≈ $15 million
A company can therefore operate a valuable business while having substantially less equity value because creditors have financial claims ahead of shareholders.
Debt-to-equity provides capital-structure context for that relationship.
Debt-to-Equity and Startup Valuation
Startup valuation often focuses heavily on equity financing because many early-stage companies do not yet produce predictable cash flows.
Some startups still use venture debt, equipment loans or working-capital financing.
Debt can extend the cash available to reach milestones without immediate equity dilution.
However, repayment obligations reduce future flexibility.
A startup with limited revenue should therefore evaluate D/E alongside burn rate and cash runway.
Debt-to-Equity and Working Capital
Working capital focuses on current assets and current liabilities.
Debt-to-equity covers capital structure more broadly.
A business can have a low D/E ratio but poor working capital if customers pay slowly or inventory becomes excessive.
Another company can have high leverage but strong short-term liquidity.
Long-term solvency and short-term liquidity require different measurements.
Debt-to-Equity and Current Ratio
The current ratio compares current assets with current liabilities.
A company can have:
D/E = 2.0
Current ratio = 2.5
That business is highly leveraged relative to equity but currently maintains substantial short-term asset coverage.
Another can have:
D/E = 0.5
Current ratio = 0.7
The second business has lower balance-sheet leverage but potentially tighter short-term liquidity.
The ratios should therefore not be substituted for one another.
Debt-to-Equity and Cash Ratio
The cash ratio narrows liquidity further by focusing on cash and cash equivalents relative to current liabilities.
Debt-to-equity provides no direct information about immediate cash.
A company can have substantial book equity concentrated in property and equipment while holding very little cash.
If large debt payments become due soon, asset-rich does not necessarily mean liquid.
Debt-to-Equity and Cash Flow Forecasting
Cash flow forecasting identifies when principal, interest and other obligations must actually be paid.
Suppose D/E equals 0.8 today.
That ratio does not tell management whether $5 million of debt matures next month or over the next ten years.
The timing difference can completely change financial risk.
Leverage analysis should therefore always consider the debt maturity schedule.
Debt-to-Equity and Cash Runway
Debt can increase available cash when a business borrows.
That can extend runway immediately.
Suppose a startup has $1 million in cash and raises a $2 million loan.
Available liquidity becomes $3 million before transaction costs and operating use.
However, the business now has debt that eventually requires repayment.
D/E rises while short-term runway improves.
Financing therefore changes both liquidity and leverage simultaneously.
Debt-to-Equity and Burn Rate
A company can finance burn rate through equity, debt or a combination.
Using debt avoids immediate ownership dilution but increases fixed financial obligations.
If the company’s cash consumption persists without improving underlying economics, borrowing simply shifts part of the financing burden into the future.
Debt works best when additional time or investment is expected to produce cash flows capable of supporting repayment.
Debt-to-Equity and Interest Rates
The D/E ratio can remain unchanged while debt risk changes substantially because interest rates move.
Suppose a business has $10 million of variable-rate debt.
At 4%:
Annual Interest = $10,000,000 × 4%
Annual Interest = $400,000
At 9%:
Annual Interest = $10,000,000 × 9%
Annual Interest = $900,000
Debt and equity remain unchanged.
Interest expense more than doubles.
The D/E ratio alone cannot capture financing-cost risk.
Debt-to-Equity and Debt Maturity
Maturity structure can be as important as debt amount.
Company A and Company B each have:
Debt = $10 million
Equity = $10 million
Both have:
D/E = 1.0
Company A’s debt matures gradually over ten years.
Company B must refinance most of its debt next quarter.
The leverage ratio is identical.
Company B faces much greater near-term refinancing risk.
Debt-to-Equity and Loan Covenants
Loan agreements can contain leverage covenants.
However, the contractual ratio may differ substantially from the simple D/E formula.
A lender may define leverage as net debt divided by EBITDA, senior debt divided by adjusted EBITDA, or another negotiated measure.
SEC-filed debt agreements frequently define specialized leverage metrics separately from standard accounting ratios.
Therefore, a company’s reported D/E ratio should never be assumed to equal its covenant leverage ratio.
Debt-to-Equity With Negative Equity
A particularly important situation occurs when shareholder equity is negative.
Suppose:
Debt = $5 million
Equity = −$1 million
A mechanical calculation produces:
Debt-to-Equity Ratio = $5,000,000 ÷ −$1,000,000
Debt-to-Equity Ratio = −5.0
That negative ratio does not mean the business has unusually low leverage.
The opposite may be true.
Negative equity means reported liabilities exceed reported assets under the balance-sheet accounting relationship.
The conventional D/E ratio becomes difficult or misleading to interpret when equity is negative.
Analysts should examine the underlying balance sheet rather than ranking negative D/E values against positive ratios.
What Causes Negative Shareholder Equity?
Negative equity can arise for several reasons.
Accumulated losses can reduce retained earnings.
Large asset impairments can reduce the asset base.
Companies can return substantial capital to shareholders through distributions or repurchases.
Acquisitions and accounting adjustments can also affect equity.
The cause matters.
A profitable company can sometimes report unusual book equity because of capital distributions, while another has negative equity because of severe operating losses.
The same negative D/E calculation can therefore represent different economic situations.
Debt-to-Equity When Equity Is Very Small
The D/E ratio can become extremely large when shareholder equity approaches zero.
Suppose debt equals $2 million.
At $1 million of equity:
D/E = 2.0
If equity declines to $100,000:
D/E = $2,000,000 ÷ $100,000
D/E = 20.0
Debt did not change.
The ratio exploded because the denominator collapsed.
This sensitivity is one of the main limitations of debt-to-equity analysis.
How Losses Increase Debt-to-Equity
Suppose a company has:
Debt = $4 million
Equity = $4 million
D/E = 1.0
The business then reports $1 million of losses that reduce shareholder equity to $3 million while debt remains unchanged.
New D/E = $4,000,000 ÷ $3,000,000
New D/E ≈ 1.33
The company did not borrow additional money.
Its leverage increased relative to its shrinking equity base.
How Profits Can Reduce Debt-to-Equity
Retained profits can increase shareholder equity and lower D/E when debt remains unchanged.
Suppose:
Debt = $5 million
Equity = $5 million
D/E = 1.0
The business earns and retains $2 million, increasing equity to $7 million.
New D/E = $5,000,000 ÷ $7,000,000
New D/E ≈ 0.71
The company became less leveraged relative to equity without paying down debt.
Borrowing More Money
Suppose:
Debt = $3 million
Equity = $6 million
D/E = 0.50
The company borrows another $3 million.
Assuming equity remains unchanged:
New Debt = $6 million
New D/E = $6,000,000 ÷ $6,000,000
New D/E = 1.0
The ratio doubles.
Whether that new leverage creates value depends on how the borrowed capital is used.
Repaying Debt
Suppose:
Debt = $6 million
Equity = $4 million
D/E = 1.50
The business repays $2 million of debt using available cash.
Assuming equity is unchanged by the simplified repayment itself:
New Debt = $4 million
New D/E = $4,000,000 ÷ $4,000,000
New D/E = 1.0
The company has deleveraged materially.
Issuing New Equity
Suppose:
Debt = $6 million
Equity = $3 million
D/E = 2.0
The company raises $3 million of new shareholder capital.
Equity rises to $6 million.
New D/E = $6,000,000 ÷ $6,000,000
New D/E = 1.0
The leverage ratio falls substantially.
However, issuing equity can dilute existing shareholders’ ownership percentages.
Reducing leverage therefore carries its own capital-structure trade-offs.
Share Buybacks and D/E
Share repurchases can reduce book equity.
If debt remains unchanged, D/E can increase.
Suppose:
Debt = $4 million
Equity = $8 million
D/E = 0.50
The company uses cash to repurchase shares, reducing equity to $5 million.
New D/E = $4,000,000 ÷ $5,000,000
New D/E = 0.80
The business became more leveraged relative to reported equity without borrowing additional debt.
Dividends and Debt-to-Equity
Large distributions can similarly reduce retained earnings and shareholder equity.
Suppose debt stays constant while equity declines after distributions.
The D/E ratio increases.
This does not necessarily mean financial distress.
A mature company with substantial excess capital may intentionally return funds to shareholders.
However, aggressive distributions can reduce the equity cushion available to absorb future losses.
Asset Write-Downs and D/E
Asset impairments can reduce shareholder equity.
Suppose:
Debt = $8 million
Assets = $15 million
Other liabilities = $2 million
Equity is:
Equity = $15 million − $10 million
Equity = $5 million
Debt-to-equity:
D/E = $8 million ÷ $5 million
D/E = 1.6
A $3 million asset write-down reduces assets and equity by $3 million, assuming no other effects.
New equity = $2 million.
New D/E = $8 million ÷ $2 million
D/E = 4.0
Debt did not increase.
The equity cushion deteriorated substantially.
Debt-to-Equity and Book Value
D/E typically uses accounting shareholder equity.
Book equity does not necessarily equal the market value of the company’s shares.
A successful public company can have a market capitalization far above book equity.
Another company can trade below book value.
The standard balance-sheet D/E ratio therefore should not be confused with a market-value debt-to-equity ratio.
Market Debt-to-Equity Ratio
A market-value version may compare debt with market capitalization:
Market Debt-to-Equity = Debt ÷ Market Value of Equity
Suppose:
Debt = $5 billion
Book equity = $2 billion
Market capitalization = $20 billion
Book D/E:
Book D/E = $5 billion ÷ $2 billion = 2.5
Market D/E:
Market D/E = $5 billion ÷ $20 billion = 0.25
Both can be mathematically correct.
They answer different questions.
The definition must always be identified.
Net Debt-to-Equity
Some analysts subtract cash from debt before comparing it with equity.
Net Debt = Debt − Cash and Cash Equivalents
Then:
Net Debt-to-Equity = Net Debt ÷ Equity
Suppose:
Debt = $8 million
Cash = $3 million
Equity = $10 million
Net Debt = $8 million − $3 million = $5 million
Net Debt-to-Equity = $5 million ÷ $10 million = 0.50
Gross D/E is:
$8 million ÷ $10 million = 0.80
The net calculation treats cash as an offset to borrowing.
It should be labeled distinctly from standard gross debt-to-equity.
Long-Term Debt-to-Equity
Some analyses use only long-term debt.
Long-Term Debt-to-Equity = Long-Term Debt ÷ Shareholders’ Equity
Suppose total debt is $6 million, of which $5 million is long term.
Equity = $4 million.
Total D/E:
$6 million ÷ $4 million = 1.50
Long-term D/E:
$5 million ÷ $4 million = 1.25
SEC-filed companies have disclosed long-term debt-to-equity using this narrower formulation.
Again, the ratio name should identify the numerator.
Industry Differences in Debt-to-Equity
Capital requirements differ substantially across sectors.
A business owning factories, pipelines, aircraft, property or network infrastructure may use considerably more debt than an advisory or software firm.
Stable regulated revenue can also support larger borrowing.
Therefore, comparing D/E across unrelated industries can create false conclusions.
A meaningful benchmark uses businesses with similar asset intensity, cash-flow stability and capital requirements.
Debt-to-Equity for Banks
Traditional debt-to-equity interpretation is especially problematic for banks and certain financial institutions because liabilities and leverage are fundamental to the business model and regulatory capital rules apply.
Deposits, regulatory capital and risk-weighted assets create a financial structure unlike most operating companies.
Banks are therefore commonly evaluated using specialized capital ratios rather than relying on ordinary corporate D/E alone.
SEC-filed banking disclosures illustrate the use of regulatory Tier 1 and leverage ratios that differ from ordinary corporate debt-to-equity.
Debt-to-Equity for Real Estate Businesses
Property companies frequently use borrowing because real estate can serve as collateral and generate recurring rental cash flows.
A relatively high D/E ratio may therefore be normal compared with asset-light businesses.
However, occupancy, interest rates, property values, debt maturity and refinancing conditions can materially affect risk.
A heavily leveraged real estate company can become vulnerable when property values decline or refinancing becomes expensive.
Debt-to-Equity for Manufacturing
Manufacturers can carry debt to finance plants, machinery, inventory and acquisitions.
Appropriate leverage depends on asset utilization, margins, demand stability and capital expenditure.
A cyclical manufacturer may face larger risk from high D/E because earnings can fall sharply during recessions while financing costs remain.
Debt-to-Equity for Startups
A startup with limited revenue often has little capacity to support contractual debt service.
This can make equity financing more common.
When debt is used, the business should compare its borrowing with cash runway, expected milestones and financing capacity.
High leverage combined with rapid burn can significantly reduce strategic flexibility.
How to Lower the Debt-to-Equity Ratio
A company can reduce D/E by lowering debt, increasing shareholder equity, or combining both.
Debt repayment directly reduces the numerator.
Retained earnings can increase equity.
New equity investment enlarges the denominator.
A debt-to-equity conversion can also alter the capital structure in some circumstances.
However, management should not reduce D/E simply to produce a prettier ratio.
The correct objective is a sustainable capital structure that balances financing cost, flexibility and shareholder returns.
How to Increase Debt-to-Equity Responsibly
A company may intentionally increase leverage to finance productive investments, acquisitions or expansion.
Suppose borrowing costs 6% while management reasonably expects the financed investment to generate significantly higher risk-adjusted returns.
Debt can potentially improve shareholder economics.
The strategy becomes dangerous when expected returns are uncertain, debt maturities are short, cash flow is volatile or interest coverage becomes weak.
Higher D/E should therefore be accompanied by stronger analysis of repayment capacity.
Debt-to-Equity Trend Analysis
Consider:
Year 1: 0.50
Year 2: 0.80
Year 3: 1.30
The rising trend means debt has increased relative to equity.
Possible causes include new borrowing, shareholder distributions, operating losses, share repurchases or asset impairments.
Now consider:
Year 1: 2.0
Year 2: 1.4
Year 3: 0.9
The decline can reflect debt repayment, retained earnings or new equity financing.
The ratio identifies the direction.
The financial statements explain the cause.
Common Debt-to-Equity Ratio Mistakes
A major mistake is comparing ratios that use different definitions of debt.
Another is comparing book-equity and market-equity ratios as though they were equivalent.
Negative or near-zero equity can make D/E mathematically extreme or misleading.
Cross-industry benchmarking can also create false conclusions.
A further mistake is assuming that a lower ratio always means a stronger company.
Low leverage does not guarantee good profitability or capital allocation.
Likewise, high leverage does not automatically mean distress when earnings and cash flows are strong.
Limitations of the Debt-to-Equity Ratio
Debt-to-equity is simple enough to be useful but too simple to describe financial risk completely.
It does not show debt maturity.
It does not identify interest rates.
It does not measure cash generation.
It can become unstable when equity is small.
It becomes difficult to interpret when equity is negative.
Book equity may differ significantly from economic or market value.
Accounting choices, impairments and distributions can also change the denominator without changing debt.
For these reasons, D/E should be used with debt ratio, interest coverage, cash-flow measures and debt-maturity analysis.
How to Analyze Debt-to-Equity Properly
First define the numerator.
Determine whether the ratio uses total debt, long-term debt, net debt or total liabilities.
Use the same methodology across every comparison.
Then examine shareholder equity and determine whether it is positive, stable and economically meaningful.
Compare the result with the company’s historical trend and genuinely similar businesses.
Review interest coverage, EBIT, EBITDA and operating cash flow.
Examine maturity schedules and variable-rate exposure.
Then connect leverage with asset returns and shareholder returns.
The final question should not be whether D/E is merely “high” or “low.”
It should be:
Does this amount of debt create acceptable financial risk relative to the equity cushion, cash flows and economic returns of the business?
Frequently Asked Questions
What is the debt-to-equity ratio?
The debt-to-equity ratio is a financial leverage measure comparing debt with shareholder equity.
What is the debt-to-equity ratio formula?
Debt-to-Equity Ratio = Total Debt ÷ Shareholders’ Equity
Definitions can vary, so the debt numerator should always be identified.
What does a debt-to-equity ratio of 1 mean?
It means the amount of debt used in the calculation equals shareholder equity.
What does a debt-to-equity ratio of 2 mean?
It means the company carries approximately $2 of debt for every $1 of shareholder equity.
Is a high debt-to-equity ratio bad?
Not automatically. Higher D/E generally means greater financial leverage, but sustainability depends on earnings, cash flow, interest rates, maturities and industry economics.
Is a low debt-to-equity ratio good?
It generally indicates less borrowing relative to equity, but low leverage does not automatically mean capital is being used efficiently.
What is a good debt-to-equity ratio?
There is no universal ideal. Appropriate leverage varies by industry, business model, earnings stability, financing costs and financial strategy.
What is the difference between debt ratio and debt-to-equity ratio?
Debt Ratio = Debt ÷ Assets
Debt-to-Equity Ratio = Debt ÷ Equity
They use different denominators and describe leverage from different perspectives.
Can debt-to-equity be negative?
Yes, mathematically, when shareholder equity is negative. However, the resulting negative ratio is usually difficult or misleading to interpret as conventional leverage.
Why does D/E become very high when equity is small?
Because shareholder equity is the denominator. As equity approaches zero, even unchanged debt can produce a very large ratio.
Does D/E use total liabilities or debt?
Both conventions exist. Some references use total liabilities, while many analysts use interest-bearing debt. The chosen methodology should be stated clearly and applied consistently.
How can a company reduce its debt-to-equity ratio?
It can repay debt, retain profits that increase equity, raise new equity capital or combine those actions.
Final Perspective
The debt-to-equity ratio compares borrowed capital with shareholder capital:
Debt-to-Equity Ratio = Debt ÷ Shareholders’ Equity
A ratio of 0.5 means the business carries roughly $0.50 of debt for each $1 of equity.
A ratio of 2.0 means debt is approximately twice equity.
But the ratio becomes meaningful only after its definition and context are clear.
Debt can finance productive growth and enhance shareholder returns.
It can also magnify losses, increase fixed financial obligations and reduce flexibility during weak business conditions.
Meanwhile, shareholder equity can move because of profits, losses, distributions, buybacks and asset write-downs, meaning D/E can change even when debt does not.
The strongest analysis therefore asks more than:
“How much debt do we have relative to equity?”
It also asks:
“Can operating earnings and cash flow support that debt, when does it mature, what does it cost, how stable is the equity cushion, and are the borrowed funds generating returns sufficient to justify the additional risk?”
That is the real purpose of the debt-to-equity ratio.




