


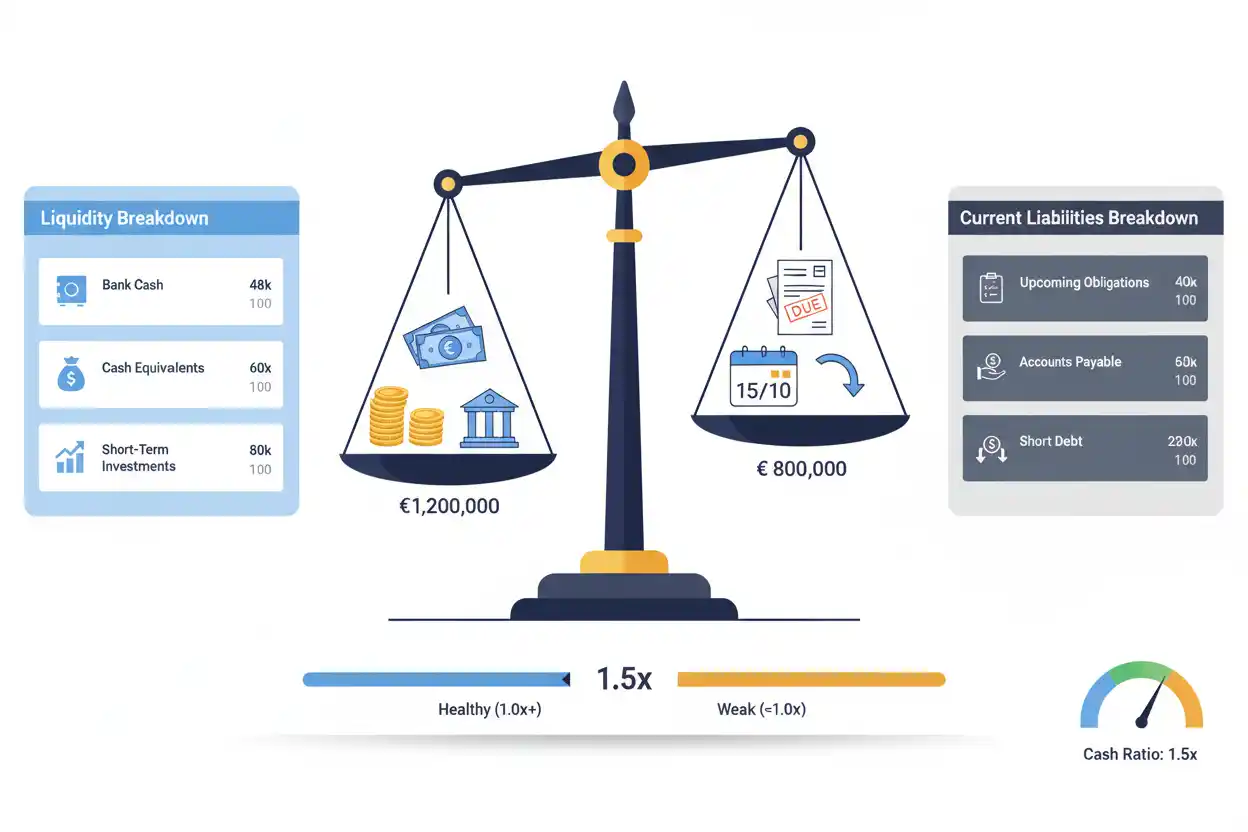
The cash ratio measures a company’s immediately available cash and cash equivalents relative to its current liabilities. It is one of the most conservative liquidity ratios because it excludes inventory, accounts receivable, and other current assets that may take time to convert into cash.
The standard formula is:
Cash Ratio = Cash and Cash Equivalents ÷ Current Liabilities
If a company has $300,000 in cash and cash equivalents and $500,000 of current liabilities:
Cash Ratio = $300,000 ÷ $500,000 = 0.60
A cash ratio of 0.60 means the company has approximately $0.60 of cash and cash equivalents for every $1 of current liabilities represented in the calculation.
That does not automatically mean the company is financially weak. Businesses continually collect cash, sell inventory, pay suppliers, borrow, invest, and generate operating cash flow. The cash ratio deliberately ignores much of that activity to provide a narrow view of immediate balance-sheet liquidity.
For that reason, it works best as one component of business finance analysis rather than as a standalone financial-health score.
What Is the Cash Ratio?
The cash ratio compares highly liquid cash resources with obligations classified as current liabilities.
It asks a deliberately strict question:
How much of the company’s current liabilities could be covered by the cash and cash equivalents included in the numerator?
Unlike the current ratio, the cash ratio does not count all current assets.
Unlike the quick ratio, it generally does not include accounts receivable.
The narrow numerator is what makes the cash ratio conservative.
The SEC’s financial-statement guidance explains that balance sheets present assets and liabilities at a particular point in time, which is important when interpreting any balance-sheet liquidity ratio: the calculation is a snapshot rather than a complete forecast of future cash movements.
Cash Ratio Formula
The basic formula is:
Cash Ratio = Cash and Cash Equivalents ÷ Current Liabilities
Some analytical presentations may include qualifying short-term marketable securities with cash-equivalent or highly liquid resources, so the exact numerator should be identified before comparing companies.
The denominator consists of current liabilities under the financial statements being analyzed.
If cash and cash equivalents are $800,000 and current liabilities are $1,000,000:
Cash Ratio = $800,000 ÷ $1,000,000
Cash Ratio = 0.80
The result can also be expressed as 80%.
That means cash represented in the numerator equals approximately 80% of current liabilities represented in the denominator.
Cash Ratio Example
Suppose a fictional business reports the following balance-sheet information:
Cash: $180,000
Cash equivalents: $70,000
Accounts receivable: $300,000
Inventory: $420,000
Other current assets: $80,000
Current liabilities: $500,000
For the cash ratio, accounts receivable, inventory, and other current assets are excluded.
First calculate qualifying cash resources:
Cash and Cash Equivalents = $180,000 + $70,000
Cash and Cash Equivalents = $250,000
Then calculate the ratio:
Cash Ratio = $250,000 ÷ $500,000
Cash Ratio = 0.50
The company has $0.50 of cash and cash equivalents for every $1 of current liabilities.
That result should not be interpreted as meaning the company can pay only half of its upcoming obligations. Receivables may be collected, products may be sold, and new operating cash can arrive before liabilities become due.
The ratio measures a specific point-in-time relationship.
What Does a Cash Ratio of 1 Mean?
A cash ratio of 1.0 means cash and cash equivalents equal current liabilities under the values included in the calculation.
For example:
Cash and cash equivalents = $600,000
Current liabilities = $600,000
Cash Ratio = $600,000 ÷ $600,000 = 1.00
The company therefore has approximately $1 of immediately available cash resources for every $1 of current liabilities shown.
This does not mean all current liabilities need to be paid immediately.
“Current” generally refers to the classification period used in the financial statements, while individual liabilities can have different due dates.
That timing distinction is one reason cash flow forecasting is necessary alongside static liquidity ratios.
What Does a Cash Ratio Below 1 Mean?
A cash ratio below 1 means cash and cash equivalents are less than current liabilities.
Suppose the ratio is 0.35.
This can be expressed as approximately $0.35 of cash resources for every $1 of current liabilities.
That alone does not prove the company has a liquidity problem.
Many healthy businesses do not hold enough idle cash to cover every current liability simultaneously. They may generate regular customer receipts, turn inventory quickly, maintain available credit, or operate with favorable supplier terms.
The next questions should therefore concern cash generation and operating timing.
For example, operating cash flow can indicate whether ordinary business activity generates cash, while the cash conversion cycle can show how inventory, receivables, and payables affect cash timing.
What Does a Cash Ratio Above 1 Mean?
A ratio above 1 means cash and cash equivalents exceed current liabilities.
If cash resources equal $1.5 million and current liabilities equal $1 million:
Cash Ratio = $1,500,000 ÷ $1,000,000 = 1.50
The company holds approximately $1.50 of cash resources for each $1 of current liabilities.
That can indicate substantial immediate liquidity.
However, a very high ratio is not automatically optimal.
Cash that is not needed for operations, reserves, planned investments, or risk management may produce lower returns than productive business assets or investments.
The economic question is not simply how much cash the business can accumulate. It is whether the company holds sufficient liquidity while allocating capital effectively.
Is a Higher Cash Ratio Better?
Not necessarily.
A higher cash ratio generally indicates more immediate liquidity relative to current liabilities.
That can provide additional financial flexibility during weak sales, unexpected expenses, delayed customer collections, or credit-market disruption.
Yet holding excessive cash can also indicate capital that is not being invested productively.
Imagine two otherwise similar companies.
Company A has a cash ratio of 0.70 and consistently generates strong operating cash flow.
Company B has a cash ratio of 2.50 but earns weak returns because much of its capital remains unused.
The higher ratio does not by itself establish that Company B is economically stronger.
Liquidity should be evaluated alongside profitability, efficiency, cash generation, financing needs, and risk.
Is a Low Cash Ratio Bad?
A low cash ratio becomes more concerning when it appears alongside weak cash generation, overdue obligations, declining sales, limited access to financing, slow receivables, or other liquidity pressures.
The same numerical ratio can mean something different in a business that collects customer cash daily.
For example, a supermarket or other high-volume cash-generating operation may not need the same static cash reserve as a business whose customers take months to pay.
Industry and business model matter.
For that reason, arbitrary universal thresholds should be avoided.
Cash Ratio vs Current Ratio
The current ratio uses a broader numerator.
Current Ratio = Current Assets ÷ Current Liabilities
Current assets can include cash, cash equivalents, accounts receivable, inventory, and other qualifying short-term assets.
The cash ratio uses only the most liquid portion.
Cash Ratio = Cash and Cash Equivalents ÷ Current Liabilities
Consider a company with:
Cash and equivalents: $200,000
Receivables: $400,000
Inventory: $500,000
Other current assets: $100,000
Current liabilities: $600,000
Current assets equal:
Current Assets = $200,000 + $400,000 + $500,000 + $100,000
Current Assets = $1,200,000
Current ratio:
Current Ratio = $1,200,000 ÷ $600,000 = 2.00
Cash ratio:
Cash Ratio = $200,000 ÷ $600,000 ≈ 0.33
The difference shows why liquidity ratios must be named precisely.
The company has twice as many current assets as current liabilities but only $0.33 of cash and equivalents for every $1 of current liabilities.
Cash Ratio vs Quick Ratio
The quick ratio is usually less restrictive than the cash ratio but more restrictive than the current ratio.
A simplified version is:
Quick Ratio = Quick Assets ÷ Current Liabilities
Quick assets commonly include cash, cash equivalents, and qualifying receivables while excluding inventory.
Suppose:
Cash and equivalents = $200,000
Accounts receivable = $300,000
Inventory = $400,000
Current liabilities = $500,000
Cash ratio:
Cash Ratio = $200,000 ÷ $500,000 = 0.40
If all $300,000 of receivables qualify as quick assets:
Quick Ratio = ($200,000 + $300,000) ÷ $500,000
Quick Ratio = 1.00
The quick ratio assumes more of the company’s near-term assets can support obligations, while the cash ratio deliberately restricts its view to immediately liquid resources.
Cash Ratio vs Working Capital
Working capital measures the absolute difference between current assets and current liabilities.
Working Capital = Current Assets − Current Liabilities
Suppose current assets are $1.4 million and current liabilities are $900,000.
Working Capital = $1,400,000 − $900,000
Working Capital = $500,000
If only $250,000 of those current assets consist of cash and cash equivalents:
Cash Ratio = $250,000 ÷ $900,000 ≈ 0.28
The company therefore has positive working capital while its immediate-cash coverage is much lower.
Neither figure makes the other incorrect. They describe liquidity from different perspectives.
Cash Ratio vs Operating Cash Flow
The cash ratio is a stock measure taken from balance-sheet amounts at a particular date.
Operating cash flow is a flow measure covering cash generated or consumed by operations over a period.
That distinction is important.
A business can have little cash on its balance sheet at year-end but generate substantial operating cash every month.
Another company can have a large cash balance but continually consume cash through operations.
The first may have stronger ongoing cash economics even though its cash ratio is lower.
This is why the ratio should be paired with cash-flow analysis.
Cash Ratio vs Free Cash Flow
Free cash flow generally examines cash remaining after specified operating and capital-investment requirements.
The cash ratio does not measure cash generation.
It measures available cash relative to current liabilities at a particular date.
A company can therefore have a high cash ratio because it recently raised financing even while generating negative free cash flow.
Conversely, a company may distribute or reinvest much of its excess cash and maintain a lower cash ratio despite strong free cash flow.
The two metrics answer fundamentally different questions.
Cash Ratio and Cash Flow Forecasting
A cash ratio describes the current position.
Cash flow forecasting estimates what that position may look like later.
Imagine a company with a cash ratio of 1.2 today.
Management already knows that a $500,000 annual insurance payment and a $700,000 equipment purchase are due next month.
The current ratio does not capture those future transactions.
A cash flow forecast does.
Conversely, a company with a low cash ratio today may expect large contractual customer receipts before major liabilities become due.
Liquidity analysis becomes more useful when the snapshot and forecast are examined together.
Cash Ratio and Accounts Receivable
Accounts receivable do not normally belong in the basic cash-ratio numerator.
That is deliberate.
A receivable represents an amount customers owe, but the company does not yet hold the corresponding cash.
A business with $1 million of receivables might eventually collect almost all of them, yet timing still matters.
If customers are paying slowly, near-term liquidity can remain tight.
Days sales outstanding helps analyze collection speed, while the quick and current ratios provide broader views of receivable-supported liquidity.
The cash ratio takes the most conservative route and leaves those receivables out.
Cash Ratio and Inventory
Inventory is also excluded from the cash ratio.
Inventory may be valuable, but converting it into cash usually requires a sale.
That sale can take time, may require discounts, and can create a receivable rather than immediate cash.
An inventory-heavy company can therefore report a strong current ratio but a much lower cash ratio.
Inventory turnover and days inventory outstanding can help determine whether the inventory component is moving efficiently.
Cash Ratio and Current Liabilities
The denominator matters just as much as the numerator.
Current liabilities can include accounts payable, short-term borrowings, accrued expenses, current portions of longer-term debt, and other obligations classified as current under the financial statements.
A company’s ratio can decline even when cash remains unchanged if current liabilities increase.
Suppose cash is $300,000.
At $400,000 of current liabilities:
Cash Ratio = $300,000 ÷ $400,000 = 0.75
If current liabilities rise to $600,000:
Cash Ratio = $300,000 ÷ $600,000 = 0.50
No cash disappeared, but the company now has less immediate cash coverage relative to current obligations.
Cash Ratio and Accounts Payable
Accounts payable often represents a meaningful portion of current liabilities.
Supplier terms affect when those obligations must actually be paid.
A company might have a relatively low cash ratio while suppliers provide favorable 60-day terms and customer cash arrives within a few days.
Another company might report the same ratio while suppliers demand immediate payment and customers pay after 90 days.
The balance-sheet ratios look similar, but operating liquidity is different.
Days payable outstanding and the cash conversion cycle help provide that missing timing dimension.
Cash Ratio and Debt
Current portions of debt can increase current liabilities and therefore reduce the cash ratio.
A business approaching a major loan maturity may need more liquidity than another company with the same ratio but fewer near-term financing obligations.
Capital structure should therefore be examined through measures such as the debt ratio, debt-to-equity ratio, and interest coverage where relevant.
The cash ratio addresses immediate liquid resources. It does not measure the entire debt burden or the company’s ability to generate earnings to service debt.
Cash Ratio and Burn Rate
For cash-consuming businesses, burn rate adds critical context.
Suppose a startup holds $2 million of cash and $1 million of current liabilities.
Cash Ratio = $2,000,000 ÷ $1,000,000 = 2.0
At first glance, immediate liquidity looks substantial.
But if the company is burning $500,000 per month, its cash position may deteriorate rapidly.
A strong static cash ratio therefore does not guarantee a long period of financial flexibility.
Cash runway answers the related question of how long available cash may support ongoing net burn.
Cash Ratio and the Cash Conversion Cycle
The cash conversion cycle measures operating timing across inventory, receivables, and supplier payments.
A company with an efficient or negative cash conversion cycle may operate effectively with less static cash because customer cash arrives quickly relative to supplier obligations.
A business with a long conversion cycle may require greater liquidity to finance the time between spending and collection.
This connection explains why comparing cash ratios across unrelated industries can be misleading.
The operating model determines how much cash the business genuinely needs.
Cash Ratio and Profitability
Profitability and immediate liquidity are not the same.
A company can report a strong net profit margin but maintain a low cash ratio because profits are tied up in receivables, inventory, capital investments, distributions, or other uses of cash.
Another company may have a large cash reserve but weak profitability.
Neither condition should be assessed from one ratio.
Financial health depends on the relationship among earnings, cash generation, assets, obligations, leverage, and operating efficiency.
Why Industry Comparisons Matter
Different industries require different liquidity structures.
A business receiving customer payment immediately may need less balance-sheet cash than one selling on long credit terms.
Capital-intensive companies can also have different financing patterns from asset-light service businesses.
Even companies in the same industry can differ because of supplier terms, seasonality, debt maturities, customer concentration, or access to credit.
The most meaningful comparison is therefore usually a combination of the company’s own historical cash ratio and comparable businesses with similar operating economics.
Cash Ratio Trend Analysis
One period gives a snapshot. Several periods reveal direction.
Suppose a company’s cash ratio changes:
Year 1: 1.10
Year 2: 0.85
Year 3: 0.55
The declining trend deserves investigation.
It may reflect falling cash, rising current liabilities, business investment, acquisitions, debt repayment, distributions, or a deliberate reduction in excess cash.
The trend itself does not identify the cause.
Management should examine both sides of the formula and then connect the change with operating cash flow and the company’s forecast.
Seasonal Effects
A company’s cash ratio can vary significantly during the year.
A retailer may spend heavily on inventory before a major selling season, reducing cash. After customers purchase that inventory, cash balances can rise substantially.
An annual balance sheet taken immediately before or after the peak season may therefore present a ratio that does not represent normal liquidity.
For seasonal businesses, monthly or quarterly trends may provide more context than one year-end figure.
Restricted Cash
Not every reported cash-related balance is necessarily available for ordinary obligations.
Cash can sometimes be restricted for specific legal, contractual, regulatory, financing, or other purposes.
If restricted cash cannot be used to satisfy ordinary current liabilities, including it mechanically in an analytical cash-ratio numerator could overstate usable liquidity.
This is why analysts should understand the composition of reported cash rather than simply copying a total.
SEC-filed financial statements commonly distinguish cash, cash equivalents, and restricted cash where applicable.
Foreign Currency Cash
Multinational businesses may hold cash across different jurisdictions and currencies.
The existence of consolidated cash does not automatically mean every dollar is equally accessible for every obligation without operational, legal, tax, or currency considerations.
For a basic cash-ratio calculation, analysts normally begin with the reported financial statement amounts.
More detailed liquidity analysis may need to examine where cash is held and which obligations it is expected to support.
Can the Cash Ratio Be Negative?
Under the conventional formula, the cash ratio ordinarily should not be negative because cash and cash-equivalent assets are normally nonnegative and current liabilities are generally positive when they exist.
A zero cash balance produces a cash ratio of zero.
If unusual data produce a negative result, the underlying accounting values and calculation should be reviewed rather than interpreted mechanically.
Can the Cash Ratio Be Zero?
Yes.
If a business has current liabilities but no cash or cash equivalents represented in the numerator:
Cash Ratio = $0 ÷ Current Liabilities = 0
The business would have no immediate cash coverage under the ratio.
It may still hold receivables, inventory, available borrowing capacity, or future cash inflows.
Nevertheless, a zero ratio warrants careful liquidity analysis because the business depends entirely on other resources or future cash generation to meet obligations.
How to Improve the Cash Ratio
There are two mathematical ways to increase the ratio: increase cash and cash equivalents or reduce current liabilities.
However, optimizing the number itself is not the objective.
A company might increase cash by borrowing more money. The immediate cash ratio could improve even though total leverage and future financing obligations increase.
Likewise, postponing productive investment may preserve cash while damaging long-term performance.
Sustainable improvement can come from stronger operating cash generation, better collections, efficient working capital, appropriate financing structure, or reducing unnecessary short-term obligations.
The source of the improvement matters.
Why Borrowing Can Increase the Cash Ratio Temporarily
Suppose a company has $200,000 of cash and $500,000 of current liabilities.
Cash Ratio = $200,000 ÷ $500,000 = 0.40
Assume it then receives a $300,000 long-term loan and the proceeds remain in cash.
Ignoring transaction costs and other changes:
New Cash = $500,000
If current liabilities remain $500,000:
New Cash Ratio = $500,000 ÷ $500,000 = 1.00
The ratio improves sharply.
Yet the company’s total debt also increased by $300,000.
This example demonstrates why liquidity and leverage need to be analyzed separately.
Why Paying Current Liabilities Does Not Always Improve the Ratio
Ratio mechanics can produce unintuitive results.
Suppose cash is $500,000 and current liabilities are $1,000,000.
Cash Ratio = $500,000 ÷ $1,000,000 = 0.50
The company uses $200,000 of cash to pay $200,000 of current liabilities.
Cash falls to $300,000 and current liabilities fall to $800,000.
New Cash Ratio = $300,000 ÷ $800,000 = 0.375
The company paid obligations, yet the ratio declined.
When the starting ratio is below 1, using cash to reduce current liabilities can mathematically lower the cash ratio because cash falls proportionally faster than the denominator.
This is one reason financial ratios should be understood mathematically rather than interpreted through intuition alone.
Cash Ratio Example With Three Liquidity Measures
Consider a company with:
Cash and equivalents: $250,000
Receivables: $350,000
Inventory: $450,000
Other current assets: $50,000
Current liabilities: $500,000
Cash ratio:
Cash Ratio = $250,000 ÷ $500,000 = 0.50
Assuming receivables qualify for the quick ratio:
Quick Ratio = ($250,000 + $350,000) ÷ $500,000
Quick Ratio = 1.20
Current assets total:
Current Assets = $250,000 + $350,000 + $450,000 + $50,000
Current Assets = $1,100,000
Current ratio:
Current Ratio = $1,100,000 ÷ $500,000
Current Ratio = 2.20
All three ratios describe the same company.
Cash ratio: 0.50
Quick ratio: 1.20
Current ratio: 2.20
The differences come from which assets each ratio allows into the numerator.
Common Cash Ratio Mistakes
A common mistake is including every current asset in the numerator. That produces something closer to the current ratio.
Another is automatically including all receivables. That shifts the calculation toward the quick ratio.
Analysts may also overlook restricted cash, use mismatched reporting dates, compare businesses with fundamentally different operating models, or treat a universal threshold as proof of financial health.
The largest conceptual mistake is assuming that the cash ratio measures future cash generation.
It does not.
It describes a balance-sheet relationship at a specific date.
Limitations of the Cash Ratio
The cash ratio is deliberately narrow, which is both its strength and its weakness.
It ignores valuable receivables.
It ignores inventory that may sell quickly.
It does not show future customer collections.
It does not incorporate upcoming operating cash generation.
It cannot show whether current liabilities are due tomorrow or months from now.
It also says little about profitability or long-term leverage.
The ratio is therefore best used as a stress-oriented liquidity indicator rather than a complete assessment of whether a company can meet every obligation.
How to Analyze the Cash Ratio Properly
Begin with the ratio itself, then inspect its components.
Determine how much cash is genuinely available.
Review the composition and timing of current liabilities.
Next, compare the cash ratio with the current and quick ratios.
A large gap between these measures can reveal dependence on receivables or inventory.
Then examine operating cash flow, cash forecasts, working-capital efficiency, debt maturities, and historical trends.
The goal is not to decide whether a single ratio is “good.”
The goal is to understand the company’s capacity to meet short-term cash requirements without damaging normal operations.
Frequently Asked Questions
What is the cash ratio?
The cash ratio is a liquidity ratio that compares cash and cash equivalents with current liabilities.
What is the cash ratio formula?
Cash Ratio = Cash and Cash Equivalents ÷ Current Liabilities
What does a cash ratio of 0.5 mean?
A ratio of 0.5 means the company has approximately $0.50 of cash and cash equivalents for every $1 of current liabilities represented in the calculation.
What does a cash ratio of 1 mean?
It means qualifying cash resources equal current liabilities under the reported amounts used.
Is a cash ratio below 1 bad?
Not automatically. Many businesses operate successfully without holding enough cash to cover all current liabilities at once. Cash generation, payment timing, receivables, inventory, financing access, and business model also matter.
Is a cash ratio above 1 good?
It indicates substantial immediate liquidity, but an excessively high balance can also represent capital that is not being deployed productively. Context matters.
What is the difference between cash ratio and current ratio?
The cash ratio generally includes only cash and cash equivalents in the numerator. The current ratio includes all current assets.
What is the difference between cash ratio and quick ratio?
The quick ratio commonly includes cash, cash equivalents, and qualifying receivables. The cash ratio excludes receivables and uses a narrower numerator.
Does inventory count in the cash ratio?
No. Inventory is excluded from the conventional cash ratio because it must generally be sold before becoming cash.
Do accounts receivable count in the cash ratio?
Not in the standard narrow version. Receivables are more commonly included in quick-ratio analysis.
What is a good cash ratio?
There is no universal ideal ratio. Appropriate liquidity depends on industry, business model, cash-flow stability, liability timing, financing access, and management’s risk tolerance.
Can the cash ratio replace a cash flow forecast?
No. The cash ratio is a point-in-time balance-sheet measure. A cash flow forecast estimates future receipts, payments, and cash balances.
Final Perspective
The cash ratio provides one of the strictest views of short-term liquidity:
Cash Ratio = Cash and Cash Equivalents ÷ Current Liabilities
Its strength is simplicity.
It asks how much immediate cash exists relative to current obligations without assuming receivables will be collected or inventory will be sold.
Its limitation is the same simplicity.
Businesses do not operate from a frozen balance sheet. Cash arrives from customers, suppliers are paid according to terms, inventory moves, loans mature, and operating activities continuously change the financial position.
The cash ratio is therefore most useful when it triggers the next questions:
How much cash is genuinely available? When do liabilities become due? How reliably does the business generate cash? How quickly are receivables and inventory converting into cash?
Those questions turn a simple liquidity ratio into meaningful financial analysis.




