


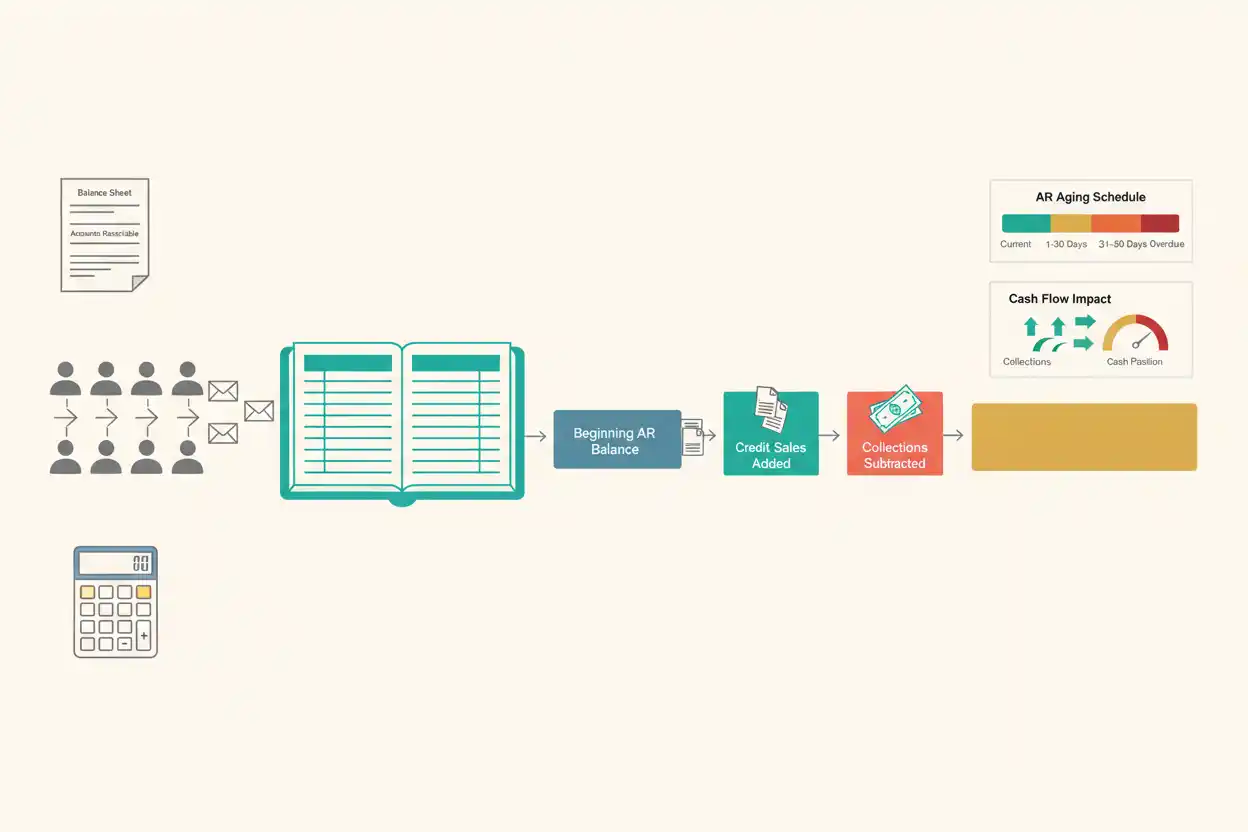
Accounts receivable represents amounts customers owe a business for qualifying goods or services already provided on credit.
Suppose a company begins the month with $50,000 of accounts receivable, records $140,000 of credit sales, and collects $125,000 from customers.
Ending Accounts Receivable = $50,000 + $140,000 − $125,000
= $65,000
The company ends the period with $65,000 still owed by customers.
Accounts receivable is therefore not simply a revenue number. It is an uncollected asset that connects sales activity to future cash flow.
Accounts Receivable Formula
A simplified AR roll-forward is:
Ending Accounts Receivable = Beginning Accounts Receivable + Credit Sales − Collections − Write-Offs − Credits and Other Reductions
When no write-offs or other adjustments occur:
Ending AR = Beginning AR + Credit Sales − Collections
This equation is useful for reconciling customer balances over a reporting period.
Accounts Receivable Example
Suppose:
Beginning AR = $30,000
Credit Sales = $90,000
Cash Collections = $80,000
No other changes occur.
Then:
Ending AR = $30,000 + $90,000 − $80,000
= $40,000
Accounts receivable increases by:
$10,000
The company recognized $10,000 more credit activity than it collected during the period.
Solve for Customer Collections
Rearrange the formula:
Collections = Beginning AR + Credit Sales − Ending AR
Suppose:
Beginning AR = $45,000
Credit Sales = $150,000
Ending AR = $55,000
Then:
Collections = $45,000 + $150,000 − $55,000
= $140,000
Under the simplified assumptions, customers paid $140,000 during the period.
Solve for Credit Sales
Suppose:
Beginning AR = $35,000
Ending AR = $50,000
Collections = $120,000
Then:
Credit Sales = Ending AR − Beginning AR + Collections
= $50,000 − $35,000 + $120,000
= $135,000
This can help reconcile sales records when cash collections and balance-sheet figures are known.
Accounts Receivable vs Accounts Payable
Accounts payable represents unpaid amounts the business owes.
Accounts receivable represents unpaid amounts customers owe the business.
Suppose:
AR = $100,000
AP = $70,000
The difference is:
$30,000
but that $30,000 is not cash.
The receivables may not have been collected, while payables may need to be settled according to vendor due dates.
Accounts Receivable Under Accrual Accounting
Accrual accounting allows qualifying revenue to be recognized when earned even if payment arrives later.
Suppose a company completes:
$15,000 of Services
in March and invoices the customer with payment due in April.
A simplified March accounting effect is:
Revenue = $15,000
Accounts Receivable = $15,000
When the customer pays in April:
Cash Increases $15,000
Accounts Receivable Decreases $15,000
The April collection does not create a second $15,000 of revenue.
Accounts Receivable on the Balance Sheet
Accounts receivable generally appears among assets on the balance sheet because it represents an economic resource expected to produce future cash collection, subject to collectability.
Suppose:
Cash = $80,000
Accounts Receivable = $120,000
Inventory = $100,000
Current assets:
$300,000
Receivables represent 40% of those current assets:
$120,000 ÷ $300,000
= 40%
That concentration makes collection quality particularly important.
Accounts Receivable Is Not Cash
Suppose the business reports:
AR = $200,000
while actual cash is:
$20,000
A large receivable balance may make the balance sheet appear stronger, yet the company can still face immediate cash constraints.
An invoice does not pay payroll, rent, or suppliers until it is collected.
Collecting an Account
Suppose a customer owes:
$10,000
and pays the full amount.
Simplified entry:
Cash +$10,000
Accounts Receivable −$10,000
Total assets remain unchanged at the moment of collection because one asset is converted into another.
The transaction improves liquidity even though total asset value does not change.
Receivable Growth
Suppose accounts receivable rises:
$80,000 → $120,000
Increase:
$40,000
Percentage increase:
$40,000 ÷ $80,000 × 100
= 50%
If sales rose only 10%, receivables are growing much faster than revenue.
That can indicate slower collections, a change in customer mix, looser credit terms, billing delays, or other issues requiring investigation.
Revenue Growth With Stable Collections
Suppose monthly credit sales rise from:
$100,000 → $150,000
Collections rise only:
$95,000 → $110,000
New sales increased:
50%
Collections increased:
≈ 15.79%
Unless prior receivables are being reduced elsewhere, AR is likely to grow substantially.
Rapid sales growth can therefore consume working capital.
Accounts Receivable Aging
An AR aging schedule organizes customer balances by how long they have remained unpaid.
Suppose total receivables are:
$100,000
with:
$60,000 Current
$25,000 Moderately Past Due
$15,000 Significantly Past Due
The total remains $100,000, but the collection risk is different from a portfolio in which the entire amount is current.
The age profile matters alongside the headline balance.
Bad Debt and Write-Offs
Not every receivable is ultimately collected.
Suppose:
Customer Balance = $5,000
and the receivable is later written off under the company’s applicable accounting policy.
The AR roll-forward should reflect:
Accounts Receivable −$5,000
The corresponding expense or allowance accounting depends on the company’s accounting method and the timing of prior credit-loss estimates.
Gross vs Net Receivables
A balance sheet may distinguish gross customer receivables from an allowance for expected credit losses.
Suppose:
Gross AR = $200,000
Allowance = $8,000
Net receivables:
$200,000 − $8,000
= $192,000
This presents a more realistic carrying amount when some accounts are not expected to be collected in full.
Customer Credit Terms
Suppose customers normally receive:
30-Day Payment Terms
Extending terms to 60 days can encourage sales or support strategic customers, but it can also delay cash collection.
If monthly credit sales are $300,000, an additional 30 days of collection time can represent roughly:
$300,000
of additional receivables under a simple steady-state approximation.
Credit policy is therefore a financing decision as well as a sales decision.
Early-Payment Discounts
Suppose a business offers a customer a:
2% Discount
for paying a $50,000 invoice early.
Discount:
$1,000
Cash collected:
$49,000
The company sacrifices $1,000 of revenue or consideration under the applicable accounting treatment in exchange for receiving cash earlier.
Whether that tradeoff makes economic sense depends on financing costs, default risk, cash needs, and customer behavior.
Receivables and Cash Flow
Suppose net income is:
$100,000
but AR increases:
$60,000
All else equal, much of the accounting profit has not yet converted into cash.
The receivable increase can therefore help explain why operating cash flow is materially below reported earnings.
Accounts Receivable and Amortization Expense
Amortization expense reduces accounting earnings through allocation of an intangible asset cost.
Accounts receivable instead tracks customer amounts still unpaid.
A company could report:
Revenue Increase
Higher AR
and:
Amortization Expense
in the same period.
Each account explains a different part of the earnings-to-cash relationship.
Receivables and Break-Even Sales
Break-even sales estimates the sales volume or revenue needed to cover a defined cost structure.
But reaching break-even on an accrual basis does not guarantee liquidity.
Suppose the company reaches exactly $500,000 of break-even sales, but $200,000 remains unpaid by customers.
The company can be economically at break-even while still lacking the cash required to pay current obligations.
Collection Rate
A simple operating measure is:
Collection Rate = Cash Collected ÷ Amount Available for Collection × 100
Suppose:
Beginning AR + Credit Sales = $180,000
Collections:
$150,000
Then:
Collection Rate = $150,000 ÷ $180,000
≈ 83.33%
This ratio can provide operating context but should not replace more detailed aging and collection analysis.
Uncollected Percentage
Using the same simplified figures:
Ending AR = $30,000
Amount available:
$180,000
Uncollected percentage:
$30,000 ÷ $180,000
≈ 16.67%
Again, the quality of that remaining 16.67% depends on invoice age and customer creditworthiness.
Forecasting Accounts Receivable
Suppose a business projects:
Monthly Credit Sales = $400,000
and expects average collection timing of approximately:
45 Days
Using a rough 30-day month:
Estimated AR ≈ $400,000 × 45 ÷ 30
= $600,000
If management shortens collection time to 30 days:
Estimated AR ≈ $400,000
Potential working-capital release:
≈ $200,000
This simplified example shows why collection efficiency can materially affect liquidity.
AR Reconciliation
Suppose the balance-sheet control account shows:
$250,000
while individual customer balances total:
$247,000
Difference:
$3,000
The difference should be investigated rather than ignored.
Possible causes include unapplied cash, posting errors, duplicate invoices, write-offs, customer credits, or timing differences.
Common Accounts Receivable Mistakes
A common error is recording revenue again when a customer pays an existing receivable.
Another is treating receivables as equivalent to cash.
Businesses can also focus only on total AR while ignoring aging, extend credit without considering collection risk, or allow receivables to grow much faster than sales without analyzing the cause.
Frequently Asked Questions
What is accounts receivable?
Accounts receivable represents qualifying amounts customers owe a business for goods or services already provided on credit.
What is the basic accounts receivable formula?
Ending AR = Beginning AR + Credit Sales − Collections − Other Reductions
Is accounts receivable an asset?
Generally, yes.
Does collecting AR create new revenue?
No, not when the revenue was already recognized when the receivable arose.
What increases accounts receivable?
Credit sales exceeding collections and other reductions can increase the balance.
What decreases accounts receivable?
Collections, write-offs, credits, returns, and other reductions can lower the balance.
Is accounts receivable the same as cash?
No.
Why is an aging schedule useful?
It reveals how long customer balances have been outstanding and where collection risk may be concentrated.
Can sales growth create cash-flow pressure?
Yes. If receivables grow with sales faster than collections, more cash becomes tied up in working capital.
Why might net receivables be lower than gross receivables?
An allowance can reflect amounts the company does not expect to collect.
Why reconcile AR to customer balances?
It helps identify unapplied payments, billing errors, duplicate entries, credits, and other discrepancies.
Can a profitable business struggle because of receivables?
Yes. Profit does not provide liquidity until sufficient amounts are converted into cash.




