


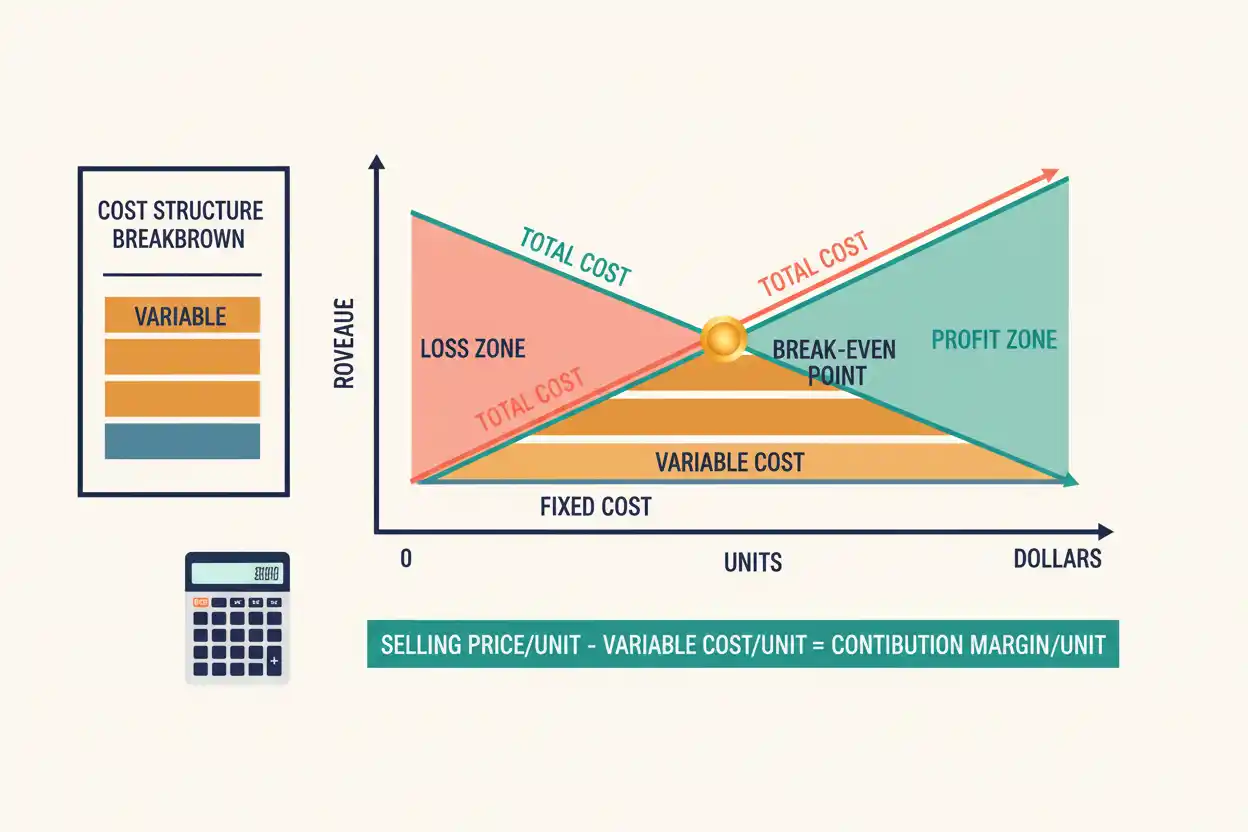
Break-even sales are the revenue needed for total contribution margin to cover fixed costs, producing neither operating profit nor operating loss under the assumptions of the model.
Suppose a company has:
Fixed Costs = $120,000
and a contribution margin ratio of:
40%
Break-even sales are:
Break-Even Sales = $120,000 ÷ 40%
= $300,000
At $300,000 of sales, 40% of revenue contributes $120,000 toward fixed costs, exactly covering them.
Break-Even Sales Formula
Break-Even Sales = Fixed Costs ÷ Contribution Margin Ratio
The contribution margin ratio is:
Contribution Margin Ratio = (Sales − Variable Costs) ÷ Sales
or:
Contribution Margin Ratio = Contribution Margin ÷ Sales
If selling price and variable cost per unit are known:
Contribution Margin per Unit = Selling Price − Variable Cost per Unit
Then:
Contribution Margin Ratio = Contribution Margin per Unit ÷ Selling Price
Break-Even Sales Example
Suppose:
Fixed Costs = $200,000
Selling Price per Unit = $100
Variable Cost per Unit = $60
Contribution per unit:
$100 − $60 = $40
Contribution margin ratio:
$40 ÷ $100
= 40%
Break-even sales:
$200,000 ÷ 0.40
= $500,000
The company needs $500,000 of revenue to cover the modeled cost structure.
Break-Even Units
The same business can calculate break-even volume:
Break-Even Units = Fixed Costs ÷ Contribution Margin per Unit
Using:
$200,000 ÷ $40
= 5,000 Units
At 5,000 units:
Revenue:
5,000 × $100 = $500,000
Variable costs:
5,000 × $60 = $300,000
Contribution margin:
$200,000
Fixed costs:
$200,000
Operating profit:
$0
The unit and sales formulas reconcile.
Sales Above Break-Even
Suppose actual sales are:
$650,000
Contribution at 40%:
$650,000 × 40%
= $260,000
Less fixed costs:
$200,000
Simplified operating profit:
$60,000
Once fixed costs are covered, additional contribution margin produces operating profit under the model.
Sales Below Break-Even
Suppose sales are only:
$400,000
Contribution:
$400,000 × 40%
= $160,000
Fixed costs:
$200,000
Operating result:
−$40,000
The company is $40,000 below accounting break-even under the stated assumptions.
Margin of Safety
Margin of safety measures how far actual or expected sales exceed break-even sales.
Margin of Safety = Actual Sales − Break-Even Sales
Suppose:
Actual Sales = $650,000
Break-Even Sales = $500,000
Then:
Margin of Safety = $150,000
Percentage:
$150,000 ÷ $650,000 × 100
≈ 23.08%
Sales could fall approximately 23.08% from the current $650,000 level before reaching the modeled break-even point.
Required Sales for a Target Profit
Break-even can be extended:
Required Sales = (Fixed Costs + Target Profit) ÷ Contribution Margin Ratio
Suppose:
Fixed Costs = $200,000
Target Operating Profit = $100,000
Contribution Margin Ratio = 40%
Then:
Required Sales = ($200,000 + $100,000) ÷ 0.40
= $750,000
The business needs $750,000 of sales to generate the specified $100,000 operating profit under the simplified assumptions.
Price Increase Effect
Suppose variable cost remains:
$60 per Unit
but selling price increases:
$100 → $110
New contribution per unit:
$110 − $60
= $50
New contribution margin ratio:
$50 ÷ $110
≈ 45.45%
With $200,000 fixed costs:
Break-Even Sales = $200,000 ÷ 45.45%
≈ $440,000
The higher margin reduces required break-even revenue.
However, a higher selling price can also affect demand, so the volume response must be considered.
Variable Cost Increase
Suppose selling price remains $100 while variable cost rises:
$60 → $70
Contribution:
$30
Contribution margin ratio:
30%
Break-even sales:
$200,000 ÷ 30%
≈ $666,666.67
A $10 increase in variable cost raises break-even revenue from $500,000 to approximately $666,667.
Small margin changes can therefore create large changes in required sales.
Fixed Cost Increase
Suppose fixed costs rise:
$200,000 → $240,000
while contribution margin ratio remains 40%.
New break-even sales:
$240,000 ÷ 40%
= $600,000
The additional $40,000 of fixed cost requires:
$100,000
of additional sales at a 40% contribution margin ratio.
Break-Even Sales and Balance Sheet
The balance sheet shows assets, liabilities, and equity at a point in time.
Break-even sales measure revenue required to cover a specified operating cost structure.
A business can reach break-even while still carrying heavy debt or weak liquidity.
Conversely, a business can have a strong balance sheet but operate below break-even during a temporary downturn.
The two analyses answer different questions.
Break-Even Sales and Budget Variance
A budget variance can reveal why actual performance differs from the break-even plan.
Suppose the budget assumed:
Contribution Margin Ratio = 40%
but actual results produce:
36%
If fixed costs remain $200,000:
Budgeted break-even:
$500,000
Actual break-even based on the lower margin:
$200,000 ÷ 36%
≈ $555,555.56
A four-percentage-point margin deterioration raises break-even sales by more than $55,000.
Break-Even Sales and Amortization Expense
Amortization expense can be included in fixed accounting costs when management is calculating accounting-profit break-even.
Suppose:
Cash fixed costs:
$180,000
Amortization:
$20,000
Accounting fixed costs:
$200,000
At 40% contribution margin:
Accounting break-even:
$500,000
If management separately analyzes cash break-even and excludes the noncash amortization for that specific purpose:
$180,000 ÷ 40%
= $450,000
The correct treatment depends on what “break-even” is intended to measure.
Break-Even Sales and Capacity Utilization
Capacity utilization helps determine whether the production volume needed for break-even is physically achievable.
Suppose break-even units are:
5,000
and maximum practical capacity is:
6,000 Units
Break-even utilization:
5,000 ÷ 6,000 × 100
≈ 83.33%
The company must operate at roughly 83% of practical capacity merely to break even.
That leaves limited room for operating disruptions or weaker demand.
Break-Even Sales and Accrual Accounting
Under accrual accounting, sales can be recognized before all customer cash is collected.
Suppose break-even sales are:
$500,000
but $120,000 of those sales remain in accounts receivable.
The company can reach accounting break-even while still lacking the cash expected from some sales.
Break-even analysis and cash-flow planning should therefore be used together.
Multi-Product Break-Even
When a business sells several products with different contribution margins, break-even analysis depends on the assumed sales mix.
Suppose:
Product A contribution margin ratio:
50%
Product B:
30%
If the planned revenue mix produces a weighted average contribution margin of:
40%
then $200,000 of fixed costs imply:
$500,000 Break-Even Sales
If customers shift toward the lower-margin product, the weighted contribution margin falls and required break-even revenue rises.
Break-Even Revenue From Units
Suppose:
Break-Even Units = 8,000
Selling Price = $75
Then:
Break-Even Sales = 8,000 × $75
= $600,000
This provides a useful cross-check against the fixed-cost/contribution-margin-ratio formula.
Units Needed for a Target Profit
Suppose:
Fixed Costs = $200,000
Target Profit = $80,000
Contribution per Unit = $40
Then:
Required Units = ($200,000 + $80,000) ÷ $40
= 7,000 Units
At a $100 selling price:
Required Sales = $700,000
Using the ratio method:
$280,000 ÷ 40% = $700,000
Both approaches reconcile.
Contribution Margin Is Not Gross Margin Automatically
Although gross margin and contribution margin can look similar, they are not always identical.
Break-even analysis requires costs to be classified according to how they behave relative to activity.
A cost included in cost of goods sold for financial reporting might still contain a fixed component.
Therefore, using gross margin percentage as the contribution margin ratio without checking cost behavior can distort break-even sales.
Zero Contribution Margin
Suppose:
Selling Price = $50
Variable Cost = $50
Contribution per unit:
$0
Break-even units become mathematically undefined because no sale contributes anything toward fixed costs.
Increasing sales cannot cover fixed costs when every unit adds zero contribution.
Negative Contribution Margin
Suppose:
Selling Price = $50
Variable Cost = $55
Contribution:
−$5 per Unit
Each additional sale increases the operating loss before fixed costs.
There is no conventional positive break-even volume under that cost-price relationship.
The underlying economics must change.
Common Break-Even Sales Mistakes
A common mistake is dividing fixed costs by gross margin without verifying that the margin represents contribution margin.
Another is treating all expenses as variable or all costs as fixed.
Businesses can also ignore capacity limitations, use unrealistic sales mixes, or assume reaching accounting break-even guarantees positive cash flow.
Frequently Asked Questions
What are break-even sales?
They are the sales revenue required for total contribution margin to cover fixed costs under the assumptions of the model.
What is the formula?
Break-Even Sales = Fixed Costs ÷ Contribution Margin Ratio
How do I calculate contribution margin ratio?
Contribution Margin ÷ Sales
How do I calculate break-even units?
Fixed Costs ÷ Contribution Margin per Unit
What happens at break-even?
Simplified operating profit is zero.
How do I calculate margin of safety?
Actual Sales − Break-Even Sales
How do I include a target profit?
Required Sales = (Fixed Costs + Target Profit) ÷ Contribution Margin Ratio
Does a higher contribution margin lower break-even sales?
Yes, all else equal.
Does a higher fixed-cost base raise break-even sales?
Yes.
Can a company reach break-even but still have cash problems?
Yes.
Why does capacity matter?
The volume needed for break-even must be operationally achievable.
Why can multi-product break-even change?
Different products produce different contribution margins, so changes in sales mix change the weighted margin used in the calculation.




