


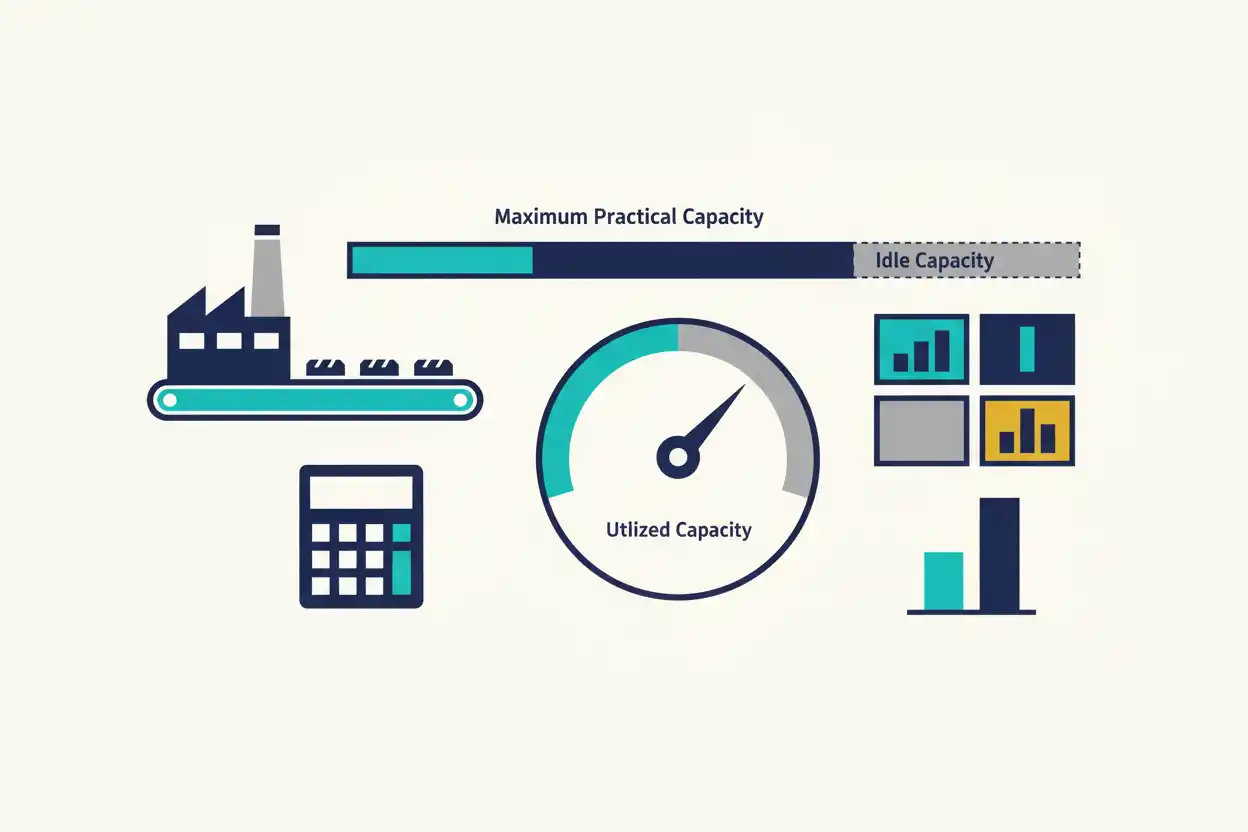
Capacity utilization measures how much of an organization’s available productive capacity is actually being used.
Suppose a manufacturing operation can practically produce 10,000 units per month but currently produces 8,000.
Capacity Utilization = Actual Output ÷ Maximum Practical Output × 100
= 8,000 ÷ 10,000 × 100
= 80%
The operation is using 80% of the defined capacity and has 20% unused under the assumptions of the calculation.
Capacity Utilization Formula
Capacity Utilization = Actual Output ÷ Capacity × 100
The numerator and denominator must use the same unit and time period.
For example:
8,000 Units per Month ÷ 10,000 Units per Month
is valid.
Comparing daily output with annual capacity without conversion would not be meaningful.
Basic Capacity Utilization Example
Suppose:
Practical Capacity = 25,000 Units per Quarter
Actual Output = 20,000 Units
Then:
Capacity Utilization = 20,000 ÷ 25,000
= 80%
Unused capacity:
100% − 80%
= 20%
In unit terms:
Unused Capacity = 25,000 − 20,000
= 5,000 Units
Solve for Actual Output
When capacity and utilization are known:
Actual Output = Capacity × Utilization Rate
Suppose:
Capacity = 12,000 Units
Utilization = 75%
Then:
Actual Output = 12,000 × 75%
= 9,000 Units
Solve for Capacity
If actual output and utilization are known:
Capacity = Actual Output ÷ Utilization Rate
Suppose:
Actual Output = 9,000 Units
Utilization = 75%
Then:
Capacity = 9,000 ÷ 0.75
= 12,000 Units
The Denominator Must Be Defined
Capacity can mean several things.
Theoretical maximum capacity might assume continuous production with no downtime.
Practical capacity can allow for normal maintenance, setup, holidays, or other unavoidable interruptions.
Effective capacity can reflect a specific product mix or operating configuration.
A utilization percentage has little meaning until the denominator is clearly defined.
Theoretical vs Practical Capacity Example
Suppose theoretical capacity is:
12,000 Units
while practical capacity is:
10,000 Units
Actual production:
8,000 Units
Utilization against theoretical capacity:
8,000 ÷ 12,000
= 66.67%
Against practical capacity:
8,000 ÷ 10,000
= 80%
Both calculations are mathematically correct.
They answer different operational questions.
Idle Capacity
Idle Capacity = Capacity − Actual Output
Suppose:
Capacity = 10,000
Actual Output = 8,000
Then:
Idle Capacity = 2,000 Units
Idle capacity percentage:
2,000 ÷ 10,000
= 20%
Unused capacity can represent opportunity, inefficiency, weak demand, deliberate reserve capacity, or a combination of factors.
Capacity Utilization and Budget Variance
A budget variance can arise when actual utilization differs from plan.
Suppose the budget assumes:
85% Utilization
but actual performance is:
70%
Difference:
−15 Percentage Points
If fixed operating costs remain largely unchanged, the cost per actual unit can rise because those fixed costs are spread over fewer units.
Fixed Cost per Unit
Suppose annual fixed production costs are:
$1,000,000
At:
100,000 Units
fixed cost per unit:
$10
At only:
70,000 Units
fixed cost per unit:
$1,000,000 ÷ 70,000
≈ $14.29
Underutilization increases the average fixed cost allocated across each actual unit in this simplified analysis.
Capacity Utilization and Break-Even Sales
Break-even sales can be converted into a required capacity level.
Suppose:
Break-Even Units = 8,000
Practical Capacity = 10,000 Units
Break-even capacity utilization:
8,000 ÷ 10,000 × 100
= 80%
The company needs to use 80% of practical capacity merely to reach break-even under the modeled price and cost assumptions.
Capacity Cushion
A capacity cushion represents unused capacity preserved to handle demand fluctuations, maintenance, or operational uncertainty.
Capacity Cushion = 100% − Utilization Rate
At 80% utilization:
Capacity Cushion = 20%
A 20% cushion can provide flexibility.
Whether that is excessive or appropriate depends on the business model.
Utilization Above 100%
Suppose defined practical capacity is:
10,000 Units
but actual output reaches:
10,500 Units
Utilization:
105%
A result above 100% can occur when the denominator represents an estimated practical or standard capacity rather than an absolute physical maximum.
It can signal overtime, unusually favorable conditions, deferred maintenance, changed process assumptions, or an outdated capacity estimate.
Capacity Utilization and Cash Accounting
Cash accounting records financial performance from cash receipts and payments under that method, but operational capacity exists independently of when cash changes hands.
Suppose a factory operates at 90% capacity while customers have not yet paid all invoices.
Operational utilization can be high while cash receipts remain weak.
Production efficiency and cash timing should therefore be measured separately.
Capacity Utilization and Cash Flow Statement
A cash flow statement can show the cash consequences of operating at different capacity levels.
Higher utilization may require more inventory purchases, labor, utilities, maintenance, and working capital before customer cash is collected.
A company can therefore increase utilization and still experience a short-term cash outflow.
Capacity Utilization and Balance Sheet
The balance sheet contains the assets supporting productive capacity.
Suppose a company owns:
$5 Million of Production Equipment
but operates at only:
50% Capacity
Management should ask whether the underutilized asset base is temporary, strategic, or economically inefficient.
Asset ownership alone does not demonstrate effective utilization.
Machine-Hour Utilization
Capacity can be measured in machine hours.
Suppose:
Available Machine Hours = 5,000
Productive Machine Hours = 4,000
Utilization:
4,000 ÷ 5,000
= 80%
If another 500 hours are consumed by rework, management may want to distinguish total running time from productive output.
Labor-Hour Capacity
Service organizations can measure capacity in labor hours.
Suppose a consulting team has:
4,000 Available Delivery Hours
and uses:
3,200 Hours on Client Work
Utilization:
80%
However, not every non-client hour is necessarily waste.
Training, business development, administration, and management can be required for sustainable operations.
Hotel Capacity Example
Suppose a hotel has:
100 Rooms
for:
30 Days
Available room-nights:
3,000
Occupied room-nights:
2,250
Utilization:
2,250 ÷ 3,000
= 75%
In the hotel context, this is commonly expressed as occupancy rather than generic production utilization.
The underlying capacity logic is similar.
Call Center Capacity Example
Suppose a call center can handle:
40,000 Calls per Month
at its defined practical staffing and system capacity.
Actual handled calls:
34,000
Utilization:
85%
High utilization may appear efficient, but operating too close to maximum capacity can increase customer wait times when demand spikes.
Bottlenecks
A system’s total capacity can be limited by its bottleneck.
Suppose:
Machine A capacity:
1,000 Units per Day
Machine B:
800 Units
Machine C:
1,200 Units
If every unit must pass through all three machines:
System Capacity ≈ 800 Units per Day
Machine B constrains the line.
Averaging the three capacities would overstate real system throughput.
Improving the Bottleneck
Suppose Machine B increases capacity:
800 → 950 Units
System capacity becomes approximately:
950 Units
provided no other stage becomes the new bottleneck.
Operational improvement should therefore target the constraint rather than simply increasing capacity everywhere.
Downtime
Suppose theoretical monthly capacity is:
12,000 Units
but planned maintenance reduces available capacity to:
10,500
Unexpected downtime reduces it further to:
9,500
Actual production:
8,550
Utilization against effective available capacity:
8,550 ÷ 9,500
= 90%
Against theoretical capacity:
71.25%
The denominator determines the operational story.
Product Mix
Different products can consume different amounts of capacity.
Suppose Product A requires one machine hour per unit while Product B requires two.
Counting all finished units equally can distort utilization when product mix changes.
Machine hours, labor minutes, throughput units, or another standardized capacity measure may provide a better denominator.
Demand-Limited Utilization
Suppose capacity is:
20,000 Units
but customer demand is only:
12,000
Actual production:
12,000
Utilization:
60%
The unused 40% does not necessarily indicate a production failure.
The company may simply lack enough demand to justify using the remaining capacity.
High Utilization Is Not Always Better
Running at 100% continuously can create:
long queues, maintenance delays, overtime, quality problems, employee fatigue, and limited ability to respond to demand spikes.
A sustainable utilization target may therefore be below 100%.
The optimal level depends on the cost of idle capacity versus the cost of congestion and inflexibility.
Common Capacity Utilization Mistakes
A frequent mistake is using theoretical capacity in one period and practical capacity in another, making trend comparisons inconsistent.
Another is treating every unused hour as waste, ignoring product mix, or assuming maximum utilization automatically maximizes profit.
Companies can also overlook bottlenecks and calculate utilization from total equipment capacity that the system cannot actually use.
Frequently Asked Questions
What is capacity utilization?
It measures actual output as a percentage of defined productive capacity.
What is the formula?
Capacity Utilization = Actual Output ÷ Capacity × 100
What does 80% utilization mean?
Actual output equals 80% of the capacity used as the denominator.
How do I calculate unused capacity?
Unused Capacity = Capacity − Actual Output
What is a capacity cushion?
100% − Capacity Utilization
Can capacity utilization exceed 100%?
Yes, when actual output exceeds the defined practical or standard capacity.
Is 100% utilization always ideal?
No.
Why does the capacity definition matter?
Theoretical, practical, effective, and bottleneck capacity can produce different utilization percentages.
How does utilization affect break-even?
The business must have enough productive capacity to generate the units or sales required for break-even.
Can low utilization increase unit costs?
Yes, particularly when fixed costs are spread across fewer units.
What limits system capacity?
Often the bottleneck or constrained production stage.
Why isn’t unused capacity always bad?
Reserve capacity can support maintenance, growth, seasonal demand, and service reliability.




