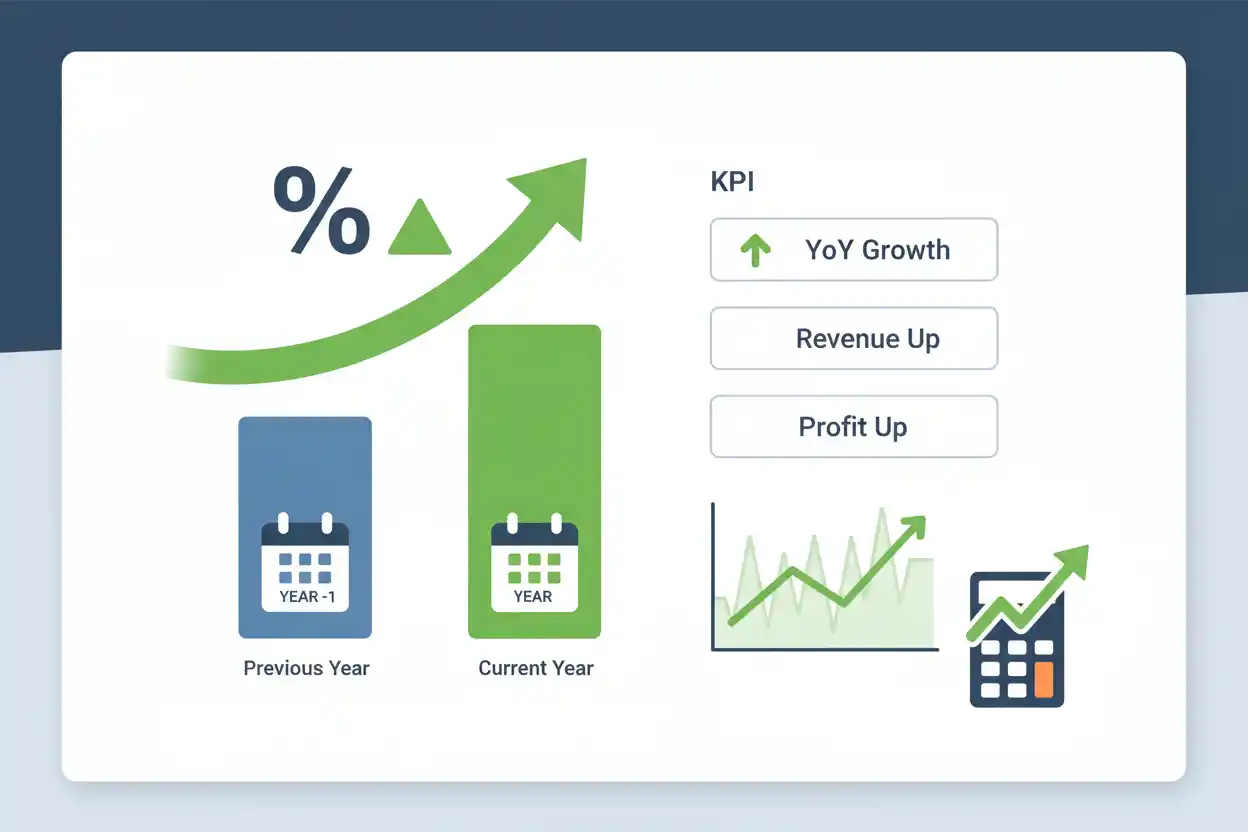
Year-over-year growth, often abbreviated YoY growth, measures how much a metric has increased or decreased compared with the same period one year earlier.
If a company’s revenue rises from $10 million last year to $12 million this year:
Year-Over-Year Growth = (Current Period − Same Period Last Year) ÷ Same Period Last Year × 100
YoY Growth = ($12M − $10M) ÷ $10M × 100
YoY Growth = 20%
Revenue grew 20% year over year.
YoY growth is particularly useful when a business is seasonal because it compares equivalent periods rather than adjacent months or quarters. December can be compared with the previous December, while Q4 can be compared with the previous year’s Q4.
What Is Year-Over-Year Growth?
Year-over-year growth asks:
How much has this metric changed compared with the same point or period one year ago?
Suppose:
March 2025 Revenue = $2 Million
March 2026 Revenue = $2.3 Million
Absolute increase:
$300,000
YoY growth:
$300,000 ÷ $2,000,000 × 100 = 15%
March revenue is 15% higher than the previous March.
The same method can be applied to customers, recurring revenue, expenses, profit, sales volume, prices, transactions, or other consistently measured metrics.
Year-Over-Year Growth Formula
The standard formula is:
YoY Growth % = (Current Period Value − Prior-Year Comparable Value) ÷ Prior-Year Comparable Value × 100
An equivalent form is:
YoY Growth % = (Current Period ÷ Prior-Year Period − 1) × 100
Suppose:
Current Revenue = $5.4M
Prior-Year Revenue = $4.5M
Then:
($5.4M − $4.5M) ÷ $4.5M × 100 = 20%
or:
($5.4M ÷ $4.5M − 1) × 100 = 20%
Both formulas produce the same result.
Year-Over-Year Growth Example
Suppose annual revenue develops as follows:
| Year | Revenue |
|---|---|
| 2024 | $8.0M |
| 2025 | $9.2M |
| 2026 | $11.04M |
2025 YoY growth:
($9.2M − $8.0M) ÷ $8.0M × 100 = 15%
2026 YoY growth:
($11.04M − $9.2M) ÷ $9.2M × 100 = 20%
Revenue grew in both years, and the growth rate accelerated from 15% to 20%.
Positive Year-Over-Year Growth
A positive result means the current value is above the comparable prior-year value.
Suppose:
Prior-Year Customers = 50,000
Current Customers = 55,000
YoY customer growth:
(55,000 − 50,000) ÷ 50,000 × 100 = 10%
The customer base is 10% larger than one year earlier.
Negative Year-Over-Year Growth
If the current value is lower:
YoY Growth < 0%
Suppose revenue falls:
From $20M to $17M
Then:
($17M − $20M) ÷ $20M × 100 = −15%
Revenue declined 15% year over year.
Zero Year-Over-Year Growth
If both periods are equal:
YoY Growth = 0%
Suppose:
2025 Revenue = $10M
2026 Revenue = $10M
The business is flat year over year.
That does not necessarily mean nothing changed operationally. Higher prices, lower volume, customer churn, expansion, product mix, or acquisitions can offset one another and leave the headline total unchanged.
YoY Growth vs. Month-Over-Month Growth
Month-over-month growth compares one month with the immediately preceding month.
YoY compares the same month with the same month one year earlier.
Suppose:
December Revenue = $5M
January Revenue = $3M
Month-over-month growth:
($3M − $5M) ÷ $5M = −40%
But prior January revenue was:
$2.5M
January YoY growth:
($3M − $2.5M) ÷ $2.5M = 20%
Revenue fell 40% sequentially after the holiday period while remaining 20% higher than the previous January.
Both statements are correct.
YoY Growth vs. Quarter-Over-Quarter Growth
Quarter-over-quarter growth compares adjacent quarters.
YoY quarterly growth compares the current quarter with the same quarter one year earlier.
Suppose:
Q4 Revenue = $20M
Q1 Revenue = $15M
QoQ growth:
−25%
If the previous year’s Q1 was $12M:
Q1 YoY Growth = 25%
The sequential decline may be seasonal while the annual comparison shows healthy underlying growth.
Why YoY Growth Is Useful for Seasonal Businesses
A seasonal business can produce misleading sequential comparisons.
Consider a retailer:
Q3 Revenue = $8M
Q4 Revenue = $14M
QoQ growth:
75%
Much of that increase may come from holiday demand.
If prior-year Q4 revenue was $13M:
YoY Growth = ($14M − $13M) ÷ $13M × 100 ≈ 7.69%
The YoY figure gives a more comparable view of underlying performance.
Monthly YoY Growth
Monthly YoY growth compares a month with the same calendar month one year earlier.
Suppose:
May 2025 Revenue = $1.5M
May 2026 Revenue = $1.8M
Growth:
20%
This approach helps reduce distortions caused by comparing May directly with April when seasonal demand differs.
Quarterly YoY Growth
Suppose:
Q2 2025 Revenue = $10M
Q2 2026 Revenue = $11.5M
YoY quarterly growth:
15%
This is different from comparing Q2 2026 with Q1 2026.
The periods serve different analytical purposes.
Annual YoY Growth
When comparing full fiscal years:
Current-Year Revenue vs. Prior-Year Revenue
Suppose:
2025 Revenue = $40M
2026 Revenue = $46M
Annual YoY growth:
15%
For full years, “annual growth” and year-over-year growth can describe the same comparison.
YoY Revenue Growth
Revenue is one of the most common YoY metrics.
Suppose revenue increases:
$50M → $60M
YoY revenue growth:
20%
But the formula does not reveal why.
The change could come from:
higher prices;
greater sales volume;
customer acquisition;
customer expansion;
acquisitions;
currency movement;
or a different sales mix.
A growth percentage is the starting point for analysis rather than the complete explanation.
Price-Driven YoY Growth
Suppose a company sells the same:
1 Million Units
in both years.
Average selling price rises:
From $10 to $11
Revenue:
Prior year:
$10M
Current year:
$11M
YoY revenue growth:
10%
All growth came from pricing.
Sales volume did not increase.
Price Increase Percentage and YoY Growth
A price increase percentage can therefore contribute directly to YoY growth.
Suppose average price rises 8%.
Unit volume rises 5%.
Prior revenue:
100 Units × $100 = $10,000
Current:
105 Units × $108 = $11,340
YoY growth:
($11,340 − $10,000) ÷ $10,000 × 100
= 13.4%
Price and volume interact multiplicatively, so the combined revenue increase is slightly greater than simply adding 8% and 5%.
Price Decrease and YoY Growth
A price decrease percentage can offset customer or unit growth.
Suppose:
Volume Increases 20%
but:
Price Falls 15%
Starting:
1,000 Units × $100 = $100,000
Ending:
1,200 × $85 = $102,000
YoY revenue growth:
2%
Strong volume growth produces only modest revenue growth because the realized price is lower.
YoY Customer Growth
Suppose:
Prior-Year Customers = 100,000
Current Customers = 125,000
YoY customer growth:
25%
That net increase does not reveal the amount of customer churn.
The business might have:
Lost 30,000 Existing Customers
and:
Acquired 55,000 New Customers
Net increase:
25,000
Customer count grows 25% despite substantial customer attrition.
YoY Growth and Logo Retention
Logo retention helps determine how much growth is being built on retained customer relationships.
Suppose two businesses both grow customer count:
20% YoY
Company A:
Logo Retention = 98%
Company B:
Logo Retention = 75%
Company B needs much more gross acquisition to achieve the same net customer growth.
Identical headline growth can therefore reflect very different customer-base durability.
YoY Growth and Revenue Churn
Revenue churn can suppress year-over-year recurring-revenue growth.
Suppose:
New and Expansion ARR = $10M
but:
Churn and Contraction = $7M
Net ARR increase:
$3M
Headline YoY growth can appear modest even though commercial teams generated substantial gross additions.
Reducing revenue leakage can improve growth without requiring an equivalent increase in acquisition.
YoY Growth and Net Revenue Retention
Net revenue retention explains how much growth or contraction occurred within the starting customer base.
Suppose:
Starting ARR = $20M
NRR:
110%
Existing customers therefore produce:
$22M
New customers add:
$4M
Ending ARR:
$26M
YoY ARR growth:
30%
Ten percentage points come from net expansion among existing customers, while the remaining 20 points come from new acquisition in this simplified example.
YoY Growth and Gross Revenue Retention
Gross revenue retention helps reveal how much of the starting recurring base survives before expansion.
Two companies can each report:
25% YoY Growth
Company A:
GRR = 98%
Company B:
GRR = 75%
The second business must replace far more lost recurring revenue before producing its net growth.
Growth built on strong retention is usually structurally different from growth that continually replaces lost revenue.
YoY MRR Growth
Suppose:
June 2025 MRR = $1M
June 2026 MRR = $1.3M
YoY MRR growth:
30%
This compares equivalent month-end recurring revenue balances one year apart.
The specialist monthly recurring revenue growth framework can further decompose the change into new MRR, expansion, contraction, and churn.
YoY ARR Growth
Suppose:
Prior-Year ARR = $12M
Current ARR = $15M
Annual recurring revenue growth:
25%
If the ARR values are measured at comparable dates, this gives a clean YoY view of recurring scale.
The result should not be confused with recognized accounting revenue unless the two happen to align.
YoY Growth and Sales Efficiency
Sales efficiency adds the cost of creating growth.
Suppose two companies both grow revenue:
30% YoY
Company A increases sales and marketing spending:
10%
Company B increases it:
80%
The growth percentages are identical.
The resources required to produce that growth are not.
Growth should be evaluated alongside commercial productivity.
YoY Growth and Rule of 40
The rule of 40 combines a defined growth rate with a profitability metric.
Year-over-year revenue or recurring-revenue growth is often a more stable input than one unusually strong month or quarter, provided the chosen methodology is applied consistently.
Suppose:
YoY Growth = 28%
Selected Profit Margin = 15%
Rule of 40 score:
43
Growth contributes 28 points of that total.
YoY Growth and Value-Based Pricing
Value-based pricing can influence YoY revenue growth if stronger value capture increases average realized pricing.
Suppose customer count remains flat.
Average annual revenue per customer rises:
From $10,000 to $11,500
Revenue can grow:
15%
without customer-count growth.
Management should distinguish price-driven growth from acquisition-driven growth because their sustainability and economics can differ.
YoY Growth and Margin
Growth should be evaluated alongside margin.
Suppose:
Prior Year
Revenue = $100M
Margin = 40%
Margin dollars:
$40M
Current Year
Revenue = $120M
Margin = 30%
Margin dollars:
$36M
YoY revenue growth:
20%
Margin dollars:
−10%
The company is larger but economically less productive under the selected margin definition.
YoY Expense Growth
The same formula can be applied to expenses.
Suppose:
Prior-Year Operating Expenses = $20M
Current = $25M
YoY expense growth:
25%
If revenue grows only 10%, expenses are growing much faster than the top line.
That can pressure operating income even while revenue remains positive.
Revenue Growth vs. Expense Growth Example
Suppose:
Prior Year
Revenue = $50M
Operating Expenses = $40M
Operating result:
$10M
Current Year
Revenue = $55M
Operating Expenses = $46M
Revenue growth:
10%
Expense growth:
15%
Operating result:
$9M
Revenue grows while operating profit declines.
The direction of multiple metrics matters more than one growth percentage.
YoY Growth Acceleration
Suppose annual growth rates are:
10% → 15% → 22%
The company is experiencing growth acceleration.
If revenue was:
$100M
then:
Year 2:
$110M
Year 3:
$126.5M
Year 4 at 22% growth:
$154.33M
Accelerating percentage growth on a growing base requires increasingly large absolute additions.
YoY Growth Deceleration
Suppose:
30% → 20% → 12% → 8%
Revenue can still be increasing every year.
The rate is simply slowing.
A mature company can add more absolute revenue dollars while reporting a lower percentage growth rate because the starting base is larger.
Same Dollar Growth, Lower Percentage
Suppose revenue increases $10 million each year.
From:
$20M → $30M
growth:
50%
From:
$100M → $110M
growth:
10%
From:
$200M → $210M
growth:
5%
The company adds the same $10 million each time.
Percentage growth declines because the denominator becomes larger.
Base Effects
YoY comparisons can also be distorted by an unusually weak or strong prior-year period.
Suppose:
2024 Revenue = $10M
2025 Revenue = $5M
2026 Revenue = $8M
2026 YoY growth:
($8M − $5M) ÷ $5M = 60%
That sounds exceptional.
But 2026 revenue remains:
20% below 2024
A strong YoY rebound can simply reflect an unusually weak comparison base.
Two-Year Context
When base effects are large, looking back two years can improve interpretation.
Using the previous example:
2026 vs. 2025:
+60%
2026 vs. 2024:
−20%
The first comparison shows recovery.
The second shows that the business has not yet returned to its earlier level.
Both are important.
Multi-Year Compounded Growth
For growth across more than one year, simply adding YoY rates is incorrect.
Suppose revenue grows:
10% in Year 1
and:
20% in Year 2
Starting at:
$100
After Year 1:
$110
After Year 2:
$132
Total two-year growth:
32%
not 30%.
Percentage growth compounds.
Compound Annual Growth Rate vs. YoY Growth
YoY growth compares one period with the equivalent prior-year period.
A multi-year compound annual growth calculation answers a different question:
What constant annual rate would connect the starting and ending values over several years?
YoY can vary substantially from year to year.
A compounded multi-year rate smooths those variations into one equivalent annual rate.
The two measures should not be treated as interchangeable.
What If the Prior-Year Value Is Zero?
If:
Prior-Year Value = 0
the conventional YoY formula requires division by zero and is undefined.
Suppose:
2025 Revenue = $0
2026 Revenue = $1M
The business added $1 million.
It is not mathematically valid to report an ordinary percentage growth rate from a zero base.
Use the absolute increase or label the percentage as not meaningful.
Negative Prior-Year Values
Conventional percentage growth can become misleading when the prior-year denominator is negative.
Suppose operating income improves:
From −$2M to −$500K
The economic result is clearly better.
The standard percentage-growth formula produces an unintuitive result because the denominator is negative.
Absolute change is usually clearer:
Operating loss improved by $1.5M
Moving From Loss to Profit
Suppose:
Prior-Year Net Income = −$1M
Current Net Income = +$2M
Absolute improvement:
$3M
A conventional YoY percentage is not particularly meaningful across the zero boundary.
A clearer statement is:
The company moved from a $1 million loss to a $2 million profit.
Leap Years and Calendar Effects
Even equivalent calendar periods can contain minor differences in days.
A leap-year February has 29 days rather than 28.
Businesses with high daily transaction volume can therefore supplement YoY totals with:
Revenue per Day
or:
Transactions per Day
when the extra calendar day materially affects the comparison.
Fiscal-Year Comparisons
YoY growth does not require a January-to-December fiscal year.
Suppose a company has a fiscal year ending in June.
It can compare:
Fiscal Q2 2026 vs. Fiscal Q2 2025
or:
FY2026 vs. FY2025
The periods need to be economically comparable and defined consistently.
Acquisition Effects
A business acquisition can create large YoY growth without equivalent organic growth.
Suppose reported revenue rises:
30%
but an acquired company contributes:
20 Percentage Points
Organic growth may be closer to:
10%
Both numbers can be useful.
Management should distinguish reported and organic growth when acquisition activity materially changes the base.
Currency Effects
International businesses can also experience YoY growth caused by exchange-rate movements.
Suppose local-currency sales are flat, but currency translation increases reported revenue.
Reported YoY growth can be positive despite unchanged underlying local demand.
Constant-currency analysis can provide additional context when foreign-exchange effects are material.
YoY Growth Trend Example
Suppose:
| Year | Revenue | YoY Growth |
|---|---|---|
| 2023 | $20M | — |
| 2024 | $22M | 10% |
| 2025 | $25.3M | 15% |
| 2026 | $30.36M | 20% |
Revenue grows every year.
The rate also accelerates.
Absolute annual increases are:
+$2M
+$3.3M
+$5.06M
Both percentage and absolute growth strengthen.
What Is a Good Year-Over-Year Growth Rate?
There is no universal target.
An appropriate rate depends on:
- company size;
- industry;
- business maturity;
- market growth;
- customer retention;
- profitability;
- acquisition efficiency;
- capital availability;
- pricing;
- and the metric being measured.
A small early-stage company and a mature global business should not be expected to grow at identical percentages.
Growth quality matters as much as speed.
How to Improve Year-Over-Year Growth
Revenue YoY growth can improve through:
more customers;
higher retention;
higher prices;
greater customer expansion;
increased transaction volume;
new products;
better conversion;
new markets;
or a more favorable product mix.
Because YoY growth is a result rather than a driver, the company should identify which component of the revenue equation has the best sustainable economics.
Common Year-Over-Year Growth Mistakes
A common mistake is comparing non-equivalent periods.
Another is dividing by the current period rather than the prior-year period.
Businesses can also ignore base effects and describe a rebound as structural growth.
Another mistake is interpreting reported growth without separating acquisitions, currency, price, and volume.
Companies may compare YoY growth with MoM or QoQ figures without recognizing the different periods.
Zero or negative prior-year denominators also make conventional percentage growth problematic.
Finally, strong YoY growth should not be treated as proof of profitability, retention quality, or sales efficiency.
Frequently Asked Questions
What is year-over-year growth in simple terms?
Year-over-year growth measures how much a metric changed compared with the same period one year earlier.
What is the YoY growth formula?
YoY Growth % = (Current Period − Prior-Year Comparable Period) ÷ Prior-Year Comparable Period × 100
How do you calculate 20% YoY growth?
If the prior-year value is $100:
$100 × 1.20 = $120
The current value must be $120 for 20% growth.
What is an example of YoY growth?
If revenue increases from $5 million to $6 million:
($6M − $5M) ÷ $5M × 100 = 20%
Can YoY growth be negative?
Yes. A negative result means the current value is below the comparable prior-year value.
What is the difference between YoY and MoM?
YoY compares the same period one year apart. MoM compares consecutive months.
What is the difference between YoY and QoQ?
YoY usually compares the same quarter one year apart. QoQ compares one quarter with the immediately preceding quarter.
Why is YoY useful for seasonal businesses?
It compares similar seasonal periods, reducing distortions that occur when adjacent months or quarters naturally have different demand.
Can customer count grow while revenue churn is high?
Yes. Strong new acquisition can increase total customers or revenue while significant recurring revenue is simultaneously being lost.
Can revenue grow YoY while margin declines?
Yes. If costs rise faster than revenue or product mix becomes less profitable, top-line growth can coexist with margin compression.
How does pricing affect YoY growth?
Higher prices can increase revenue growth even without greater volume. Lower prices can reduce growth unless increased sales volume compensates.
How does NRR affect YoY recurring growth?
Strong NRR means the existing customer base contributes positively to recurring growth before new customers are added.
How does sales efficiency relate to YoY growth?
YoY growth shows how quickly revenue increased, while sales efficiency shows how much commercial spending was required to produce incremental revenue.
Can Rule of 40 use YoY growth?
A defined YoY revenue or recurring-revenue growth rate can be used when it matches the chosen Rule of 40 methodology and is applied consistently.
What happens if the prior-year value is zero?
The standard percentage-growth formula is undefined because it requires division by zero. Report the absolute increase instead.
Why can a high YoY growth rate be misleading after a weak year?
A very low prior-year base can make even a partial recovery produce a large percentage increase.
Is YoY growth the same as CAGR?
No. YoY compares one year with the previous year. CAGR summarizes growth across several years as one compounded annual rate.
Why is year-over-year growth important?
YoY growth provides a comparable view of business progress while reducing many seasonal distortions. Used with retention, margins, pricing, and sales-efficiency metrics, it helps distinguish durable growth from temporary rebounds or growth created at unattractive economics.