


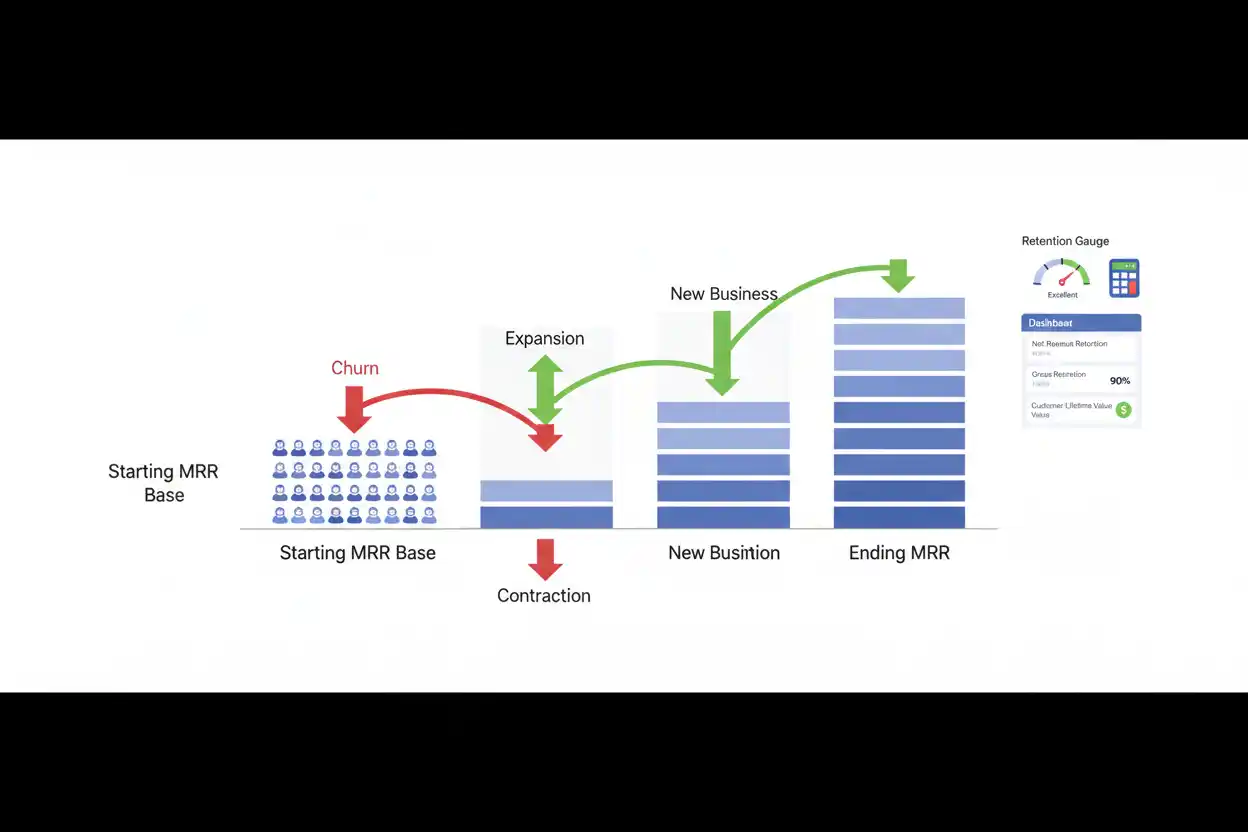
Net revenue retention (NRR) measures how recurring revenue from an existing customer cohort changes after accounting for churn, contraction, and expansion.
If a business begins with $1,000,000 of recurring revenue, loses $50,000 to churn, loses another $30,000 to downgrades, and gains $180,000 from existing-customer expansion:
Net Revenue Retention = (Starting Recurring Revenue − Churned Revenue − Contraction Revenue + Expansion Revenue) ÷ Starting Recurring Revenue × 100
NRR = ($1,000,000 − $50,000 − $30,000 + $180,000) ÷ $1,000,000 × 100
NRR = 110%
The existing customer cohort ends the period generating 10% more recurring revenue than it generated at the beginning.
New-customer revenue is excluded. NRR is designed to show what happened inside the starting customer base.
What Is Net Revenue Retention?
Net revenue retention asks:
If we acquired no new customers, how would recurring revenue from the customers we already had change?
Suppose a SaaS company begins a year with:
$10 Million ARR From Existing Customers
During the year:
$800,000 Churns
$400,000 Contracts Through Downgrades
$2 Million Expands
Ending recurring revenue from the starting cohort:
$10M − $0.8M − $0.4M + $2M = $10.8M
NRR:
$10.8M ÷ $10M × 100 = 108%
The existing customer base grew its recurring value by 8%.
This makes net revenue retention especially useful for businesses where customers can increase spending after acquisition.
Net Revenue Retention Formula
The standard formula is:
NRR = (Starting Recurring Revenue − Churned Revenue − Contraction Revenue + Expansion Revenue) ÷ Starting Recurring Revenue × 100
Where:
Starting recurring revenue is recurring revenue generated by the customer cohort at the beginning of the period.
Churned revenue is recurring revenue lost when customers in that cohort fully cancel.
Contraction revenue is recurring revenue lost when retained customers downgrade, reduce seats, reduce usage, or otherwise spend less.
Expansion revenue is additional recurring revenue generated by retained customers through upgrades, additional seats, usage growth, cross-sells, or other increases.
New customers acquired after the starting date are excluded.
Net Revenue Retention Example
Suppose a subscription company starts January with:
Starting MRR = $500,000
During January:
Churned MRR = $20,000
Contraction MRR = $10,000
Expansion MRR = $60,000
Ending MRR from the starting customer cohort:
$500,000 − $20,000 − $10,000 + $60,000
= $530,000
NRR:
$530,000 ÷ $500,000 × 100
= 106%
The starting customers increased their combined monthly recurring revenue by 6%.
If new customers also contributed $50,000 MRR, that amount would increase total monthly recurring revenue but would not increase NRR.
Why New Customer Revenue Is Excluded
Suppose:
Starting MRR = $1M
Existing customers shrink to:
$800K
The company then acquires:
$500K of New MRR
Total ending MRR becomes:
$1.3M
Overall MRR grew 30%.
But NRR is only:
$800K ÷ $1M = 80%
The business lost 20% of the recurring revenue value inside its original customer base.
Strong acquisition hides that deterioration if management looks only at total recurring-revenue growth.
NRR deliberately removes new customers so retention and expansion can be evaluated independently of acquisition.
NRR Above 100%
NRR can exceed 100% because expansion is included.
Suppose:
Starting Revenue = $2M
Churn = $100K
Contraction = $100K
Expansion = $400K
Ending cohort revenue:
$2.2M
NRR:
110%
Existing customers now generate 10% more recurring revenue than they did initially.
This is sometimes described as negative net revenue churn because expansion more than offsets customer losses and downgrades.
NRR Equal to 100%
An NRR of exactly 100% means recurring revenue from the starting customer cohort ends at the same level it began.
Suppose:
Starting MRR = $500K
Churn + Contraction = $50K
Expansion = $50K
Ending cohort MRR:
$500K
NRR:
100%
Revenue losses were completely offset by expansion.
That does not mean the customer base had no churn or contraction.
It means expansion replaced the lost recurring revenue dollar for dollar.
NRR Below 100%
Suppose:
Starting Revenue = $1M
Churn = $60K
Contraction = $40K
Expansion = $30K
Ending cohort revenue:
$930K
NRR:
93%
The starting customer base lost 7% of its recurring value after expansion.
New customers can still make total company revenue grow, but the existing base is shrinking.
NRR vs. Gross Revenue Retention
Gross revenue retention excludes expansion.
NRR includes it.
Using:
Starting Revenue = $1M
Churn = $50K
Contraction = $50K
Expansion = $200K
GRR:
($1M − $50K − $50K) ÷ $1M = 90%
NRR:
($1M − $50K − $50K + $200K) ÷ $1M = 110%
Both numbers are useful.
GRR says the business retained 90% of the original recurring dollars before expansion.
NRR says expansion took the remaining cohort to 110% of starting revenue.
A high NRR should not make management ignore weak GRR.
NRR vs. Customer Churn
Customer churn measures lost customers by count.
NRR measures recurring revenue change across the starting customer cohort.
Suppose 5% of customer accounts churn.
If they are mostly small customers, revenue retention can remain strong.
If a single lost customer represents a large share of recurring revenue, NRR can decline materially even when customer-count churn is low.
Customer churn therefore answers how many customers were lost.
NRR answers what happened to recurring revenue after losses and expansion.
NRR vs. Logo Retention
Logo retention focuses on the number of accounts retained.
Suppose a company retains:
95% of Customer Logos
The remaining customers expand substantially.
Starting revenue:
$10M
Revenue after churn and contraction:
$9.5M
Expansion:
$1.5M
Ending cohort revenue:
$11M
NRR:
110%
The company lost some customer logos but expanded the retained customer relationships enough to grow cohort revenue.
NRR vs. Revenue Churn
Revenue churn focuses on recurring revenue lost.
NRR goes further by adding expansion.
Suppose:
Revenue Lost = 8% of Starting Revenue
Expansion = 13% of Starting Revenue
Then, ignoring additional distinctions:
NRR = 100% − 8% + 13%
= 105%
The business lost revenue but expanded remaining customers by an even greater amount.
Expansion Revenue Drives NRR Above 100%
Expansion revenue is the component that allows NRR to exceed 100%.
Suppose a customer begins at:
$5,000 MRR
and expands to:
$7,500 MRR
Expansion:
$2,500
That increase can compensate for recurring revenue lost elsewhere in the cohort.
Businesses with seat-based, usage-based, multi-product, or tiered pricing often have more natural opportunities for customer expansion than businesses with fixed one-time customer value.
Contraction Reduces NRR Without Customer Churn
Suppose a customer pays:
$10,000 per Month
and downgrades to:
$7,000
The customer remains active.
Logo retention is unchanged.
Customer churn is unaffected.
But recurring revenue contracts by:
$3,000
That $3,000 reduces both GRR and NRR.
This is why NRR captures customer-base economics that simple customer-count retention cannot.
Example With Churn, Contraction, and Expansion
Suppose:
Starting MRR = $2,000,000
Customer A cancels:
−$100,000
Several customers downgrade:
−$80,000
Other customers expand:
+$300,000
Ending cohort MRR:
$2,000,000 − $100,000 − $80,000 + $300,000
= $2,120,000
NRR:
$2,120,000 ÷ $2,000,000 × 100
= 106%
Despite $180,000 of revenue erosion, expansion produces a net increase of $120,000.
NRR and Monthly Recurring Revenue Growth
Monthly recurring revenue growth measures growth in the total MRR base.
NRR measures growth or contraction only inside the starting customer cohort.
Suppose:
Starting MRR = $1M
NRR is:
105%
Existing-customer ending MRR:
$1.05M
New customers add:
$200K
Total ending MRR:
$1.25M
Overall MRR growth:
25%
Only five percentage points of the growth came from net expansion inside the starting customer base. The remaining growth came from new acquisition.
NRR Can Be Strong While Total MRR Falls
This unusual result can occur if new-customer acquisition is weak and the company loses customers outside the comparable cohort structure or experiences other timing effects.
For a simplified example, suppose an established cohort has:
NRR = 110%
but overall the company is winding down a separate customer segment or failing to replace contracts outside the measured cohort.
The existing cohort metric can remain strong while total MRR growth is weak.
This is why cohort definition and company-wide recurring-revenue reconciliation matter.
NRR and Month-Over-Month Growth
Month-over-month growth can be applied to total revenue, customers, expenses, or another metric.
NRR is specifically a retention-and-expansion measure for the starting recurring customer base.
Suppose total revenue grows 15% MoM.
That increase might come from:
- one-time revenue;
- new customers;
- pricing;
- expansion; or
- other sources.
NRR isolates only recurring revenue movements among existing customers.
NRR and Price Increases
A price increase percentage applied to existing recurring customers can increase their recurring revenue if they remain.
Suppose:
1,000 Existing Customers Pay $100
Starting MRR:
$100,000
Price increases 5%:
New Price = $105
If all customers remain:
Ending Cohort MRR = $105,000
NRR attributable to the price effect:
105%
However, if the price increase causes cancellations or downgrades, those losses reduce NRR.
Price changes must therefore be evaluated together with retention.
Price Increase With Customer Loss
Using the previous example, suppose price increases to $105 but 100 customers cancel.
Remaining customers:
900
Ending MRR:
900 × $105 = $94,500
NRR:
$94,500 ÷ $100,000 = 94.5%
A 5% unit price increase produces a 5.5% decline in cohort recurring revenue because customer losses outweigh the higher price.
NRR and Price Decreases
A price decrease percentage can create contraction unless customer spending increases through another mechanism.
Suppose 1,000 existing customers pay $100 monthly.
Price declines 10%:
New Price = $90
If customer count and usage remain unchanged:
Ending Cohort MRR = $90,000
Starting MRR:
$100,000
NRR:
90%
The customer base remains fully intact by count, yet recurring revenue falls 10%.
Pricing and retention are therefore different dimensions.
Discounts and NRR
A permanent retention discount can improve logo retention while reducing NRR.
Suppose a customer pays:
$2,000 per Month
The company offers a 20% permanent discount to prevent cancellation.
New price:
$1,600
Contraction:
$400 MRR
The customer remains.
But recurring revenue from the starting cohort falls by $400.
The retention decision may still be economically attractive if losing the customer entirely would have eliminated all $2,000.
NRR and Average Revenue Per Account
Average revenue per account often rises when NRR is driven by account expansion.
Suppose 1,000 starting accounts generate:
$500,000 MRR
Starting ARPA:
$500
After churn and account expansion, 950 accounts remain and generate:
$550,000
Ending ARPA among retained accounts:
$550,000 ÷ 950 ≈ $578.95
NRR:
$550,000 ÷ $500,000 = 110%
The starting cohort generates more revenue despite fewer customer logos because retained accounts have become substantially more valuable.
NRR and Average Revenue Per User
A similar relationship can exist with average revenue per user.
Suppose recurring revenue grows inside the existing user cohort because more users adopt premium features or increase usage.
ARPU rises.
That can support NRR above 100%.
But if the denominator changes materially because many users leave, ARPU should be interpreted carefully alongside customer and revenue retention.
NRR and Annual Recurring Revenue
Annual recurring revenue can be used as the recurring base for annual NRR analysis.
Suppose:
Starting Cohort ARR = $25M
Churned ARR = $1.5M
Contraction ARR = $500K
Expansion ARR = $3M
Ending cohort ARR:
$26M
NRR:
$26M ÷ $25M = 104%
Existing customers produce $1 million more annualized recurring revenue than at the start.
NRR and CAC Payback
Strong NRR can improve realized CAC payback period because expanding customers generate more contribution after acquisition.
Suppose a customer’s monthly gross contribution begins at $200.
After six months, expansion increases it to $300.
The additional contribution helps recover the original acquisition investment faster.
Conversely, contraction can slow payback because the customer generates less contribution than initially expected.
NRR and Lifetime Value to CAC
The lifetime value to cac ratio can benefit from durable expansion.
If customers routinely grow their spending while remaining retained, expected lifetime customer value can increase.
But using company-wide NRR to forecast every customer’s future expansion can be misleading.
A 120% NRR might be driven by a small number of enterprise accounts while most customers never expand.
LTV assumptions should therefore be based on appropriate customer cohorts and historical behavior.
NRR and Margin
Higher NRR does not automatically mean stronger profitability.
Suppose a company increases recurring revenue through deeply discounted add-ons that generate very low margin.
NRR can improve because existing customers spend more.
Economic profit can improve much less—or even deteriorate.
Revenue retention and profit retention are not the same concept.
NRR and SaaS Sales Efficiency
The magic number saas can improve when strong NRR supports recurring-revenue growth without requiring equivalent new-customer sales spending.
Suppose existing customers produce significant net expansion.
Company recurring revenue grows even before new acquisition is added.
That can make the overall commercial growth engine more capital efficient.
High NRR can therefore be particularly valuable when expansion requires relatively modest incremental selling cost.
How Expansion Can Compound Growth
Suppose a recurring customer cohort starts with:
$10M Revenue
and sustains:
110% NRR
After one period:
$11M
If the same 110% retention-and-expansion factor were hypothetically repeated:
$11M × 1.10 = $12.1M
The cohort can compound without new customers.
Real customer cohorts do not normally maintain identical NRR indefinitely, but the example shows why revenue expansion within an installed base can become a powerful growth mechanism.
NRR by Customer Segment
Company-wide NRR can hide meaningful differences.
Suppose:
| Segment | Starting Revenue | Ending Cohort Revenue | NRR |
|---|---|---|---|
| Small Business | $2M | $1.7M | 85% |
| Mid-Market | $3M | $3.15M | 105% |
| Enterprise | $5M | $6M | 120% |
Overall:
Starting Revenue = $10M
Ending Cohort Revenue = $10.85M
Company NRR:
108.5%
The strong aggregate result is largely driven by enterprise expansion.
Small-business recurring revenue is shrinking materially.
Segment analysis reveals where the actual strength lies.
NRR by Cohort
Customers acquired in different years or months can also have different NRR.
Suppose 12-month NRR is:
2024 Cohort = 115%
2025 Cohort = 108%
2026 Cohort = 97%
Newer customers are expanding less or contracting more after comparable tenure.
The decline may indicate:
- weaker customer fit;
- less expansion opportunity;
- more discounting;
- pricing changes;
- worsening retention; or
- different segment mix.
Cohort analysis helps management distinguish structural changes from simple customer-age differences.
NRR and Customer Concentration
High NRR can be concentrated in a few accounts.
Suppose expansion revenue totals:
$2M
One customer contributes:
$1.2M
That account generates 60% of total expansion.
Company NRR may look strong, but the expansion engine is highly concentrated.
If that customer later churns, the metric can reverse sharply.
Distribution matters alongside the headline percentage.
NRR Trend Example
Suppose:
| Year | NRR |
|---|---|
| Year 1 | 94% |
| Year 2 | 99% |
| Year 3 | 104% |
| Year 4 | 110% |
The company moves from losing recurring value within the existing base to producing substantial net expansion.
Management should determine whether the improvement comes from:
lower churn;
less contraction;
stronger expansion;
higher prices;
or a combination of these factors.
The trend is more informative when paired with GRR.
Strong NRR With Weak GRR
Suppose:
GRR = 75%
Expansion = 40% of Starting Revenue
NRR:
115%
The ending cohort is larger than the starting cohort.
But 25% of starting revenue disappeared before expansion.
That can indicate an aggressive land-and-expand model, but it can also signal serious retention problems hidden by a smaller number of rapidly growing accounts.
Always inspect GRR alongside NRR.
Strong GRR With Lower NRR
Suppose:
GRR = 99%
Expansion = 1%
NRR:
100%
The company retains almost all recurring revenue but has little expansion.
This may still be an excellent customer base if the business model has naturally limited upsell potential.
NRR expectations should reflect how the product is designed to monetize customers over time.
Can NRR Exceed 100% With Customer Churn?
Yes.
Suppose 5% of customers churn, but retained customers expand enough to more than replace the revenue lost.
Logo retention can be below 100%.
GRR can be below 100%.
NRR can still exceed 100%.
This is one of the reasons the three metrics should not be treated as interchangeable.
What Is a Good Net Revenue Retention Rate?
There is no universal percentage for every business.
A useful NRR benchmark depends on:
- customer segment;
- pricing model;
- contract structure;
- natural expansion opportunities;
- customer concentration;
- business maturity;
- product breadth;
- usage behavior; and
- measurement period.
A product with no natural upsell opportunity may have strong economics with NRR near 100%.
A seat-based enterprise platform may expect substantial expansion above 100%.
The correct benchmark depends on the underlying business model.
How to Improve NRR
NRR improves when the company:
retains more recurring revenue;
reduces customer downgrades;
creates genuine customer expansion;
prices products appropriately;
improves adoption;
cross-sells useful products;
and aligns pricing with customer value growth.
The goal should not be to maximize NRR through aggressive upselling that eventually damages customer relationships.
Durable expansion should follow actual customer value.
Common Net Revenue Retention Mistakes
A common mistake is including new-customer revenue.
Another is forgetting contraction and counting only full churn.
Businesses can also confuse GRR with NRR and exclude expansion incorrectly.
Another mistake is applying company-wide expansion assumptions to every customer cohort.
Price increases can raise NRR while simultaneously weakening logo retention.
A high NRR can also hide poor GRR.
Finally, NRR is a recurring-revenue metric, not a direct measure of margin, cash flow, or profitability.
Frequently Asked Questions
What is net revenue retention in simple terms?
Net revenue retention measures how recurring revenue from an existing customer cohort changes after churn, contraction, and expansion.
What is the NRR formula?
NRR = (Starting Recurring Revenue − Churned Revenue − Contraction Revenue + Expansion Revenue) ÷ Starting Recurring Revenue × 100
What does 110% NRR mean?
It means the starting customer cohort ends the period generating 10% more recurring revenue than it did at the beginning.
Can NRR exceed 100%?
Yes.
Expansion revenue can exceed recurring revenue lost through churn and contraction.
Can NRR be below 100%?
Yes.
That means expansion was insufficient to replace churn and contraction.
Are new customers included in NRR?
No.
New customer revenue is excluded because NRR measures changes inside the starting customer cohort.
What is the difference between NRR and GRR?
GRR excludes expansion.
NRR includes expansion.
Can GRR be 90% while NRR is 110%?
Yes.
That means 10% of starting recurring revenue was lost before expansion, but expansion added enough revenue to take the ending cohort to 110% of its starting value.
Is NRR the same as logo retention?
No.
Logo retention measures customers retained by count. NRR measures recurring revenue retained and expanded.
How does customer churn affect NRR?
Lost customers remove recurring revenue from the starting cohort and therefore reduce NRR.
How does expansion revenue affect NRR?
Expansion increases recurring revenue from retained customers and can push NRR above 100%.
How do price increases affect NRR?
Higher prices for retained customers can increase recurring revenue, but resulting churn or downgrades can offset or reverse the effect.
How do price decreases affect NRR?
Lower recurring prices generally create contraction unless additional usage or expansion compensates for the reduction.
How does NRR affect MRR growth?
Strong NRR means the existing customer base contributes positively to recurring-revenue growth before new-customer MRR is added.
Why track NRR with GRR?
NRR shows the result after expansion. GRR shows how much recurring revenue survived before expansion. Together they reveal both customer-base durability and expansion strength.
Does high NRR guarantee profitability?
No.
NRR measures recurring revenue, not margins, operating expenses, customer-acquisition costs, or cash flow.
Why is net revenue retention important?
NRR shows whether existing customer relationships shrink, hold their value, or compound over time. Combined with GRR, logo retention, MRR growth, margin, and acquisition economics, it provides a powerful view of the durability and quality of recurring growth.




