


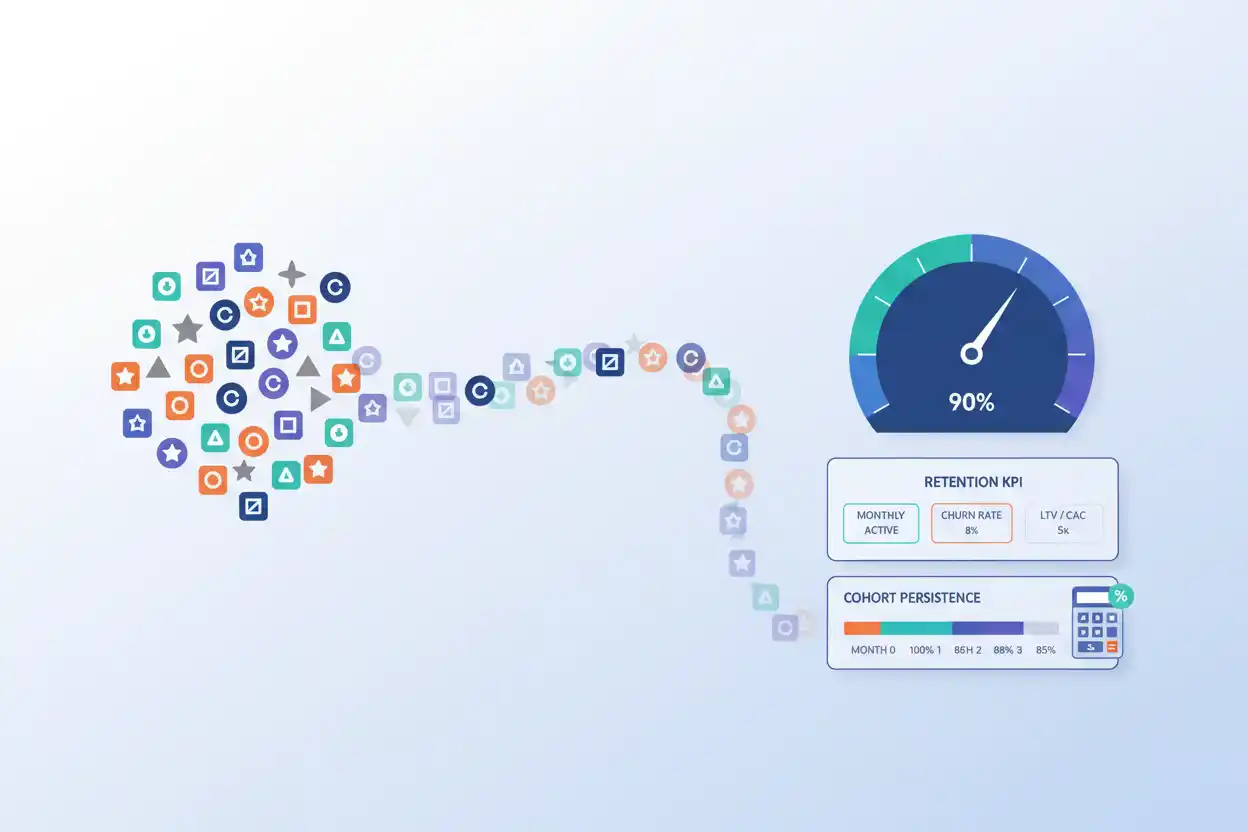
Logo retention measures the percentage of customers or accounts from a starting cohort that remain customers at the end of a defined period.
If a SaaS company begins the year with 1,000 customer accounts and 60 of those accounts churn, 940 remain.
Logo Retention = Retained Customer Accounts ÷ Starting Customer Accounts × 100
Logo Retention = 940 ÷ 1,000 × 100 = 94%
The company retained 94% of its starting customer logos.
Logo retention measures customer relationships by count, not by revenue value. Losing one large enterprise customer and losing one small account each reduce the logo count by one, even though their financial effects can be dramatically different.
That is why logo retention should be interpreted alongside gross revenue retention and other revenue-based metrics.
What Is Logo Retention?
In recurring-revenue businesses, a “logo” usually represents a customer account, company, organization, or other defined commercial relationship.
Logo retention asks:
How many of the customers we started with are still customers?
Suppose a company begins a quarter with:
500 Customer Accounts
During the quarter:
20 Accounts Churn
Retained accounts:
500 − 20 = 480
Logo retention:
480 ÷ 500 × 100 = 96%
The business retains 96% of the starting customer accounts.
New accounts acquired during the quarter do not increase the retention rate because they were not part of the starting cohort.
Logo Retention Formula
The basic formula is:
Logo Retention Rate = Retained Starting Customers ÷ Starting Customers × 100
Because:
Retained Starting Customers = Starting Customers − Churned Customers
the formula can also be written:
Logo Retention = (Starting Customers − Churned Customers) ÷ Starting Customers × 100
Suppose:
Starting Customers = 2,500
Churned Customers = 125
Retained customers:
2,500 − 125 = 2,375
Logo retention:
2,375 ÷ 2,500 × 100 = 95%
Logo Retention Example
Assume a B2B software company starts January with:
800 Active Customer Accounts
During January:
24 Starting Accounts Cancel
It also signs:
60 New Accounts
Ending customer count is:
800 − 24 + 60 = 836
But logo retention is not:
836 ÷ 800
because the 60 newly acquired accounts were not part of the starting cohort.
Instead:
Retained Starting Accounts = 800 − 24 = 776
Logo Retention = 776 ÷ 800 × 100
Logo Retention = 97%
The business retains 97% of the customers it had at the beginning of the month.
Logo Retention vs. Customer Churn
Logo retention and customer churn look at the same customer-count movement from opposite directions.
If definitions and periods match:
Logo Retention = 100% − Customer Churn Rate
Suppose customer churn is:
4%
Then:
Logo Retention = 100% − 4% = 96%
Likewise, 97% logo retention corresponds to 3% churn under a matching simple cohort definition.
Logo retention emphasizes the customers that remained.
Customer churn emphasizes those that left.
Why New Customers Are Excluded
Suppose a company starts with 1,000 customers.
During the year:
200 Starting Customers Churn
and:
500 New Customers Are Acquired
Ending customers:
1,000 − 200 + 500 = 1,300
The business grew its total customer count by 30%.
But retained starting customers are:
800
Logo retention is:
800 ÷ 1,000 × 100 = 80%
The company lost one-fifth of its original customer base despite ending the year with more customers than it started with.
Including new customers would hide that retention problem.
Logo Retention Can Fall While Customer Count Grows
Consider:
Starting Customers = 10,000
Churned Customers = 1,000
New Customers = 2,500
Logo retention:
9,000 ÷ 10,000 = 90%
Ending customer count:
10,000 − 1,000 + 2,500 = 11,500
Net customer growth:
15%
The company grows 15% while retaining only 90% of its starting customers.
Acquisition is more than offsetting churn.
That can produce strong headline growth while making the business increasingly dependent on continuous new-customer acquisition.
Logo Retention vs. Gross Revenue Retention
Logo retention counts customer relationships.
Gross revenue retention measures the value of recurring revenue retained before expansion.
Suppose a company starts with 100 customer accounts generating $1 million of recurring revenue.
It loses five small accounts worth $5,000 each annually.
Logo retention:
95 ÷ 100 = 95%
Revenue lost:
5 × $5,000 = $25,000
Assuming no other contraction:
GRR = ($1,000,000 − $25,000) ÷ $1,000,000
GRR = 97.5%
The company retains 95% of logos but 97.5% of recurring revenue.
The customers lost were below average in size.
High Logo Retention With Weak Revenue Retention
Now suppose the company starts with:
100 Customers
$1,000,000 Recurring Revenue
Only one customer churns.
Logo retention is:
99%
But that customer contributes:
$200,000
Revenue retained:
$800,000
GRR, ignoring other contraction:
80%
The company retains 99% of its accounts but only 80% of its starting recurring revenue.
This is why enterprise businesses should not evaluate retention using customer count alone.
Lower Logo Retention With Stronger GRR
The reverse can occur when many small customers leave.
Suppose:
Starting Accounts = 1,000
Starting Recurring Revenue = $10 Million
The company loses:
100 Small Accounts
Total recurring revenue lost:
$200,000
Logo retention:
900 ÷ 1,000 = 90%
GRR before other contraction:
$9.8M ÷ $10M = 98%
Ten percent of customer logos disappear, but only 2% of starting recurring revenue is lost.
The company may be deliberately moving away from low-value customers.
Logo Retention vs. Net Revenue Retention
Net revenue retention incorporates expansion from retained customers.
Logo retention does not.
Suppose:
Starting Customers = 500
25 Customers Churn
Logo retention:
475 ÷ 500 = 95%
Starting recurring revenue:
$5 Million
Revenue lost from churn and contraction:
$300,000
Expansion from retained customers:
$700,000
Ending recurring revenue from the starting cohort:
$5M − $300K + $700K = $5.4M
NRR:
$5.4M ÷ $5M = 108%
The company retains 95% of customer logos while the retained cohort grows revenue to 108% of its original level.
Customer-count retention and revenue expansion can coexist.
Logo Retention and Expansion Revenue
Expansion revenue does not affect whether a logo is retained.
Suppose one customer pays:
$10,000 Annually
and later expands to:
$30,000
The company still has one customer logo.
Expansion revenue:
$20,000
Logo count:
Unchanged
Expansion can therefore increase customer value without changing logo retention.
That makes the two metrics complementary rather than substitutes.
Logo Retention and Revenue Churn
Revenue churn measures the revenue impact of lost customers or qualifying recurring-revenue losses under its defined methodology.
Logo retention ignores account value.
Suppose two companies each retain 90% of their logos.
Company A loses mostly small customers.
Company B loses its largest customers.
Their logo-retention percentages are identical, but Company B can suffer substantially greater revenue churn.
Revenue weighting provides information that customer counts cannot.
Monthly Logo Retention
Suppose a subscription company begins April with:
2,000 Accounts
During April:
40 Accounts Churn
Retained:
1,960
Monthly logo retention:
1,960 ÷ 2,000 × 100 = 98%
Monthly customer churn is therefore:
2%
Short-period retention can identify problems quickly, but one month may be affected by renewal schedules, billing issues, seasonality, or customer mix.
Quarterly Logo Retention
Suppose a company begins a quarter with:
1,500 Customers
and 75 of the starting customers leave during the quarter.
Retained Customers = 1,425
Quarterly logo retention:
1,425 ÷ 1,500 × 100 = 95%
The quarterly number should be compared with other quarters measured using the same customer definition.
Annual Logo Retention
Suppose a business begins the year with:
4,000 Customer Accounts
At year-end, 3,600 of those original accounts remain.
Annual Logo Retention = 3,600 ÷ 4,000 × 100
= 90%
The business retained 90% of its opening customer cohort over the year.
Any new accounts won during the year are excluded from the retention numerator.
Monthly Retention Does Not Simply Multiply Into Annual Retention
Suppose monthly logo retention is consistently 98%.
It is incorrect to say annual retention is:
98% × 12
Instead, under a simplified constant monthly-retention model:
Annual Retention ≈ 0.98¹²
≈ 78.47%
Equivalent annual churn:
≈ 21.53%
This is an illustrative compounding calculation.
Actual annual retention is better measured directly using a defined annual starting cohort whenever that data is available.
Logo Retention by Customer Segment
Company-wide retention can hide important differences.
Suppose:
| Segment | Starting Accounts | Retained Accounts | Logo Retention |
|---|---|---|---|
| Small Business | 2,000 | 1,700 | 85% |
| Mid-Market | 800 | 744 | 93% |
| Enterprise | 200 | 196 | 98% |
Overall:
Starting Accounts = 3,000
Retained Accounts = 2,640
Company-wide logo retention:
2,640 ÷ 3,000 = 88%
The 88% headline result hides a much stronger enterprise customer base and significantly weaker small-business retention.
Logo Retention by Acquisition Channel
Suppose one acquisition channel produces:
12-Month Logo Retention = 95%
while another produces:
12-Month Logo Retention = 70%
If their customer acquisition costs are similar, the first channel may create much stronger economics because customers survive longer.
A channel with inexpensive acquisition can still be unattractive when retention is poor.
This is why customer-acquisition analysis should continue beyond the initial conversion.
Logo Retention and Lifetime Value to CAC
The lifetime value to cac ratio depends heavily on whether customers remain long enough to generate the lifetime value assumed in the model.
Suppose CAC is:
$1,000
and modeled lifetime value is:
$4,000
LTV:CAC:
4:1
If newer cohorts show materially weaker logo retention, the lifetime estimate may no longer be realistic.
Lower retention can shorten customer lifetime and reduce expected customer value even when acquisition cost remains unchanged.
Logo retention therefore provides useful evidence for testing LTV assumptions.
Logo Retention and CAC Payback
Retention also affects whether customers survive long enough to complete their CAC payback period.
Suppose:
CAC Payback = 12 Months
A customer that churns after five months may leave before its acquisition cost is recovered.
If customer cohorts consistently exhibit weak retention before Month 12, the acquisition model can be structurally unattractive even when average revenue per customer appears strong.
The timing of churn matters, not merely the annual percentage.
Logo Retention and Margin
Margin adds an important profitability dimension.
Suppose Company A retains 98% of customer logos but earns very little contribution from each customer.
Company B retains 94% but earns strong margins and has excellent expansion among the remaining accounts.
Company A has better customer-count retention.
That does not automatically make its economics better.
Retention should be evaluated together with customer value and cost-to-serve.
Retaining Unprofitable Customers
Maximizing logo retention at any cost can be counterproductive.
Suppose a customer generates:
$1,000 Monthly Revenue
but requires:
$1,300 of Relevant Monthly Cost
Retaining the customer indefinitely may destroy economic value.
If pricing cannot be improved and service requirements cannot be reduced, allowing the account to churn can be more rational than preserving a perfect retention percentage.
Metrics should support business economics rather than become goals detached from profitability.
Logo Retention and Discounting
Discounts can improve logo retention by persuading price-sensitive customers to remain.
Suppose an account pays:
$1,000 per Month
The customer plans to cancel.
A 20% discount reduces the price to:
$800
The customer stays.
From a logo-retention perspective, the account is successfully retained.
But recurring revenue contracts by:
$200 per Month
or:
$2,400 per Year
Logo retention improves while gross revenue retention can weaken.
That tradeoff should be visible in the metrics.
Logo Retention and Price Increases
Price increases can produce the opposite result.
Suppose 1,000 customers pay $100 monthly.
Price rises to $110.
If 50 customers cancel:
Logo retention:
950 ÷ 1,000 = 95%
Revenue after the increase:
950 × $110 = $104,500
Original revenue:
$100,000
The company retains only 95% of logos but generates more total monthly revenue from the remaining customer population.
Whether the change is successful depends on margin, customer lifetime, acquisition requirements, and longer-term retention.
Logo Retention and Product Expansion
A company with strong expansion revenue often benefits from retaining customer logos because each retained account remains available for future upsells and cross-sells.
Suppose an account starts at:
$20,000 ACV
and historically expands to:
$50,000 ACV
after three years.
Losing that customer during the first year sacrifices not only current revenue but also the future expansion opportunity.
Logo retention can therefore be strategically important even before the financial impact appears in current revenue.
Logo Retention and Customer Concentration
Consider a business with:
200 Customer Logos
Its five largest customers produce half of recurring revenue.
The company can retain:
195 of 200 Logos = 97.5%
while losing one or more of the largest accounts and suffering a severe revenue decline.
High logo retention is most informative when accompanied by customer-concentration and revenue-retention analysis.
Retention Cohort Example
Suppose 1,000 customers acquired in January remain as follows:
| Customer Age | Accounts Remaining | Cohort Logo Retention |
|---|---|---|
| Start | 1,000 | 100% |
| Month 1 | 950 | 95% |
| Month 3 | 900 | 90% |
| Month 6 | 850 | 85% |
| Month 12 | 800 | 80% |
Twelve-month logo retention is:
800 ÷ 1,000 = 80%
The table also reveals when customers leave.
If most churn occurs during the first month, onboarding may deserve attention.
If retention remains strong initially but falls around renewal, pricing, contract terms, or long-term value may be more relevant.
Comparing Customer Cohorts
Suppose 12-month logo retention is:
2024 Cohort = 82%
2025 Cohort = 88%
2026 Cohort = 93%
The improvement suggests newer customers are remaining at a much higher rate after comparable tenure.
Possible explanations include better qualification, onboarding, product quality, pricing, customer success, or customer mix.
Comparing cohorts at equal ages prevents older cohorts from being unfairly compared with newer ones.
Retention and Reacquired Customers
Businesses should define how reactivated or returning customers are treated.
Suppose a customer cancels during March and returns in June.
For the March starting cohort, the customer did churn at the time the relationship ended.
Whether the later return is treated as a new logo, a reactivation, or restoration of the original logo depends on the company’s reporting methodology.
Consistent definitions matter more than choosing one universally correct treatment.
Account Mergers and Splits
Customer-count metrics can become complicated when accounts merge or split.
Suppose two customer accounts merge into one legal entity.
The company’s logo count falls by one even though no economic customer relationship was lost.
Likewise, a single customer may split into multiple billing accounts, increasing logo count without genuine acquisition.
These structural changes should be normalized when they materially distort retention analysis.
Defining an Active Logo
Businesses should define what counts as an active logo.
Possible definitions include:
- paying customer account;
- active contract;
- active subscription;
- billed organization; or
- another meaningful commercial unit.
Free users should not automatically be treated as customer logos in a B2B recurring-revenue calculation unless the metric is intentionally designed that way.
The same definition should be used in both the starting and ending cohort.
What Is a Good Logo Retention Rate?
There is no universal good percentage.
A suitable benchmark depends on:
- customer segment;
- contract duration;
- price;
- business model;
- natural customer lifecycle;
- switching costs;
- customer concentration;
- product maturity; and
- measurement period.
Annual enterprise retention cannot be compared directly with monthly retention for a low-cost consumer subscription.
The most useful benchmark is often the company’s own historical performance among comparable customer cohorts.
How to Improve Logo Retention
Improving retention begins with understanding why customers leave.
Potential improvements include better customer qualification, faster onboarding, clearer product value, improved reliability, responsive support, stronger account management, proactive renewal processes, better billing systems, and pricing aligned with realized value.
Not every retention problem should be solved with discounts.
A customer who never achieved value from the product requires a different intervention from one leaving because of a failed payment.
Common Logo Retention Mistakes
A common mistake is adding new customers to the retention numerator.
Another is dividing retained customers by ending customer count instead of starting cohort size.
Businesses can also confuse logo retention with revenue retention.
A high rate can conceal the loss of large customers.
Companies may treat account mergers or splits as real retention movement.
Another mistake is comparing monthly and annual percentages directly.
Finally, maximizing retention without considering customer profitability can preserve economically unattractive accounts.
Frequently Asked Questions
What is logo retention in simple terms?
Logo retention is the percentage of starting customer accounts that remain customers at the end of a defined period.
What is the logo retention formula?
Logo Retention = Retained Starting Customers ÷ Starting Customers × 100
or:
Logo Retention = (Starting Customers − Churned Customers) ÷ Starting Customers × 100
What is a logo in SaaS metrics?
A logo generally represents one customer account or organization rather than an individual user.
How do you calculate logo retention?
If a business starts with 1,000 customer accounts and retains 940:
940 ÷ 1,000 × 100 = 94%
Are new customers included in logo retention?
No.
New customers were not part of the starting cohort and therefore should not increase the retention percentage.
Is logo retention the same as customer churn?
They are complementary under matching definitions.
Logo Retention = 100% − Customer Churn
Is logo retention the same as gross revenue retention?
No.
Logo retention measures customers by count.
GRR measures recurring revenue retained before expansion.
Can logo retention be high while GRR is low?
Yes.
Losing only a few large customers can preserve a high percentage of logos while destroying a large share of recurring revenue.
Can logo retention be low while GRR is high?
Yes.
A company can lose many small customers but retain most of its recurring revenue.
Does expansion revenue increase logo retention?
No.
A customer can spend more without becoming an additional retained logo.
Can discounts improve logo retention?
Yes, but they can reduce recurring revenue and margin. Customer-count retention and revenue economics should therefore be evaluated together.
How does logo retention affect LTV:CAC?
Higher sustainable retention can increase customer lifetime and therefore support higher lifetime value, improving LTV:CAC when other factors remain comparable.
Why does logo retention matter for CAC payback?
Customers need to remain long enough to generate the contribution required to recover acquisition spending. Weak early retention can undermine modeled payback.
Can logo retention exceed 100%?
No under the standard starting-cohort definition. Retention of the original customer cohort cannot exceed the number of customers that existed at the start.
Why should logo retention be analyzed by cohort?
Cohort analysis shows how customers acquired in different periods behave at comparable ages and helps identify when churn occurs.
Why is logo retention important?
It shows whether a business can preserve its customer relationships rather than relying entirely on continuous acquisition. Combined with revenue retention, expansion, margin, and customer-acquisition economics, it provides a clearer view of the durability of growth.




