


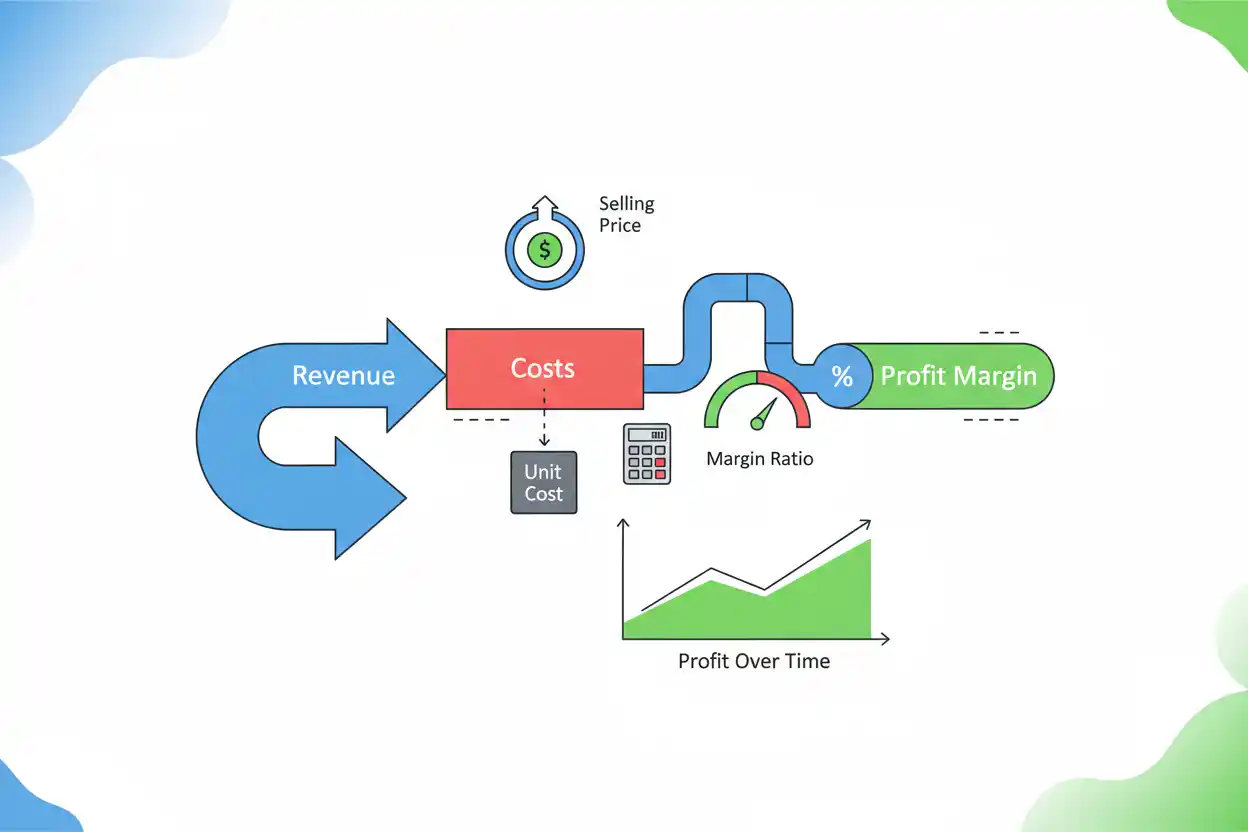
Margin measures how much of a selling price or revenue remains after subtracting a specified cost or set of costs. It is usually expressed either as a dollar amount or as a percentage of revenue.
If a product sells for $100 and the relevant cost is $60:
Margin Amount = Revenue − Cost
Margin Amount = $100 − $60 = $40
The margin percentage is:
Margin % = Margin Amount ÷ Revenue × 100
Margin % = $40 ÷ $100 × 100 = 40%
The business retains 40 cents of the selling price after the cost included in this particular margin calculation.
The word margin is broad. Gross margin, operating margin, net margin, and contribution margin all subtract different costs. A margin percentage is therefore meaningful only when the numerator and cost definition are clear.
What Is Margin?
Margin expresses the portion of revenue remaining after specified costs are deducted.
For a simple product:
Revenue per Unit = $50
Relevant Cost per Unit = $30
Margin amount:
$50 − $30 = $20
Margin percentage:
$20 ÷ $50 × 100 = 40%
The $20 is the amount remaining per sale before any costs not included in the calculation.
The 40% expresses the same economics relative to the $50 selling price.
This distinction between margin dollars and margin percentage is important. A business can improve one while the other moves differently because of changes in price, sales volume, cost mix, or product mix.
Margin Formula
A general margin formula is:
Margin Amount = Revenue − Relevant Costs
Percentage margin is:
Margin % = (Revenue − Relevant Costs) ÷ Revenue × 100
For an individual product:
Margin % = (Selling Price − Unit Cost) ÷ Selling Price × 100
Suppose:
Selling Price = $80
Unit Cost = $52
Margin amount:
$80 − $52 = $28
Margin percentage:
$28 ÷ $80 × 100 = 35%
The margin is $28 per unit, or 35% of the selling price.
Margin Example
Assume a company sells 10,000 units at $40 each.
Revenue:
10,000 × $40 = $400,000
The applicable product costs total:
$260,000
Margin amount:
$400,000 − $260,000 = $140,000
Margin percentage:
$140,000 ÷ $400,000 × 100 = 35%
The company retains $140,000, or 35% of revenue, after the costs included in this margin calculation.
If additional operating expenses, interest, taxes, or other costs remain, the $140,000 is not necessarily final profit.
How to Calculate Margin From Selling Price and Cost
Suppose a product costs $75 and sells for $120.
First find the difference:
$120 − $75 = $45
Then divide by the selling price:
$45 ÷ $120 = 0.375
Convert to a percentage:
0.375 × 100 = 37.5%
The margin is:
$45 per Unit
or:
37.5%
How to Find Cost From Price and Margin
If selling price and margin percentage are known:
Cost = Selling Price × (1 − Margin %)
Suppose:
Selling Price = $200
Margin = 30%
Cost:
$200 × (1 − 0.30)
$200 × 0.70 = $140
Check:
$200 − $140 = $60
$60 ÷ $200 = 30%
The applicable cost is $140.
How to Find Selling Price From Cost and Target Margin
If cost and desired margin percentage are known:
Selling Price = Cost ÷ (1 − Target Margin %)
Suppose:
Cost = $60
Target Margin = 40%
Then:
Selling Price = $60 ÷ 0.60
Selling Price = $100
Check:
($100 − $60) ÷ $100 = 40%
This formula is especially important because simply adding 40% to cost does not produce a 40% margin.
Margin vs. Markup
Margin and markup use different denominators.
Margin:
Margin % = Profit Amount ÷ Selling Price × 100
Markup:
Markup % = Profit Amount ÷ Cost × 100
Suppose:
Cost = $60
Selling Price = $100
Profit amount:
$40
Margin:
$40 ÷ $100 = 40%
Markup:
$40 ÷ $60 ≈ 66.67%
The same transaction has a 40% margin but approximately 66.67% markup.
Confusing the two can produce substantial pricing errors.
Why Adding a Target Margin to Cost Is Wrong
Suppose cost is $100 and management wants a 30% margin.
Incorrect approach:
$100 × 1.30 = $130
At a $130 selling price:
Margin = ($130 − $100) ÷ $130 × 100
≈ 23.08%
The actual margin is only about 23.08%.
Correct price:
$100 ÷ (1 − 0.30)
$100 ÷ 0.70 ≈ $142.86
Check:
($142.86 − $100) ÷ $142.86 ≈ 30%
Margin targets must be solved using revenue as the denominator.
Margin vs. Gross Margin
Gross margin is a specific form of margin based on gross profit.
Gross Margin = Gross Profit ÷ Revenue × 100
and:
Gross Profit = Revenue − Cost of Goods Sold
Suppose:
Revenue = $1,000,000
COGS = $600,000
Gross profit:
$400,000
Gross margin:
40%
The broader term margin can refer to this result, but it can also refer to several other profitability levels.
Using the specific term gross margin prevents ambiguity when COGS is the cost being deducted.
Margin vs. Contribution Margin
Contribution margin focuses on revenue remaining after variable costs.
Suppose:
Selling Price = $100
Variable Cost = $55
Contribution margin amount:
$45
Contribution margin percentage:
$45 ÷ $100 × 100 = 45%
Fixed costs are not deducted in that calculation.
Contribution margin is especially useful for break-even and incremental-volume analysis, while other margin measures answer broader profitability questions.
Margin vs. Net Margin
Net margin measures final net income relative to revenue.
Suppose:
Revenue = $2,000,000
Net Income = $160,000
Net margin:
$160,000 ÷ $2,000,000 × 100 = 8%
A company can therefore have:
Gross Margin = 40%
but:
Net Margin = 8%
because operating expenses, financing costs, taxes, and other recognized items consume part of the gross profit.
Margin and Unit Cost
Accurate unit cost is essential when calculating product-level margin.
Suppose selling price is $25.
If actual cost is $15:
Margin = ($25 − $15) ÷ $25 = 40%
If management incorrectly believes unit cost is only $12:
Reported Margin = ($25 − $12) ÷ $25 = 52%
The apparent margin is overstated by 12 percentage points.
Incomplete cost information can therefore make pricing and profitability decisions look stronger than they really are.
Margin and Break-Even Price
The break-even price identifies a selling price at which the relevant revenue equals the defined cost structure at a specified volume.
At exact break-even:
Profit Margin Under That Cost Definition = 0%
Suppose break-even price is $80 and the actual price is $100.
The $20 difference provides room for profit under the assumptions.
But the precise margin depends on the actual costs used in the calculation.
Break-even identifies the zero-profit threshold; margin measures how much remains relative to revenue above the applicable costs.
Margin and Discount Percentage
A discount percentage can have a disproportionate effect on margin.
Suppose:
Price = $100
Cost = $60
Original margin:
40%
A 20% discount creates a new price of:
$80
New margin amount:
$80 − $60 = $20
New margin percentage:
$20 ÷ $80 × 100 = 25%
The price fell 20%.
Margin percentage fell from 40% to 25%.
Margin dollars fell from $40 to $20—a 50% reduction.
Volume Required After a Discount
Using the same example, suppose the business sells 1,000 units before discounting.
Original margin dollars:
1,000 × $40 = $40,000
After discounting, margin dollars per unit are only:
$20
Units needed to produce the same $40,000:
$40,000 ÷ $20 = 2,000 Units
Sales volume must double.
A discount that looks modest as a percentage of price can require a very large volume response to preserve margin dollars.
Margin and Price Increases
A price increase percentage can improve margin when costs remain relatively stable.
Suppose:
Price = $100
Cost = $70
Original margin:
30%
Price rises 10%:
New Price = $110
Cost remains $70.
New margin amount:
$40
New margin percentage:
$40 ÷ $110 × 100 ≈ 36.36%
A 10% selling-price increase raises the margin from 30% to approximately 36.36% in this example.
Customer demand and volume response still matter.
Margin and Price Decreases
A price decrease percentage can rapidly compress profitability.
Suppose:
Price = $100
Cost = $80
Margin:
20%
A 10% price decrease produces:
New Price = $90
New margin amount:
$10
New percentage:
$10 ÷ $90 × 100 ≈ 11.11%
A 10% price reduction nearly halves margin dollars.
This illustrates why low-margin businesses are particularly sensitive to discounting.
Margin Improvement Through Lower Costs
Margin can improve without a price increase.
Suppose:
Selling Price = $100
Original Cost = $75
Original margin:
25%
Operational improvements reduce cost to:
$65
New margin:
($100 − $65) ÷ $100 = 35%
The margin improves by ten percentage points while the customer price remains unchanged.
Supplier negotiations, automation, productivity, product redesign, and lower waste can all affect margins through cost reduction.
Margin Can Fall Despite Higher Revenue
Suppose:
Period 1
Revenue = $1M
Relevant Profit = $400K
Margin:
40%
Period 2
Revenue = $1.5M
Relevant Profit = $450K
Margin:
$450K ÷ $1.5M = 30%
Revenue grows 50%.
Profit dollars grow only 12.5%.
Margin falls from 40% to 30%.
The company is larger but earns less profit from each revenue dollar.
Margin Can Rise While Revenue Falls
The reverse can also occur.
Period 1:
Revenue = $1M
Profit = $200K
Margin:
20%
Period 2:
Revenue = $800K
Profit = $200K
Margin:
25%
Revenue declines 20%, but the same profit is generated on a smaller revenue base.
Margin improves.
Whether the overall result is desirable depends on cash flow, scale, market position, future growth, and capital requirements.
Product Mix and Margin
Company margin can change even when individual product prices and costs remain unchanged.
Suppose:
Product A:
Margin = 20%
Product B:
Margin = 60%
If customers buy more Product B, company-wide margin can rise because the revenue mix shifts toward the higher-margin product.
If sales shift toward Product A, total revenue might grow while company margin falls.
Understanding product mix is therefore important when analyzing changes in aggregate profitability.
Weighted Margin Example
Suppose:
Product A generates:
$800,000 Revenue at 20% Margin
Margin dollars:
$160,000
Product B generates:
$200,000 Revenue at 60% Margin
Margin dollars:
$120,000
Total revenue:
$1,000,000
Total margin dollars:
$280,000
Company-wide margin:
$280,000 ÷ $1,000,000 = 28%
It would be incorrect to simply average 20% and 60% to get 40%.
The company-wide percentage must be weighted by revenue.
Margin and Monthly Recurring Revenue
For a subscription business, monthly recurring revenue measures recurring scale, while margin measures profitability relative to that revenue.
Suppose:
MRR = $500,000
and monthly gross margin is:
80%
Approximate recurring gross profit:
$500,000 × 80% = $400,000
If MRR increases to $600,000 but margin falls to 60%:
Gross Profit = $360,000
Recurring revenue grew 20%, yet gross profit fell $40,000.
Growth without margin context can therefore be misleading.
Margin and Logo Retention
Logo retention can affect margin indirectly through customer mix.
Suppose low-margin customers churn while high-margin customers remain.
Overall margin can improve even as customer retention worsens.
Alternatively, losing highly profitable customers can reduce margin quality substantially.
A stronger margin therefore does not automatically mean retention improved.
Customer economics need to be segmented.
Margin and Lifetime Value to CAC
The lifetime value to cac ratio is highly sensitive to margin.
Suppose lifetime customer revenue is:
$10,000
At 40% gross margin:
Gross-Profit LTV = $4,000
At 80%:
Gross-Profit LTV = $8,000
If CAC is $2,000:
At 40% margin:
LTV:CAC = 2:1
At 80% margin:
LTV:CAC = 4:1
Customer revenue and acquisition cost are unchanged. Better margin doubles the modeled ratio.
Margin and the SaaS Magic Number
The magic number saas metric is primarily revenue-based, so margin is essential context.
Suppose two SaaS businesses each produce a Magic Number of 1.5.
Company A gross margin:
85%
Company B:
35%
Both generate similar annualized incremental revenue relative to sales and marketing spending.
Company A retains much more gross profit from that revenue.
Commercial efficiency should therefore not be interpreted independently of margins.
Margin and Month-Over-Month Growth
Month-over-month growth can be calculated for margin percentages or margin dollars.
Suppose margin percentage moves:
January = 30%
February = 33%
The change in percentage points is:
33% − 30% = 3 Percentage Points
Relative growth in the margin rate is:
(33% − 30%) ÷ 30% × 100 = 10%
These are different statements.
Margin improved by 3 percentage points, which represents a 10% relative increase in the margin rate.
For profitability reporting, percentage-point change is often clearer.
Margin Percentage vs. Percentage Points
Suppose margin falls from 40% to 30%.
The decline is:
10 Percentage Points
Relative percentage decline:
(30% − 40%) ÷ 40% × 100 = −25%
Saying “margin fell 10%” can therefore be ambiguous.
It may mean a 10-percentage-point decline or a 10% relative decrease.
Clear reporting should distinguish the two.
Margin Trend Example
Suppose:
| Quarter | Revenue | Margin Dollars | Margin % |
|---|---|---|---|
| Q1 | $1.0M | $300K | 30% |
| Q2 | $1.1M | $352K | 32% |
| Q3 | $1.2M | $408K | 34% |
| Q4 | $1.3M | $468K | 36% |
Revenue rises steadily.
Margin dollars also increase.
Margin percentage improves from 30% to 36%.
The business is therefore generating more revenue and retaining a larger proportion of each revenue dollar after the included costs.
That is generally a stronger trend than revenue growth accompanied by margin compression.
Margin Compression
Margin compression means margin percentage declines.
Suppose selling price remains $50 while unit cost rises:
Original Cost = $30
Original margin:
40%
New cost:
$35
New margin:
($50 − $35) ÷ $50 = 30%
Margin compresses by ten percentage points.
Potential causes include supplier inflation, wage increases, discounts, higher fulfillment costs, product mix, or competitive pricing pressure.
Margin Expansion
Margin expansion means the margin percentage increases.
Suppose price remains $100 and cost falls from $75 to $65.
Original margin:
25%
New margin:
35%
Margin expands by ten percentage points.
Expansion can come from higher prices, lower costs, improved product mix, operating leverage, productivity, or more favorable customer economics.
Negative Margin
Margin can be negative.
Suppose:
Revenue = $80
Relevant Cost = $100
Margin amount:
−$20
Margin percentage:
−$20 ÷ $80 × 100 = −25%
The business loses $20 relative to each $80 of revenue under the selected cost definition.
Selling more units at the same economics increases the total loss unless another component changes.
Margin Above 100%
Under conventional revenue-based profit-margin definitions, a margin above 100% is generally not possible when the relevant cost amount is nonnegative because profit cannot exceed revenue merely by subtracting a nonnegative cost.
Unusual accounting gains, negative costs, credits, or specialized definitions can produce exceptional results, but these should not be confused with ordinary product or operating margins.
If a routine margin calculation produces 150%, check whether markup has been mistaken for margin.
What Is a Good Margin?
There is no universal good margin.
A suitable level depends on:
- industry;
- business model;
- capital intensity;
- cost structure;
- customer acquisition expense;
- pricing power;
- product lifecycle;
- competitive environment; and
- which margin definition is being used.
A supermarket can operate successfully at margins that would be unattractive for a software company.
The most useful comparisons generally involve the same margin definition across comparable businesses and periods.
How to Improve Margin
Margin can improve through higher realized prices, lower input costs, better productivity, reduced waste, automation, improved supplier terms, lower fulfillment costs, more profitable product mix, lower discounting, or removal of structurally unprofitable activities.
The goal should not be to maximize margin percentage blindly.
A high-margin product with almost no demand can generate less total profit than a lower-margin product sold at substantial profitable volume.
Management should consider margin, volume, growth, and capital requirements together.
Common Margin Mistakes
A common mistake is confusing margin with markup.
Another is failing to specify which costs are included.
Businesses can also average product margin percentages without weighting them by revenue.
Another error is assuming revenue growth means margin improvement.
Discount percentages are sometimes judged without calculating their disproportionate effect on profit dollars.
Companies can also compare gross margin with net margin as though they measure the same profitability level.
Finally, percentage-point changes and relative percentage changes should be reported separately.
Frequently Asked Questions
What is margin in simple terms?
Margin is the amount or percentage of revenue remaining after subtracting a specified cost or set of costs.
What is the margin formula?
Margin % = (Revenue − Relevant Costs) ÷ Revenue × 100
For a product:
Margin % = (Selling Price − Unit Cost) ÷ Selling Price × 100
How do you calculate a 40% margin?
If cost is $60:
Selling Price = $60 ÷ (1 − 0.40) = $100
The resulting margin is $40, or 40% of the $100 selling price.
Is margin the same as profit?
Margin is usually the profit amount expressed relative to revenue. Which profit is used depends on whether the calculation concerns gross, operating, net, contribution, or another margin.
Is margin the same as markup?
No.
Margin divides the profit amount by selling price.
Markup divides it by cost.
Is gross margin the same as margin?
Gross margin is one specific margin based on gross profit after COGS. The broader term margin can refer to several profitability measures.
How does a discount affect margin?
A discount reduces selling price and can reduce margin much faster than the percentage price reduction if costs remain unchanged.
Can revenue rise while margin falls?
Yes.
Revenue can grow while costs, discounts, or lower-margin product sales cause the percentage margin to decline.
Can margin improve while revenue falls?
Yes.
A business can generate less revenue but retain a larger proportion of each revenue dollar.
What is margin compression?
Margin compression is a decline in margin percentage.
What is margin expansion?
Margin expansion is an increase in margin percentage.
Can margin be negative?
Yes.
If the relevant cost exceeds revenue, the margin can be negative.
Why does margin matter for LTV:CAC?
Higher gross margin means more customer revenue becomes gross profit, which can increase estimated lifetime value relative to acquisition cost.
Why should margin be analyzed with growth?
High growth with falling margins can create weaker economics, while moderate growth with improving margins may create more sustainable profitability.
What is a good margin?
There is no universal percentage. A useful benchmark depends on the industry, business model, cost structure, and specific type of margin being measured.




