


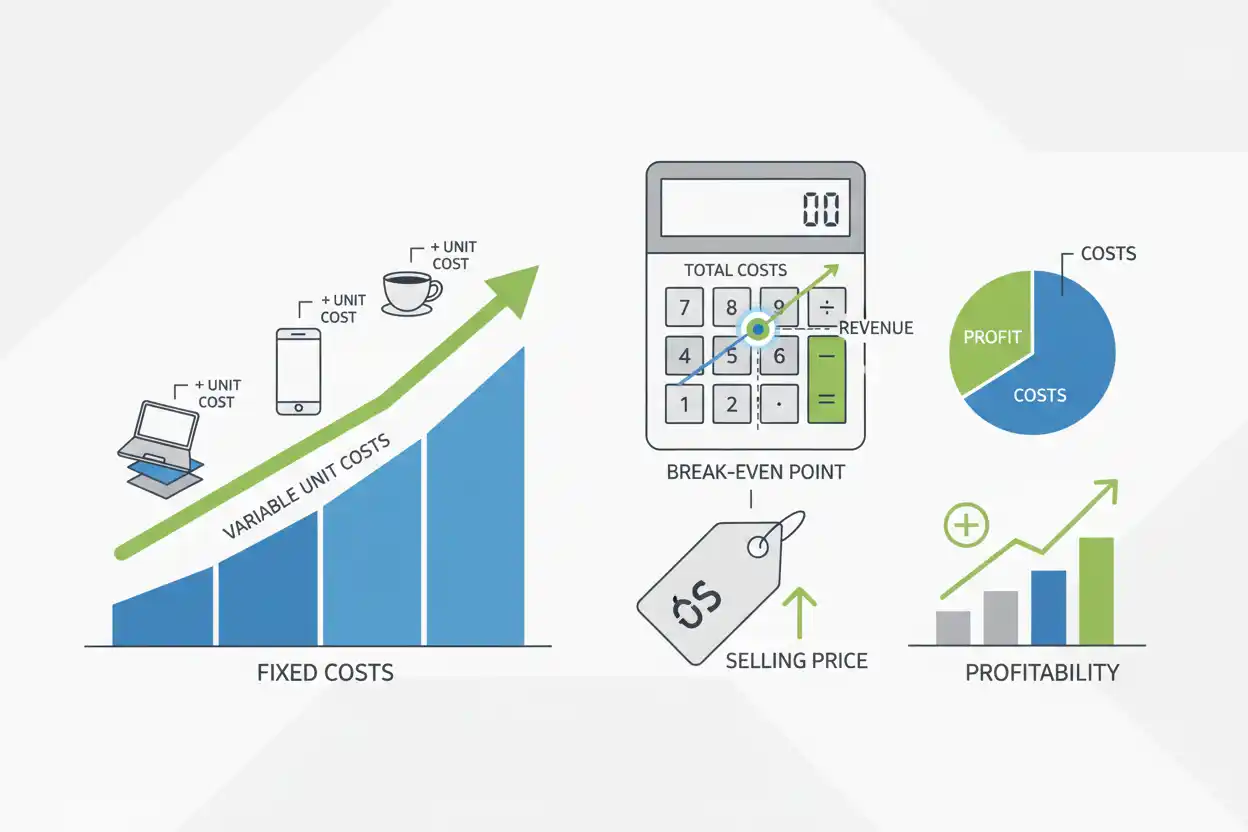
The break-even price is the selling price per unit required for total revenue to equal the relevant total costs at a specified sales volume. At that price and volume, the business earns neither a profit nor a loss under the assumptions used.
Suppose a company expects to sell 30,000 units, has $120,000 of fixed costs, and incurs $8 of variable cost per unit.
Fixed cost per expected unit is:
$120,000 ÷ 30,000 = $4
The break-even price is:
Break-Even Price = Variable Cost per Unit + Fixed Costs ÷ Expected Units Sold
Break-Even Price = $8 + ($120,000 ÷ 30,000) = $12
Selling all 30,000 units at $12 produces $360,000 of revenue.
Total costs are also $360,000:
Fixed Costs = $120,000
Variable Costs = 30,000 × $8 = $240,000
Total Costs = $360,000
The business therefore breaks even at a selling price of $12 per unit if it sells the assumed 30,000 units and the cost assumptions hold.
What Is Break-Even Price?
Break-even price identifies the price required to cover a defined cost structure at a given volume.
The concept is important because price, volume, and cost are interconnected.
A business cannot normally identify one universal break-even price without making assumptions about how many units it expects to sell.
Suppose fixed costs are $100,000 and variable cost is $10 per unit.
At 10,000 units:
Break-Even Price = $10 + ($100,000 ÷ 10,000)
= $20
At 20,000 units:
Break-Even Price = $10 + ($100,000 ÷ 20,000)
= $15
The same business has a lower break-even price at the higher volume because the $100,000 of fixed costs is spread across more units.
This relationship is closely connected to unit cost, but break-even price specifically asks what selling price is necessary to cover costs at the selected volume.
Break-Even Price Formula
A useful formula is:
Break-Even Price = Total Relevant Costs ÷ Expected Units Sold
When total costs are separated into fixed and variable components:
Break-Even Price = Variable Cost per Unit + (Fixed Costs ÷ Expected Units Sold)
The two formulas produce the same result when the cost assumptions are consistent.
Suppose:
Fixed Costs = $200,000
Variable Cost per Unit = $15
Expected Sales = 50,000 Units
Total variable cost:
50,000 × $15 = $750,000
Total cost:
$200,000 + $750,000 = $950,000
Using total cost:
$950,000 ÷ 50,000 = $19
Using the component formula:
$15 + ($200,000 ÷ 50,000) = $19
The break-even price is $19 per unit.
Break-Even Price Example
Assume a company plans to sell 40,000 units.
Its cost structure is:
| Cost Component | Amount |
|---|---|
| Fixed operating costs | $160,000 |
| Variable cost per unit | $6 |
| Expected units sold | 40,000 |
Total variable cost:
40,000 × $6 = $240,000
Total relevant cost:
$160,000 + $240,000 = $400,000
Break-even price:
$400,000 ÷ 40,000 = $10
At $10 per unit:
Revenue = 40,000 × $10 = $400,000
Revenue equals total relevant cost.
The company earns zero profit under the simplified assumptions.
Break-Even Price vs. Break-Even Point
Break-even price and break-even point solve related but different problems.
Break-even price asks:
At a specified volume, what selling price covers costs?
Break-even point asks:
At a specified selling price, how much volume is required to cover costs?
Suppose:
Fixed Costs = $120,000
Variable Cost = $8 per Unit
Selling Price = $20
Contribution per unit:
$20 − $8 = $12
Break-even volume:
$120,000 ÷ $12 = 10,000 Units
If management instead assumes 30,000 units will be sold and wants to determine the required price:
Break-Even Price = $8 + ($120,000 ÷ 30,000)
= $12
The inputs and unknown variable are different.
Break-Even Price vs. Break-Even Analysis
Break-even analysis is the broader framework for studying relationships among fixed costs, variable costs, prices, contribution, and activity levels.
Break-even price is one specific output from that framework.
Management might use a broader break-even analysis to ask:
How many units must be sold?
What price is required?
What happens if variable cost rises?
How much volume is needed after a discount?
What price supports a target profit?
The break-even-price calculation should remain focused on the price required at the selected activity level.
Break-Even Price and Contribution Margin
Contribution margin is central to break-even economics.
Per-unit contribution is:
Contribution Margin per Unit = Selling Price − Variable Cost per Unit
Suppose selling price is $20 and variable cost is $12:
Contribution Margin = $8 per Unit
If fixed costs are $160,000:
Break-Even Units = $160,000 ÷ $8 = 20,000 Units
At that volume, the $8 contribution from each of 20,000 units covers the $160,000 fixed cost.
When solving for break-even price instead, the formula works backward from expected volume to determine how much contribution each unit needs to generate.
Contribution Required at Break-Even
Suppose:
Fixed Costs = $300,000
Expected Sales = 50,000 Units
Required contribution per unit is:
$300,000 ÷ 50,000 = $6
If variable cost is $14:
Break-Even Price = $14 + $6 = $20
Each unit contributes $6 toward fixed costs.
Across 50,000 units:
50,000 × $6 = $300,000
The fixed cost is exactly covered.
Break-Even Price and Contribution Margin Ratio
The contribution margin ratio expresses contribution as a percentage of revenue.
At a break-even price of $20 and variable cost of $14:
Contribution Margin per Unit = $6
Contribution margin ratio:
$6 ÷ $20 × 100 = 30%
That ratio does not mean the business earns a 30% profit margin at break-even.
The $6 contribution is required to cover fixed costs.
After those fixed costs are fully covered, there is no profit remaining at the exact break-even point.
Break-Even Price and Margin
Margin should not be confused with break-even price.
Suppose:
Break-Even Price = $20
Actual Selling Price = $25
Difference above break-even:
$25 − $20 = $5 per Unit
Relative to selling price:
$5 ÷ $25 × 100 = 20%
However, that 20% should not automatically be labeled the company’s final net margin.
The precise margin depends on which costs were included when calculating the break-even price and what additional expenses or income items remain.
Break-Even Price and Revenue
Revenue at break-even is:
Break-Even Revenue = Break-Even Price × Expected Units
Using:
Break-Even Price = $12
Expected Units = 30,000
Revenue:
$12 × 30,000 = $360,000
If total relevant costs are also $360,000:
Profit = $360,000 − $360,000 = $0
That provides a straightforward check on the break-even-price calculation.
Price Above Break-Even
Suppose break-even price is $15 and the business sells 20,000 units at $18.
Additional amount above break-even:
$18 − $15 = $3 per Unit
Across 20,000 units:
$3 × 20,000 = $60,000
Assuming the original cost and volume assumptions remain valid:
Profit Above Break-Even = $60,000
A relatively small price difference can therefore have a substantial financial effect at higher volume.
Price Below Break-Even
Suppose the break-even price is $15 but management sells at $13.
Shortfall:
$15 − $13 = $2 per Unit
For 20,000 units:
$2 × 20,000 = $40,000
Under the unchanged assumptions, the company falls $40,000 short of covering the relevant cost structure.
Selling more at an inadequate price can increase the total loss if each additional unit fails to contribute enough toward the costs that need to be covered.
Break-Even Price and Expected Volume
Break-even price is highly sensitive to the assumed sales volume.
Suppose:
Fixed Costs = $240,000
Variable Cost = $10 per Unit
At 20,000 units:
Break-Even Price = $10 + ($240,000 ÷ 20,000)
= $22
At 40,000 units:
Break-Even Price = $16
At 80,000 units:
Break-Even Price = $13
The fixed-cost allocation per unit falls from $12 to $3 as volume rises.
But management should not choose an unrealistically high sales forecast merely to produce an attractive break-even price.
The expected volume must be commercially credible.
What Happens When Actual Volume Is Lower?
Suppose the business sets a price based on:
Expected Volume = 50,000 Units
Break-Even Price = $20
But actual sales reach only 40,000 units.
Assume variable cost is $12 and fixed costs are $400,000.
At 50,000 units:
Break-Even Price = $12 + ($400,000 ÷ 50,000)
= $20
At actual volume of 40,000 units, revenue is:
40,000 × $20 = $800,000
Variable costs:
40,000 × $12 = $480,000
Add fixed costs:
Total Cost = $480,000 + $400,000 = $880,000
Loss:
$800,000 − $880,000 = −$80,000
The price was a break-even price only at the assumed 50,000-unit sales level.
What Happens When Volume Is Higher?
Using the same assumptions:
Price = $20
Variable Cost = $12
Fixed Costs = $400,000
Suppose 60,000 units are sold.
Revenue:
60,000 × $20 = $1,200,000
Variable costs:
60,000 × $12 = $720,000
Total costs:
$720,000 + $400,000 = $1,120,000
Profit:
$1,200,000 − $1,120,000 = $80,000
The higher volume creates profit because the fixed cost was already fully covered at 50,000 units.
Break-Even Price and Target Profit
A business usually wants more than zero profit.
The break-even formula can be extended:
Target Price = Variable Cost per Unit + (Fixed Costs + Target Profit) ÷ Expected Units
Suppose:
Variable Cost = $8
Fixed Costs = $120,000
Expected Units = 30,000
Target Profit = $60,000
Calculate:
Target Price = $8 + ($120,000 + $60,000) ÷ 30,000
Target Price = $8 + $6
Target Price = $14
Break-even price was $12.
A $60,000 target profit raises the required price to $14 at the same volume.
Break-Even Price and Discount Percentage
A proposed discount percentage should be checked against break-even economics.
Suppose:
Current Price = $20
Break-Even Price = $14
The maximum reduction before reaching the break-even price, assuming volume does not change, is:
($20 − $14) ÷ $20 × 100
= 30%
A 25% discount produces:
Discounted Price = $20 × 75% = $15
The price remains $1 above break-even.
A 35% discount produces:
$20 × 65% = $13
That price falls $1 below break-even under the original volume assumptions.
Break-Even Price and Discounted Price
The discounted price must be evaluated with expected post-discount volume.
Suppose:
Original Price = $20
Break-Even Price at 10,000 Units = $15
A discount reduces the selling price to $14.
At the original sales volume, the price is below break-even.
However, if the lower price increases volume enough, the fixed cost per unit can fall and the break-even price itself can change.
The correct question is therefore not simply:
Is discounted price below the old break-even price?
It is:
What is the break-even price at the realistic sales volume expected after the discount?
Example: Discount With Higher Volume
Suppose fixed costs are $100,000 and variable cost is $10.
At 20,000 units:
Break-Even Price = $10 + ($100,000 ÷ 20,000)
= $15
Management wants to reduce the price from $18 to $14.
At $14, contribution is:
$14 − $10 = $4
Required volume to cover $100,000 of fixed costs:
$100,000 ÷ $4 = 25,000 Units
The discounted price can still break even if sales increase to 25,000 units.
The commercial question is whether the discount can realistically generate that volume.
Break-Even Price and Price Increases
A price increase percentage can create additional margin above break-even if customer demand remains sufficiently strong.
Suppose:
Current Price = $20
Break-Even Price = $16
The price rises 10%:
New Price = $22
Difference above break-even:
$22 − $16 = $6
Previously:
$20 − $16 = $4
The amount above break-even increases by $2 per unit.
However, if the higher price reduces sales volume, the break-even calculation should be rerun using the lower expected volume because fixed cost per unit may rise.
Break-Even Price and Price Decreases
A price decrease percentage can put the business closer to or below break-even.
Suppose:
Price = $25
Break-Even Price = $18
A 20% price reduction produces:
$25 × 80% = $20
The new price remains $2 above the original break-even price.
A 30% reduction produces:
$25 × 70% = $17.50
That falls below the original $18 threshold.
Again, if the lower price changes volume materially, the threshold itself needs to be recalculated.
Break-Even Price and Average Revenue Per Account
For account-based businesses, average revenue per account can be compared with the average cost required to support an account.
Suppose average monthly relevant costs are:
Variable Account Cost = $120
Allocated Fixed Cost = $80
Break-even revenue per account:
$120 + $80 = $200
If monthly ARPA is $250, the average account produces $50 above the simplified break-even level.
However, customer accounts can have very different support requirements, so averages can conceal unprofitable segments.
Break-Even Price and Average Revenue Per User
The same logic can be applied on a user basis when average revenue per user is commercially meaningful.
Suppose average relevant cost per paying user is $6 per month after fixed costs are allocated at expected scale.
Simplified break-even monthly price:
$6
If ARPU is $10:
Difference Above Break-Even = $4 per User
But if a significant portion of users are free, subsidized, or supported by advertising revenue, a direct user-price comparison may not represent the complete business model.
Break-Even Price and Annual Recurring Revenue
Annual recurring revenue measures recurring revenue scale rather than break-even pricing.
Suppose a subscription company has:
ARR = $5 Million
That does not establish whether the company has reached break-even.
If annual relevant costs are $6 million:
Simplified Shortfall = $1 Million
The business can have substantial recurring revenue and still operate below break-even.
Pricing, customer count, cost-to-serve, acquisition spending, and churn all determine whether the recurring base is economically sufficient.
Break-Even Price and Customer Churn
Customer churn matters because a pricing model built around a large customer base can fail if customers leave.
Suppose fixed costs are allocated across 10,000 customers.
If churn reduces the sustainable base to 8,000 while total fixed cost remains unchanged:
Original fixed cost per customer:
$400,000 ÷ 10,000 = $40
New fixed cost per customer:
$400,000 ÷ 8,000 = $50
The break-even revenue required per remaining customer rises by $10.
A pricing strategy that increases ARPA but causes heavy churn can therefore have more complicated economics than the price increase alone suggests.
Break-Even Price and CAC Payback
The cac payback period adds another dimension for customer-based businesses.
A price may cover ongoing service costs but still recover acquisition spending too slowly.
Suppose the recurring price produces enough contribution to cover normal operating costs but each acquired customer costs $2,000 in sales and marketing.
If contribution after service costs is only $100 per month:
Simplified CAC Payback = $2,000 ÷ $100 = 20 Months
The price may be above the short-term operating break-even level while still producing unattractive acquisition economics.
Pricing decisions therefore need both cost coverage and customer-acquisition analysis.
Break-Even Price and Business Model Changes
A break-even price can change when the business model changes.
Automation can lower variable cost.
A larger facility can increase fixed costs.
Supplier inflation can raise unit cost.
Moving toward self-service can reduce support expense.
Outsourcing can convert fixed costs into variable costs.
Each change affects the cost structure behind the calculation.
The break-even price should therefore be recalculated whenever the economics change materially rather than treated as a permanent number.
Sensitivity Analysis
A useful approach is to calculate break-even price under several realistic volume assumptions.
Suppose:
Fixed Costs = $300,000
Variable Cost = $12
| Expected Units | Fixed Cost per Unit | Break-Even Price |
|---|---|---|
| 20,000 | $15.00 | $27.00 |
| 30,000 | $10.00 | $22.00 |
| 50,000 | $6.00 | $18.00 |
| 75,000 | $4.00 | $16.00 |
The table shows how strongly price requirements depend on volume.
If management’s pricing plan only works economically at 75,000 units but realistic demand is closer to 30,000, the strategy contains significant risk.
What Is a Good Price Above Break-Even?
There is no universal percentage.
The appropriate markup above break-even depends on desired profit, customer value, competitive conditions, demand sensitivity, future investment requirements, risk, capital intensity, and the costs included in the calculation.
A business should not price at break-even simply because the formula identifies that threshold.
Break-even is normally a minimum economic reference point, not the target commercial outcome.
Common Break-Even Price Mistakes
A common mistake is calculating break-even price without specifying sales volume.
Another is excluding important variable or fixed costs from the numerator.
Businesses can also use unrealistic sales forecasts to create an artificially low break-even price.
Another error is treating the break-even price as a permanent threshold even after costs or volume expectations change.
Discounts should not be compared with an old break-even price without considering whether the discount changes demand.
A final mistake is assuming any price above break-even produces an adequate return. Breaking even only covers the defined costs; it does not guarantee an attractive profit or return on capital.
Frequently Asked Questions
What is break-even price in simple terms?
Break-even price is the selling price per unit required for revenue to equal the relevant total costs at a specified sales volume.
What is the break-even price formula?
A common formula is:
Break-Even Price = Variable Cost per Unit + Fixed Costs ÷ Expected Units Sold
It can also be written:
Break-Even Price = Total Relevant Costs ÷ Expected Units Sold
How do you calculate break-even price?
If fixed costs are $100,000, variable cost is $10 per unit, and expected sales are 20,000 units:
Break-Even Price = $10 + ($100,000 ÷ 20,000) = $15
Is break-even price the same as break-even point?
No.
Break-even price determines the required price at a specified volume.
Break-even point usually determines the required volume at a specified price.
Does break-even price include profit?
No.
At the exact break-even price and assumed volume, profit is zero under the cost definition used.
How do you add target profit to break-even price?
Use:
Target Price = Variable Cost per Unit + (Fixed Costs + Target Profit) ÷ Expected Units
Does higher sales volume reduce break-even price?
Usually, when fixed costs remain unchanged, higher volume spreads those costs across more units and lowers the required price.
Can a discounted price be below the old break-even price and still become profitable?
Potentially, if the lower price increases volume enough to reduce fixed cost per unit and cover total costs. The break-even calculation must be rerun using the new expected volume.
Can a business have high ARR and still be below break-even?
Yes.
ARR measures recurring revenue scale, not whether total revenue covers the company’s costs.
Does customer churn affect break-even pricing?
It can. A smaller sustainable customer base means fixed costs may need to be supported by fewer customers, raising the revenue required per remaining customer.
Is break-even price the same as unit cost?
They can be numerically similar when unit cost includes all relevant fixed and variable costs at the same volume. However, unit cost is a cost measure, while break-even price is the selling-price threshold required to cover the defined cost base.
Why should break-even price be recalculated?
Costs, expected volume, customer mix, supplier prices, operating capacity, and business structure can all change. A break-even price based on outdated assumptions can lead to poor pricing decisions.




