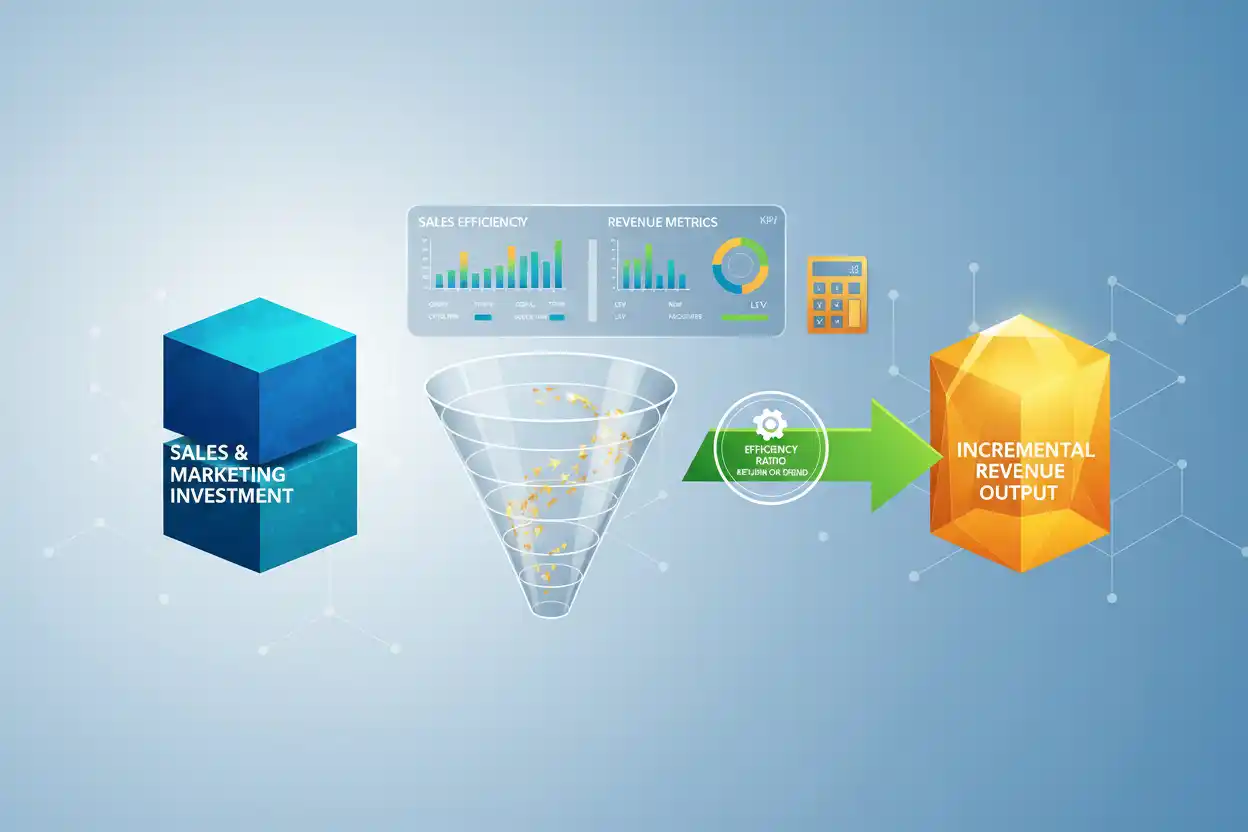
Sales efficiency measures how effectively a business converts sales and marketing resources into additional revenue or economic contribution.
A practical general formula is:
Sales Efficiency = Incremental Revenue Attributable to Sales & Marketing ÷ Sales & Marketing Cost
If a company spends $500,000 on sales and marketing and generates $750,000 of incremental revenue attributable to that investment:
Sales Efficiency = $750,000 ÷ $500,000 = 1.5
The business generated $1.50 of incremental revenue for each $1 of sales and marketing cost under the chosen measurement method.
Sales efficiency is a broad concept rather than one universally standardized accounting ratio. Different companies may use revenue, recurring revenue, gross profit, new ARR, bookings, or another output in the numerator.
The calculation is useful only when the numerator, denominator, and measurement period are defined consistently.
What Is Sales Efficiency?
Sales efficiency answers a fundamental commercial question:
How much useful economic output is the company generating from the resources devoted to selling and marketing?
Suppose Company A spends:
$1 Million
and generates:
$2 Million of Incremental Revenue
Sales efficiency:
2.0
Company B spends the same $1 million but generates:
$800,000
Sales efficiency:
0.8
Company A produces substantially more revenue per dollar of commercial investment.
That does not automatically make Company A more profitable. Revenue quality, margin, customer retention, and acquisition timing still matter.
Sales Efficiency Formula
A general formula is:
Sales Efficiency Ratio = Incremental Revenue ÷ Sales & Marketing Expense
A gross-profit-adjusted variation is:
Gross Profit Sales Efficiency = Incremental Gross Profit ÷ Sales & Marketing Expense
A recurring-revenue company might instead analyze:
Recurring Revenue Sales Efficiency = Incremental Recurring Revenue ÷ Sales & Marketing Expense
The appropriate version depends on the decision being made.
The company should not switch definitions between periods simply because another formula creates a more favorable result.
Sales Efficiency Example
Suppose a business reports:
Prior Revenue = $8 Million
Current Revenue = $10 Million
Incremental revenue:
$10M − $8M = $2M
Sales and marketing expense associated with that growth:
$1.25M
Sales efficiency:
$2M ÷ $1.25M
= 1.6
The business generated $1.60 of incremental revenue for every $1 of sales and marketing expense under this simplified approach.
Revenue-Based Sales Efficiency
Revenue-based efficiency is easy to understand:
Sales Efficiency = Incremental Revenue ÷ Sales & Marketing Cost
Suppose:
Incremental Revenue = $3M
S&M Expense = $2M
Then:
Sales Efficiency = 1.5
The ratio shows revenue productivity.
It does not show how much of that $3 million remains after cost of goods sold or service-delivery costs.
That distinction becomes important when gross margins vary significantly.
Gross-Profit-Adjusted Sales Efficiency
Suppose:
Incremental Revenue = $2M
Gross Margin = 75%
Incremental gross profit:
$2M × 75% = $1.5M
Sales and marketing expense:
$1M
Revenue-based sales efficiency:
$2M ÷ $1M = 2.0
Gross-profit-adjusted efficiency:
$1.5M ÷ $1M = 1.5
Both calculations are valid for different purposes.
The second provides a closer connection between customer economics and commercial spending.
Why Margin Changes the Interpretation
Consider two businesses.
Both generate:
$1M Incremental Revenue
using:
$500K Sales & Marketing Expense
Both have revenue-based sales efficiency of:
2.0
Company A gross margin:
90%
Company B gross margin:
30%
Incremental gross profit:
Company A:
$900K
Company B:
$300K
Gross-profit efficiency:
Company A:
$900K ÷ $500K = 1.8
Company B:
$300K ÷ $500K = 0.6
Identical revenue efficiency can conceal dramatically different economic outcomes.
Sales Efficiency vs. SaaS Magic Number
The magic number saas metric is a specific SaaS sales-efficiency framework.
A common Magic Number calculation uses:
Quarter-over-Quarter Increase in Recurring Revenue × 4 ÷ Prior-Quarter Sales & Marketing Expense
General sales efficiency is broader.
It may use:
- revenue;
- new ARR;
- gross profit;
- bookings;
- customer contribution; or
- another commercial output.
The SaaS Magic Number should therefore be treated as one specialized efficiency metric rather than a synonym for every sales-efficiency calculation.
Sales Efficiency vs. CAC Payback
The CAC payback period asks how long customer contribution takes to recover acquisition cost.
Sales efficiency asks how much output commercial spending generates.
Suppose two companies each have:
Sales Efficiency = 2.0
Company A has high gross margins and recovers CAC in six months.
Company B has much lower margins and needs 20 months.
Their revenue productivity appears identical, but capital-recovery speed differs substantially.
Sales Efficiency vs. LTV:CAC
The lifetime value to cac ratio compares estimated lifetime customer value with acquisition cost.
Sales efficiency focuses more directly on the productivity of commercial spending over a defined measurement period.
A business can have strong lifetime economics but temporarily weak sales efficiency if it is:
- hiring ahead of growth;
- entering a new market;
- building pipeline;
- experiencing long sales cycles; or
- investing in a new sales channel.
Conversely, strong current sales efficiency does not guarantee high customer lifetime value.
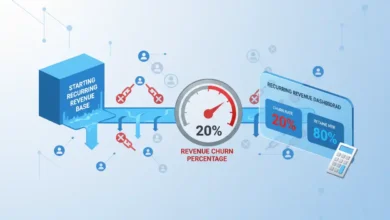
Sales Efficiency and Revenue Churn
Revenue churn can make the commercial engine look less efficient because newly generated revenue must replace revenue that disappears.
Suppose sales efforts generate:
$4M of New Revenue
but existing customers churn:
$3M
Net growth:
$1M
If sales and marketing cost is $2 million, a net-growth-based efficiency calculation is:
$1M ÷ $2M = 0.5
The acquisition team may be generating significant gross additions, yet company-level growth remains weak because the existing revenue base is leaking.
Retention and acquisition should therefore be separated when diagnosing low sales efficiency.
Sales Efficiency and Net Revenue Retention
Strong net revenue retention can improve overall commercial efficiency because existing customers generate additional recurring revenue without requiring a completely new customer acquisition for every dollar of growth.
Suppose a company begins with:
$10M ARR
NRR of:
110%
creates:
$1M of Net Expansion
before new-customer ARR is added.
If sales and customer-success resources supporting expansion are efficient, the company can grow recurring revenue with less dependence on new-logo acquisition.
Sales Efficiency and Gross Revenue Retention
Gross revenue retention helps reveal whether commercial investment is building on a durable base.
Company A:
GRR = 98%
Company B:
GRR = 75%
If both generate the same amount of new sales, Company B must replace far more lost revenue before producing net growth.
The sales organization can therefore appear less effective at the company level even if its gross new-bookings performance is similar.
Sales Efficiency and Logo Retention
Logo retention provides customer-count context.
Suppose sales acquires:
500 New Accounts
during the year.
If:
450 Existing Accounts Churn
the company adds only 50 net logos.
A sales team can produce large gross acquisition numbers while the customer base barely grows.
High acquisition combined with poor retention creates a commercial treadmill.
Sales Efficiency and Quarter-Over-Quarter Growth
Quarter-over-quarter growth measures the sequential increase in a business metric.
Suppose revenue grows:
15% QoQ
That sounds strong.
But if sales and marketing spending rises:
50%
to generate the increase, commercial productivity may actually deteriorate.
Growth measures the output change.
Sales efficiency relates that output to the resources required to produce it.
Sales Efficiency and Year-Over-Year Growth
Year-over-year growth can provide a more stable growth comparison when seasonality makes quarterly performance noisy.
Suppose:
YoY Revenue Growth = 25%
but sales and marketing expense grows:
60%
The company is growing, but commercial spending is increasing much faster than revenue.
Whether efficiency truly weakened depends on sales-cycle timing, investment stage, margins, and expected future revenue.
Sales Efficiency and the Rule of 40
The rule of 40 combines growth with profitability.
Sales efficiency adds another question:
How much commercial investment is required to produce that growth?
Consider two companies:
Company A:
Growth = 30%
Margin = 10%
Rule of 40:
40
Company B has the same growth and margin.
Both have the same Rule of 40 score.
But Company A may generate growth with far lower sales and marketing spending.
Its growth engine can therefore be more commercially efficient despite the identical Rule of 40 result.
Sales Efficiency and Value-Based Pricing
Value-based pricing can influence sales efficiency when stronger customer-value alignment supports higher realized pricing or better conversion.
Suppose the sales organization previously needs 100 deals at $10,000 each to generate:
$1M Revenue
After repositioning the product around measurable customer value, average deal value rises to:
$15,000
Only about:
67 Deals
are needed to generate roughly $1 million.
Higher value capture can make the sales organization more productive, assuming sales cycles and acquisition costs do not worsen disproportionately.
Sales Efficiency and Pricing Discounts
Heavy discounting can improve close rates while reducing revenue generated per deal.
Suppose:
Normal contract value:
$100,000
Sales team closes ten contracts:
$1M Revenue
A 20% discount raises closed deals to twelve:
$80,000 × 12 = $960,000
More customers are acquired, but total revenue is lower.
If sales costs also rise to close the additional deals, sales efficiency can weaken despite the higher deal count.
Sales Efficiency and Price Increases
A successful price increase percentage can improve sales efficiency by generating more revenue from the same number of sales.
Suppose:
100 Deals × $10,000 = $1M
A 10% price increase gives:
100 × $11,000 = $1.1M
If sales and marketing cost remains $500,000:
Original efficiency:
$1M ÷ $500K = 2.0
New:
$1.1M ÷ $500K = 2.2
But if higher pricing reduces close rates, the realized improvement can be smaller.
Sales Efficiency and Average Revenue Per Account
Average revenue per account can materially affect revenue generated per sales win.
Suppose:
CAC per Account = $5,000
Company A generates:
$500 Monthly ARPA
Company B:
$2,000 Monthly ARPA
Even with similar acquisition costs, Company B generates significantly more revenue from each account.
ARPA alone does not determine sales efficiency, but it strongly influences the revenue available to support commercial spending.
Sales Efficiency and Expansion Revenue
Expansion revenue can improve the productivity of an acquired customer relationship.
Suppose acquiring a customer initially produces:
$20,000 ARR
After a year, the account expands to:
$35,000 ARR
The original acquisition effort eventually supports far more recurring revenue than the initial contract value suggested.
Businesses with strong expansion economics may therefore tolerate a different initial acquisition profile from businesses where customer spending never grows.
Sales Efficiency by Acquisition Channel
Company-wide averages can conceal major differences.
Suppose:
| Channel | Incremental Revenue | S&M Cost | Efficiency |
|---|---|---|---|
| Organic | $1.0M | $250K | 4.0 |
| Paid Search | $1.5M | $750K | 2.0 |
| Events | $600K | $600K | 1.0 |
Organic appears most efficient.
But channel capacity matters.
An efficient channel that can generate only a small number of customers may not be able to support total growth targets.
Efficiency and scalability should be evaluated together.
Sales Efficiency by Customer Segment
Suppose:
Small Business:
Incremental Revenue = $1M
Sales Cost = $800K
Efficiency:
1.25
Enterprise:
Incremental Revenue = $3M
Sales Cost = $1.5M
Efficiency:
2.0
Enterprise selling appears more efficient by this revenue-based measure.
However, enterprise sales might have longer payback, greater implementation cost, or higher customer concentration.
Segment economics should be considered comprehensively.
Sales Efficiency and Sales Cycle Length
Timing can significantly distort the calculation.
Suppose a company spends heavily during Q1 but typical customers take nine months to close.
Q2 revenue may not yet reflect the value created by Q1 commercial spending.
A simple Q2 revenue-to-Q1-expense calculation can make efficiency appear poor.
Long-cycle businesses should use measurement windows that better align commercial investment with the resulting customer revenue.
Sales Efficiency and Hiring Ahead of Growth
A company may hire salespeople before those employees become fully productive.
Suppose annual sales expense increases sharply because 20 new representatives join the team.
Revenue may initially grow slowly while the representatives:
- train;
- build pipeline;
- learn the product;
- develop territories; and
- move opportunities through the sales cycle.
Short-term efficiency falls.
If the hires eventually produce substantial revenue, the investment can still be rational.
Sales Efficiency and Rep Productivity
Company-level sales efficiency can be decomposed into representative productivity.
Suppose:
20 Sales Representatives
generate:
$10M of New Revenue
Revenue per representative:
$500,000
If headcount grows to 30 while revenue rises to $12M:
Revenue per Rep = $400,000
Total revenue grows.
Per-representative productivity falls 20%.
The business should determine whether newer reps are still ramping or whether structural productivity has deteriorated.
Sales Efficiency and Conversion Rate
Higher conversion can improve efficiency by producing more customers from the same commercial pipeline.
Suppose 1,000 qualified opportunities generate:
100 Sales
Conversion:
10%
If process improvements raise conversion to:
15%
the same 1,000 opportunities generate:
150 Sales
If deal values and costs remain comparable, the company produces 50% more wins without a proportional increase in lead generation.
Sales Efficiency and Average Deal Size
Increasing average deal value can also improve efficiency.
Suppose:
100 Closed Deals × $20,000 = $2M Revenue
If the same sales effort produces:
100 Deals × $25,000 = $2.5M
incremental revenue increases 25%.
Value-based packaging, cross-selling, customer mix, and pricing can all influence deal size.
Sales Efficiency and Customer Acquisition Cost
Sales efficiency and CAC are related but not identical.
CAC asks:
What does one acquired customer cost?
Sales efficiency asks:
How much revenue or economic output does commercial spending produce?
A company can lower CAC by acquiring many small customers while generating less revenue per customer.
CAC improves while revenue-based sales efficiency may not improve proportionally.
Both customer count and customer value matter.
Improving Sales Efficiency by Reducing Costs
Suppose:
Incremental Revenue = $2M
Sales and marketing expense:
$1.5M
Efficiency:
1.33
The company improves targeting and automation, reducing cost to:
$1M
with the same revenue.
New efficiency:
2.0
Revenue does not change.
The business produces the same output with one-third less commercial spending.
Improving Sales Efficiency Through More Revenue
Suppose sales and marketing expense remains:
$1M
Incremental revenue rises:
From $1.2M to $1.8M
Original efficiency:
1.2
New efficiency:
1.8
The commercial organization produces 50% more revenue with the same expenditure.
High Sales Efficiency Does Not Always Mean Spend Less
A very high efficiency ratio can indicate that the business has room to invest more aggressively.
Suppose a company repeatedly generates:
$5 of Incremental Gross Profit
for every:
$1 of Commercial Spending
If the market has additional attractive customers available, increasing sales and marketing investment could create substantial value even if the efficiency ratio declines somewhat.
The objective is not always to maximize the ratio.
It is to allocate capital where incremental returns remain attractive.
Low Sales Efficiency Does Not Always Mean Cut Sales
Weak efficiency can result from temporary investment.
Examples include:
- entering a new market;
- building a new sales team;
- launching a new product;
- unusually long sales cycles;
- investing ahead of renewals; or
- opening a new geography.
The business should distinguish temporary ramp costs from structurally poor economics before reducing investment.
Sales Efficiency Trend Example
Suppose:
| Year | Incremental Revenue | S&M Expense | Sales Efficiency |
|---|---|---|---|
| Year 1 | $2.0M | $2.0M | 1.00 |
| Year 2 | $3.0M | $2.5M | 1.20 |
| Year 3 | $4.2M | $3.0M | 1.40 |
| Year 4 | $5.6M | $3.5M | 1.60 |
The commercial organization generates progressively more incremental revenue per dollar spent.
Management should still determine whether the improvement comes from:
higher pricing;
larger deals;
better conversion;
shorter sales cycles;
stronger retention;
greater expansion;
or improved marketing efficiency.
What Is a Good Sales Efficiency Ratio?
There is no universal ratio.
A good result depends on:
- gross margin;
- customer lifetime;
- sales cycle;
- contract size;
- customer retention;
- CAC payback;
- growth stage;
- market size;
- acquisition channel; and
- numerator definition.
A revenue efficiency ratio of 2.0 can be attractive in one business and weak in another if the underlying margins or customer lifetimes differ substantially.
The best benchmark is usually the company’s own historical trend and genuinely comparable business models.
How to Improve Sales Efficiency
Sales efficiency can improve through:
better customer targeting;
higher conversion rates;
larger economically justified deal sizes;
better sales training;
shorter sales cycles;
lower acquisition costs;
higher customer retention;
expansion revenue;
better pricing;
and reduced unproductive commercial spending.
The strongest improvements increase economic output without damaging customer fit or long-term retention.
Common Sales Efficiency Mistakes
A common mistake is using total revenue instead of incremental revenue when measuring the return on current commercial spending.
Another is failing to align sales and marketing expense with the period when resulting revenue appears.
Businesses can also compare revenue-based efficiency with gross-profit-based efficiency as though they were identical.
Another error is ignoring churn and expansion.
Companies may exclude legitimate sales and marketing expenses to make the ratio look stronger.
A high ratio can also result from underinvestment rather than optimal commercial performance.
Finally, sales efficiency should not be confused with the SaaS Magic Number, CAC payback, or LTV:CAC.
Frequently Asked Questions
What is sales efficiency in simple terms?
Sales efficiency measures how effectively sales and marketing resources generate additional revenue or economic contribution.
What is a sales efficiency formula?
A practical general formula is:
Sales Efficiency = Incremental Revenue ÷ Sales & Marketing Expense
A business may instead use incremental gross profit or recurring revenue depending on the analysis.
What does sales efficiency of 2.0 mean?
Under a revenue-based calculation, the business generated $2 of incremental revenue for every $1 of sales and marketing expense.
Is higher sales efficiency always better?
Higher efficiency generally means more output per dollar of commercial spending, but an extremely high ratio can also indicate underinvestment in profitable growth opportunities.
Is sales efficiency the same as the SaaS Magic Number?
No.
The SaaS Magic Number is a specific recurring-revenue efficiency formula. Sales efficiency is the broader concept.
Is sales efficiency the same as CAC?
No.
CAC measures acquisition cost per customer. Sales efficiency measures revenue or economic output relative to commercial spending.
How does margin affect sales efficiency?
Revenue-based efficiency can look strong even when gross margins are weak. A gross-profit-adjusted calculation can provide additional economic context.
How does revenue churn affect sales efficiency?
Churn reduces the amount of net revenue growth produced by commercial activity, forcing sales to replace lost revenue before adding net growth.
How does NRR affect sales efficiency?
Strong NRR can generate growth from existing customers, reducing dependence on new-logo acquisition and potentially improving overall commercial productivity.
How does value-based pricing affect sales efficiency?
Pricing aligned with measurable customer value can increase realized deal size or conversion quality, potentially generating more revenue from the same selling effort.
Why compare sales efficiency with year-over-year growth?
YoY growth shows how quickly the business is expanding, while sales efficiency shows how much commercial investment is required to produce that growth.
Why compare sales efficiency with Rule of 40?
The Rule of 40 measures the growth-profitability balance. Sales efficiency reveals the productivity of the commercial engine responsible for part of that growth.
Can sales efficiency improve while revenue growth slows?
Yes.
A company can generate less absolute growth but reduce sales and marketing expense even faster, improving efficiency.
Can revenue growth increase while sales efficiency falls?
Yes.
Revenue can grow faster while sales and marketing spending grows even faster.
Why is sales efficiency important?
It connects commercial investment with the revenue or contribution generated by that investment. Combined with growth, retention, margin, CAC payback, and lifetime customer economics, it helps determine whether the sales engine is producing scalable value rather than growth at any cost.