


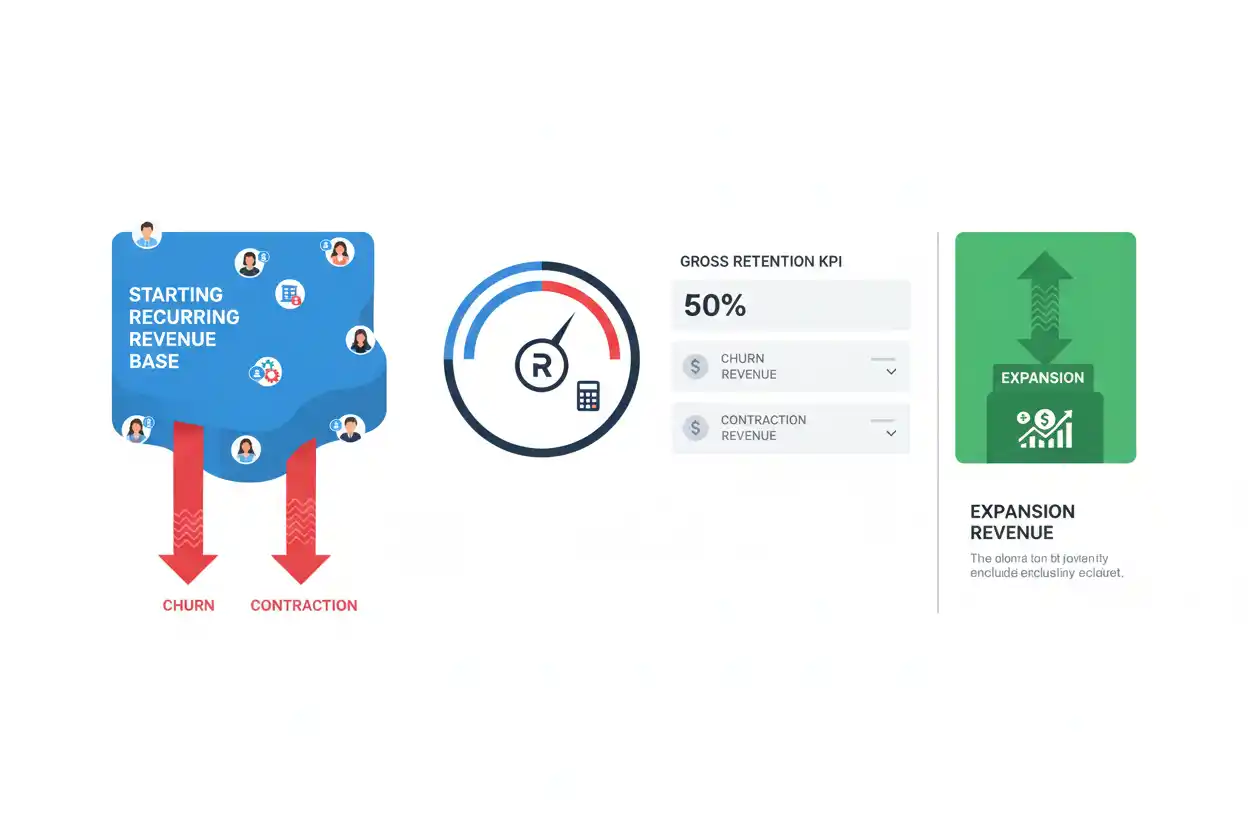
Gross revenue retention (GRR) measures the percentage of recurring revenue retained from an existing customer base after customer churn and contraction, but before adding expansion revenue.
If a business begins a period with $1,000,000 of recurring revenue, loses $50,000 from canceled customers, and loses another $30,000 from downgrades:
Gross Revenue Retention = (Starting Recurring Revenue − Churned Revenue − Contraction Revenue) ÷ Starting Recurring Revenue × 100
GRR = ($1,000,000 − $50,000 − $30,000) ÷ $1,000,000 × 100
GRR = 92%
The company retained 92% of its starting recurring revenue before considering any expansion revenue.
That exclusion is central to the metric. Expansion cannot hide revenue lost from cancellations or customer downgrades.
What Is Gross Revenue Retention?
Gross revenue retention measures how well a business preserves the recurring revenue it already has.
A company can grow by acquiring new customers, selling more to existing customers, or both. GRR deliberately ignores those growth sources and asks a narrower question:
How much of the starting recurring revenue base survived?
Suppose a company starts the year with $5 million of recurring revenue.
During the year:
Customer Cancellations Remove = $300,000
Downgrades and Contraction Remove = $200,000
Revenue retained before expansion:
$5,000,000 − $300,000 − $200,000 = $4,500,000
GRR:
$4,500,000 ÷ $5,000,000 × 100 = 90%
The business retained 90% of its starting recurring revenue.
New customers and upsells do not increase this result.
Gross Revenue Retention Formula
The standard formula is:
GRR = (Starting Recurring Revenue − Churned Revenue − Contraction Revenue) ÷ Starting Recurring Revenue × 100
Where:
Starting recurring revenue is the recurring revenue associated with the customer cohort at the beginning of the period.
Churned revenue is recurring revenue lost because starting customers completely cancel.
Contraction revenue is recurring revenue lost because retained customers downgrade, reduce usage, receive lower pricing, reduce seats, or otherwise spend less.
Expansion revenue is excluded.
The formula can also be written:
GRR = Retained Recurring Revenue Before Expansion ÷ Starting Recurring Revenue × 100
Gross Revenue Retention Example
Suppose a SaaS company begins January with:
Starting MRR = $500,000
During January:
Churned MRR = $20,000
Contraction MRR = $10,000
Revenue retained before expansion:
$500,000 − $20,000 − $10,000 = $470,000
GRR:
$470,000 ÷ $500,000 × 100
GRR = 94%
The company retained 94% of its starting monthly recurring revenue.
If the same customers also generate $50,000 of expansion, that expansion does not increase GRR.
It belongs in net revenue retention and broader recurring-growth analysis.
Why Expansion Is Excluded
Suppose:
Starting Revenue = $1,000,000
The company loses:
$150,000 through Churn and Contraction
but gains:
$250,000 through Expansion
Revenue from the starting customer base after all movements becomes:
$1,000,000 − $150,000 + $250,000 = $1,100,000
The customer base is generating more revenue than it did initially.
However, GRR is:
($1,000,000 − $150,000) ÷ $1,000,000 × 100
GRR = 85%
Expansion does not erase the fact that 15% of the original recurring revenue disappeared.
This is exactly what GRR is designed to reveal.
GRR Cannot Normally Exceed 100%
Because expansion is excluded, gross revenue retention generally has a ceiling of 100%.
If:
No Customers Churn
and:
No Customers Contract
then:
GRR = 100%
Expansion can push net revenue retention above 100%, but it does not push GRR above 100%.
A reported GRR materially above 100% usually indicates that the metric has been defined differently or expansion has been included incorrectly.
GRR vs. Net Revenue Retention
Gross and net revenue retention begin with the same starting recurring revenue base.
The difference is expansion.
GRR:
(Starting Revenue − Churn − Contraction) ÷ Starting Revenue
Net revenue retention:
(Starting Revenue − Churn − Contraction + Expansion) ÷ Starting Revenue
Suppose:
Starting Revenue = $2,000,000
Churn = $100,000
Contraction = $100,000
Expansion = $400,000
GRR:
($2M − $100K − $100K) ÷ $2M = 90%
NRR:
($2M − $100K − $100K + $400K) ÷ $2M = 110%
The company has strong expansion but still loses 10% of starting revenue before expansion.
Both numbers are useful because they expose different characteristics of the customer base.
GRR vs. Logo Retention
Logo retention measures how many customers remain.
GRR measures how much recurring revenue remains.
Suppose a company begins with 100 customers.
It loses five customers:
Logo Retention = 95%
But those five customers represent only 1% of recurring revenue:
GRR Could Remain Near 99%
Now reverse the situation.
The company loses one customer:
Logo Retention = 99%
But that enterprise customer represents 15% of revenue:
GRR Could Fall to 85%
Customer-count retention and revenue retention can therefore move very differently.
GRR vs. Customer Churn
Customer churn counts customers lost from a starting population.
GRR evaluates the recurring revenue value retained.
Suppose:
Customer Churn = 3%
That tells management that 3% of starting customers left.
It does not show whether those customers were small or large.
If the lost customers were unusually valuable, GRR could deteriorate far more than the customer-count churn rate suggests.
GRR vs. Revenue Churn
Revenue churn focuses on revenue lost.
GRR focuses on revenue retained.
If a business loses 8% of starting recurring revenue through churn and contraction:
GRR = 100% − 8%
GRR = 92%
This simple complement works when both measures use matching definitions and the same starting revenue base.
The retained percentage is often easier to compare across cohorts and periods because it expresses how much recurring value survives.
Customer Churn vs. Contraction
GRR includes both complete customer loss and partial revenue reduction.
Suppose Customer A pays:
$10,000 per Month
and cancels.
That creates:
$10,000 Churned Revenue
Customer B pays $10,000 but downgrades to $7,000:
Contraction = $3,000
Both reduce GRR.
Only the first customer creates full customer churn.
This is one reason GRR can decline even when customer retention looks strong.
Discounted Pricing Can Reduce GRR
A discounted price offered to an existing recurring customer can create contraction if the lower price reduces recurring revenue.
Suppose a customer pays:
$100,000 per Year
The company grants a permanent 20% retention discount.
New recurring value:
$80,000
Contraction:
$20,000
The customer is retained.
Logo retention remains unaffected.
But gross revenue retention is lower because the starting revenue base lost $20,000 of value.
Discount Percentage and GRR
A discount percentage should therefore be evaluated in revenue-retention terms, not only customer-count terms.
Suppose ten customers each pay $10,000 annually.
Starting recurring revenue:
$100,000
All ten customers receive a 10% permanent discount.
New revenue:
10 × $9,000 = $90,000
No customers churn.
Yet:
GRR = $90,000 ÷ $100,000 × 100 = 90%
Logo retention is 100%, while GRR is only 90%.
The company retained every customer but not every revenue dollar.
GRR and Expansion Revenue
Because expansion revenue is excluded, GRR prevents upselling from masking customer-base erosion.
Suppose:
Starting ARR = $10M
Churn + Contraction = $2M
Expansion = $3M
GRR:
($10M − $2M) ÷ $10M = 80%
Revenue after expansion:
$11M
The existing customer cohort grows overall, yet the company has lost 20% of its starting recurring revenue before expansion.
An 80% GRR may therefore deserve investigation even when headline revenue growth looks strong.
Expansion Can Produce Strong NRR With Weak GRR
Consider:
Company A:
GRR = 98%
Expansion = 5% of Starting Revenue
Simplified NRR:
103%
Company B:
GRR = 80%
Expansion = 30%
Simplified NRR:
110%
Company B has higher NRR.
Company A retains far more of its starting revenue before expansion.
Which customer base is stronger depends on the business model, expansion opportunity, concentration, profitability, and durability of both trends.
NRR should not replace GRR.
GRR and Annual Recurring Revenue
Annual recurring revenue provides the starting recurring base from which annual GRR can be measured.
Suppose:
Beginning ARR = $20M
During the year:
Churned ARR = $1M
Contraction ARR = $500K
GRR:
($20M − $1M − $0.5M) ÷ $20M
= 92.5%
Before new sales and expansion, the company retains $18.5 million of the original $20 million annual recurring base.
GRR and Monthly Recurring Revenue
The same framework can be used with monthly recurring revenue when measuring monthly retention.
Suppose:
Starting MRR = $800,000
Churned MRR = $16,000
Contraction MRR = $8,000
GRR:
($800,000 − $16,000 − $8,000) ÷ $800,000 × 100
GRR = 97%
The company retained 97% of starting MRR before expansion during the period.
GRR by Customer Segment
Company-wide GRR can conceal material variation among customer types.
Suppose:
| Segment | Starting Revenue | Revenue Lost | GRR |
|---|---|---|---|
| Small Business | $2M | $300K | 85% |
| Mid-Market | $3M | $180K | 94% |
| Enterprise | $5M | $100K | 98% |
Company-wide retained revenue:
$10M − $580K = $9.42M
Overall GRR:
$9.42M ÷ $10M = 94.2%
The headline 94.2% result hides a substantial 15% loss within the small-business segment.
Segment-level analysis makes the retention problem more actionable.
GRR by Customer Cohort
Customers acquired at different times may have different gross retention.
Suppose:
2024 customer cohort:
GRR after 12 Months = 96%
2025 cohort:
GRR after 12 Months = 92%
2026 cohort after the same tenure:
GRR = 88%
The deterioration suggests newer customer groups are retaining less recurring revenue at comparable ages.
Possible causes include different acquisition channels, pricing, product fit, onboarding, customer mix, or sales qualification.
Cohort analysis helps isolate structural changes from customer-age differences.
GRR and Customer Acquisition Quality
Poor acquisition targeting can eventually appear as weak GRR.
Suppose a company aggressively acquires customers through deep promotions.
Initial growth looks strong.
Several months later, many of those accounts cancel or downgrade because the product was not a strong fit.
GRR deteriorates.
The retention metric can therefore provide feedback on acquisition quality—not just post-sale customer-success execution.
GRR and CAC Payback
Weak GRR can make CAC payback period assumptions less reliable.
Suppose customer acquisition cost is modeled to pay back over 12 months.
If substantial revenue contracts during those 12 months, customer gross contribution may fall below the amount assumed in the static payback calculation.
A company can therefore report a reasonable initial CAC payback model while realizing much slower recovery because the customer base fails to retain its original revenue.
GRR and Lifetime Value to CAC Ratio
The lifetime value to cac ratio is also sensitive to revenue retention.
If recurring customer value erodes rapidly, expected customer lifetime value generally falls.
Suppose:
CAC = $2,000
Estimated lifetime value under strong retention:
$8,000
LTV:CAC:
4.0
If weaker retention reduces expected lifetime value to $5,000:
LTV:CAC = 2.5
The acquisition cost is unchanged.
The economics deteriorate because less customer value survives over time.
GRR and Margin
Retention quality should also be interpreted alongside margin.
Suppose Company A has 98% GRR but very low-margin recurring revenue.
Company B has 94% GRR but substantially higher margins.
Company A retains more revenue dollars.
Company B may retain more economic profit.
GRR measures recurring revenue durability, not profitability.
A high retention percentage does not prove the retained business is economically attractive.
GRR and Pricing Decisions
Price increases can affect GRR in opposing ways.
If existing customers accept the higher price, recurring revenue from the cohort can rise. Depending on the company’s metric methodology, price-driven increases may be treated as expansion rather than gross retention.
If customers respond by downgrading or canceling, contraction and churn reduce GRR.
This is why pricing changes should be evaluated through multiple metrics:
customer retention, GRR, NRR, average revenue per account, and total recurring revenue.
A price increase that raises average revenue while severely weakening GRR can create fragile growth.
GRR and Account Concentration
Gross revenue retention can be volatile when a few customers represent a large share of revenue.
Suppose:
Starting Revenue = $10M
One account contributes:
$2M
If that customer cancels:
GRR Immediately Falls to 80%
before considering any other churn or contraction.
A business with concentrated enterprise revenue may therefore experience large GRR changes from only one or two account decisions.
Logo retention can remain very high at the same time.
GRR Trend Example
Suppose annual GRR develops as follows:
| Year | GRR |
|---|---|
| Year 1 | 89% |
| Year 2 | 92% |
| Year 3 | 95% |
| Year 4 | 96% |
The company is losing progressively less recurring revenue from its starting customer base.
If starting recurring revenue were $10 million each year, gross revenue lost would move from:
Year 1:
$1.1M
to Year 4:
$400K
Improving GRR can materially reduce the amount of new acquisition and expansion required merely to replace customer-base erosion.
Why Small GRR Improvements Can Matter
Suppose a company starts with $50 million ARR.
At 90% GRR:
Gross Revenue Lost = $5M
At 94% GRR:
Gross Revenue Lost = $3M
Difference:
$2M
A four-percentage-point improvement preserves another $2 million of starting recurring revenue before expansion.
At scale, small retention improvements can have large absolute economic effects.
Can GRR Be 100% While Customers Churn?
Potentially, unusual customer-mix effects or replacement logic can create confusing internal calculations, but under a properly cohort-based GRR definition, revenue from churned starting customers is lost and therefore reduces GRR.
Expansion from retained customers should not be used to restore GRR to 100%.
If customer churn occurs but reported GRR remains exactly 100%, review whether expansion or new revenue has accidentally been included in the numerator.
Monthly GRR Should Not Be Multiplied by 12
Suppose monthly GRR is 98%.
It is incorrect to calculate:
98% × 12
Retention percentages do not work that way.
If a hypothetical cohort retained exactly 98% of its remaining revenue every month under a constant compounding model:
Annual Retained Proportion ≈ 0.98¹²
≈ 78.47%
This is only an illustrative compounding exercise. Actual annual GRR should preferably be measured directly from the annual starting cohort because monthly customer movements and cohort composition can vary.
What Is a Good Gross Revenue Retention Rate?
There is no universal target.
An appropriate GRR depends on customer segment, contract structure, pricing, industry, customer maturity, product type, switching costs, and natural customer lifecycle.
A high-contract-value enterprise business may expect different retention economics from a low-price consumer subscription.
The most useful comparisons are usually:
- the company’s own historical performance;
- comparable customer cohorts;
- similar customer segments; and
- genuinely comparable businesses.
The direction of the trend is often as important as the absolute percentage.
How to Improve Gross Revenue Retention
GRR improves when fewer customers cancel and retained customers reduce their spending less frequently.
That can come from stronger onboarding, better product reliability, clearer customer value, improved customer support, better account management, more accurate customer targeting, appropriate pricing, better renewal processes, or resolving usage and adoption problems before renewal.
The cause of revenue loss matters.
A customer canceling because the product is unreliable requires a different response from one downgrading because it purchased too many seats initially.
Common Gross Revenue Retention Mistakes
A common mistake is adding expansion revenue to GRR.
Another is including new-customer revenue in the numerator.
Businesses can also confuse customer-count retention with revenue retention.
Another error is ignoring downgrades and counting only full customer cancellations.
Companies sometimes compare monthly GRR with annual GRR as though the time periods are identical.
Permanent discounts can also create contraction even when no customer leaves.
Finally, a strong GRR does not by itself prove high profitability, strong growth, or efficient customer acquisition.
Frequently Asked Questions
What is gross revenue retention in simple terms?
Gross revenue retention measures the percentage of starting recurring revenue that remains after customer churn and contraction, excluding expansion.
What is the gross revenue retention formula?
GRR = (Starting Recurring Revenue − Churned Revenue − Contraction Revenue) ÷ Starting Recurring Revenue × 100
What is an example of GRR?
If starting recurring revenue is $1 million, churn is $50,000, and contraction is $30,000:
GRR = ($1M − $50K − $30K) ÷ $1M = 92%
Is expansion revenue included in GRR?
No.
Expansion is specifically excluded so that upsells cannot hide churn and contraction.
Can gross revenue retention exceed 100%?
Under the standard definition, no. With no churn or contraction, GRR reaches 100%.
What is the difference between GRR and NRR?
GRR excludes expansion.
NRR includes expansion.
What is the difference between GRR and logo retention?
GRR measures revenue retained.
Logo retention measures customers or accounts retained.
Can logo retention be high while GRR is low?
Yes.
Losing only a few large customers can produce high logo retention but a substantial revenue loss.
Do downgrades reduce GRR?
Yes.
Recurring revenue lost through customer contraction reduces gross revenue retention even when the customer remains active.
Do discounts reduce GRR?
They can when a permanent or qualifying discount reduces recurring revenue from the starting customer cohort.
Does new customer revenue improve GRR?
No.
New customers are outside the starting cohort and should not increase gross revenue retention.
Why is GRR important for CAC economics?
Weak revenue retention can reduce the contribution customers generate after acquisition, lengthening realized CAC payback and reducing lifetime value.
Is 100% GRR the same as zero customer churn?
Not necessarily in every internal reporting structure, but under a clean cohort-based definition, lost customer recurring revenue should reduce GRR. A 100% result means no starting recurring revenue was lost through churn or contraction.
Why track GRR with NRR?
GRR shows how well the original revenue base survives. NRR shows the result after expansion is added. Together they distinguish customer-base durability from growth within retained accounts.




