


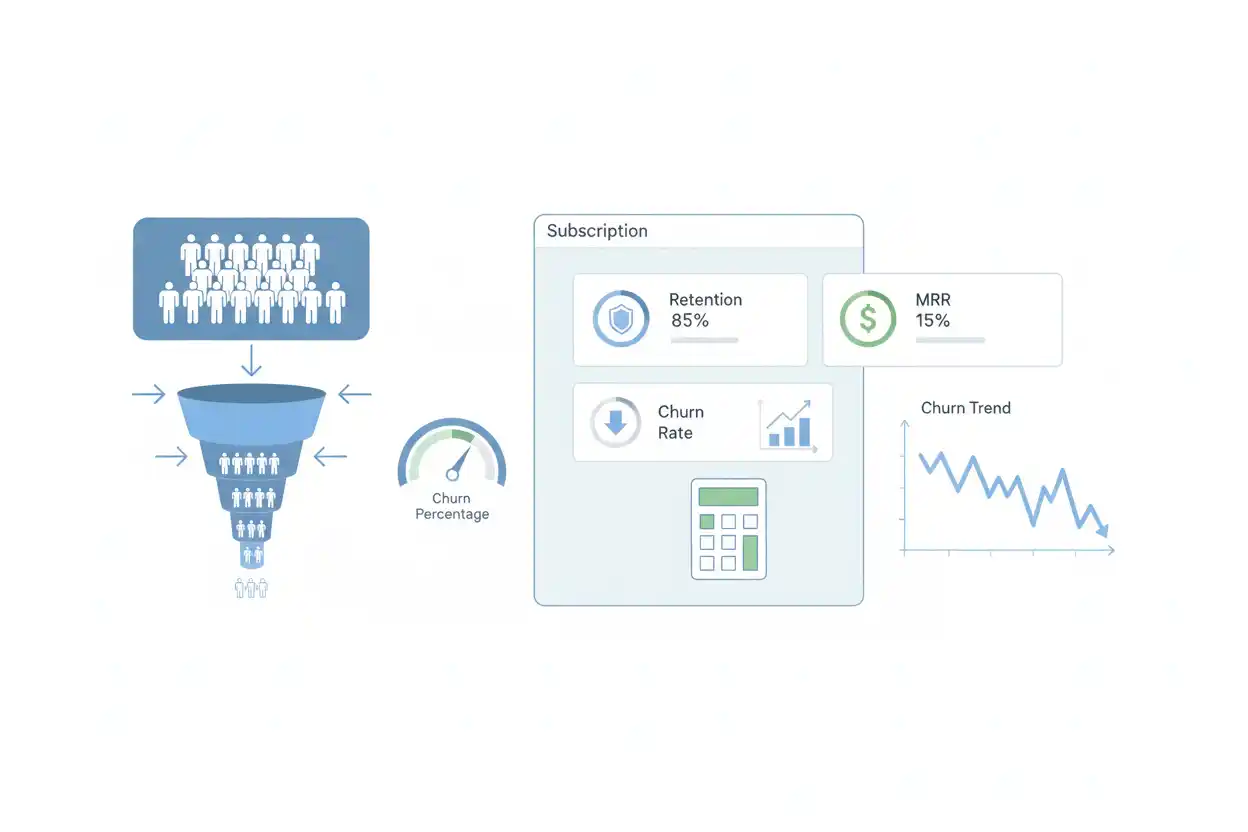
Customer churn measures the percentage of customers who stop doing business with a company during a defined period.
If a subscription business starts a month with 2,000 customers and 80 of those customers cancel during the month, customer churn is 4%.
Customer Churn Rate = Customers Lost During Period ÷ Customers at Start of Period × 100
Customer Churn Rate = 80 ÷ 2,000 × 100 = 4%
Customer churn focuses on the number of customers lost, not the amount of revenue lost. A company can therefore have relatively low customer churn but severe revenue churn if a small number of large accounts cancel.
What Is Customer Churn?
Customer churn describes attrition within an existing customer base.
Suppose a company begins a quarter with 5,000 customers.
During the quarter, 250 of those starting customers cancel or otherwise cease to be customers under the company’s churn definition.
Customer Churn = 250 ÷ 5,000 × 100
Customer Churn = 5%
The company lost 5% of the customers it had at the beginning of the period.
New customers acquired during the quarter generally should not be added to the starting denominator when the objective is to measure how much of the opening customer cohort churned.
That keeps acquisition and retention analytically separate.
Customer Churn Formula
The standard customer-count formula is:
Customer Churn Rate = Customers Lost During Period ÷ Customers at Beginning of Period × 100
Where:
Customers lost are customers from the starting population who cancel or otherwise meet the defined churn condition during the period.
Beginning customers are the customers active at the start of that same period.
If 40 of 800 starting customers leave:
40 ÷ 800 × 100 = 5%
Customer churn is 5%.
The corresponding simple customer retention rate is:
Customer Retention Rate = 100% − Customer Churn Rate
when the same population definition is used and no additional complications alter the cohort logic.
In this example:
Retention Rate = 100% − 5% = 95%
Customer Churn Example
Suppose a software company begins January with:
1,200 Customers
During January:
36 Starting Customers Cancel
It also acquires:
100 New Customers
Customer churn is based on the 36 lost customers and the 1,200 customers at the beginning:
Customer Churn = 36 ÷ 1,200 × 100
Customer Churn = 3%
The 100 new customers do not reduce the churn rate.
Ending customer count, assuming no other changes, is:
1,200 − 36 + 100 = 1,264 Customers
The company grew its customer base despite experiencing 3% churn.
This is why customer growth and customer churn need to be measured separately.
Customer Churn vs. Customer Growth
A business can grow while losing customers.
Suppose:
Beginning Customers = 10,000
Customers Lost = 500
New Customers = 1,500
Customer churn:
500 ÷ 10,000 × 100 = 5%
Ending customers:
10,000 − 500 + 1,500 = 11,000
Net customer growth:
11,000 − 10,000 = 1,000
or:
1,000 ÷ 10,000 × 100 = 10%
The business grew its customer base 10% while churning 5% of the starting cohort.
Strong acquisition can therefore temporarily conceal weak retention.
Customer Churn vs. Revenue Churn
Customer churn counts lost customers.
Revenue churn measures lost revenue.
Suppose a company has 100 customers:
- 90 small customers worth $100 per month each;
- 10 enterprise customers worth $5,000 per month each.
Total monthly revenue is:
(90 × $100) + (10 × $5,000)
$9,000 + $50,000 = $59,000
If one enterprise customer cancels:
Customer churn:
1 ÷ 100 × 100 = 1%
Revenue lost:
$5,000
Revenue churn relative to the starting $59,000 is:
$5,000 ÷ $59,000 × 100 ≈ 8.47%
Only 1% of customers churned, but approximately 8.47% of starting monthly revenue disappeared.
Customer-count and revenue-based attrition can therefore tell very different stories.
Customer Churn vs. Logo Retention
Logo retention measures the percentage of customers or accounts retained from a starting cohort.
Under a simple matching definition:
Logo Retention = 100% − Customer Churn
If customer churn is 4%:
Logo Retention = 96%
The two measures approach the same customer population from opposite directions.
Customer churn focuses on what was lost.
Logo retention focuses on what remained.
Keeping dedicated metrics can make dashboards easier to interpret, particularly when the company also tracks revenue retention separately.
Customer Churn vs. Gross Revenue Retention
Gross revenue retention tracks how much starting recurring revenue remains after churn and contraction, excluding expansion.
Customer churn can remain low even while GRR weakens.
Suppose only 2% of customers cancel, but several large accounts downgrade substantially.
Customer-count churn remains 2%.
Gross revenue retention can fall because the surviving customer base is paying less.
Customer churn therefore measures relationship loss by count, while GRR measures revenue preservation.
Customer Churn vs. Net Revenue Retention
Net revenue retention includes expansion from existing customers.
Suppose a company starts with $1 million of recurring revenue.
During the period:
Churn and Contraction = $100,000
Expansion = $180,000
Ending revenue from the starting cohort:
$1,000,000 − $100,000 + $180,000 = $1,080,000
NRR:
108%
The company can have positive customer churn while NRR exceeds 100% because retained customers expand enough to offset lost revenue.
A strong NRR therefore does not mean churn is zero.
Monthly Customer Churn
Suppose a company starts March with 4,000 customers.
During March, 120 leave.
Monthly Churn = 120 ÷ 4,000 × 100
Monthly Churn = 3%
The monthly retention rate under the same simple definition is:
97%
Monthly churn is useful for businesses where customer relationships can change quickly.
However, one month’s result can be noisy because of promotions, contract renewal dates, seasonality, billing issues, or product incidents.
Quarterly Customer Churn
Suppose a company begins a quarter with 8,000 customers and loses 480 of those customers over the three months.
Quarterly Customer Churn = 480 ÷ 8,000 × 100
Quarterly Customer Churn = 6%
This is not the same as automatically multiplying a monthly churn rate by three.
Churn compounds because the customer base changes over time.
If monthly churn is consistently 2%, the three-month retained proportion is approximately:
0.98³ ≈ 0.9412
Three-month churn is therefore approximately:
1 − 0.9412 = 5.88%
not exactly 6%.
Annualizing Monthly Churn
A common mistake is multiplying monthly churn by 12.
Suppose monthly churn is 3%.
Simple multiplication gives:
3% × 12 = 36%
But if 3% of the remaining customers churn each month, annual retention is:
0.97¹² ≈ 69.38%
Annual churn implied by constant monthly compounding is:
1 − 0.6938 ≈ 30.62%
The difference is material.
A monthly rate should therefore be compounded when estimating a full-year retention outcome.
Churn and Average Customer Lifetime
Under a highly simplified constant-churn model, approximate customer lifetime can sometimes be estimated as:
Approximate Customer Lifetime = 1 ÷ Churn Rate
If monthly churn is 5%:
1 ÷ 0.05 = 20 Months
This shortcut assumes a stable churn process and should not replace cohort analysis.
Real customer populations often have different churn behavior by tenure, plan, geography, acquisition channel, contract term, and customer segment.
Example of Churn Improvement
Suppose monthly customer churn declines from 5% to 3%.
Relative reduction:
(5% − 3%) ÷ 5% × 100 = 40%
Churn improved by 2 percentage points, or 40% relative to its prior level.
For a starting population of 10,000 customers:
At 5% churn:
Customers Lost = 500
At 3% churn:
Customers Lost = 300
Difference:
200 Fewer Customers Lost per Month
Retention improvements can therefore create meaningful growth even without increasing acquisition.
Churn and New Customer Acquisition
Suppose a company begins each month with roughly 10,000 customers.
At 5% monthly churn, it loses approximately:
500 Customers
It must acquire approximately 500 new customers simply to replace those losses before achieving net customer growth.
If churn falls to 2%:
Customers Lost = 200
The company needs only about 200 new customers to replace churn.
The same acquisition engine can now produce more net growth.
Reducing churn can therefore be economically similar to improving acquisition efficiency.
Customer Churn and CAC Payback Period
High churn is particularly dangerous when the CAC payback period is long.
Suppose:
CAC Payback = 12 Months
but a meaningful share of acquired customers leave before Month 12.
Those customers may never generate enough contribution to recover their acquisition cost.
For example:
CAC = $1,200
Monthly Gross Profit per Customer = $100
Modeled payback:
12 Months
If a customer churns after Month 7:
Cumulative Gross Profit = 7 × $100 = $700
Unrecovered CAC:
$1,200 − $700 = $500
Retention quality directly affects whether modeled acquisition economics are actually realized.
Customer Churn and Lifetime Value to CAC
The lifetime value to CAC ratio is also highly sensitive to retention.
If customers stay longer, they have more opportunity to generate gross profit and expansion revenue.
If churn rises, estimated lifetime value generally falls, all else equal.
Suppose CAC remains $500.
At estimated lifetime value of $2,000:
LTV:CAC = 4.0
If worsening churn reduces expected lifetime value to $1,000:
LTV:CAC = 2.0
Acquisition cost did not change, yet customer economics weakened substantially.
Customer Churn and Average Revenue Per User
Average revenue per user can rise even when customer churn worsens.
Suppose a platform loses many low-value users.
Before:
100,000 Users
Revenue = $1,000,000
ARPU:
$10
After:
80,000 Users
Revenue = $900,000
ARPU:
$11.25
Revenue falls 10%, users fall 20%, and ARPU rises 12.5%.
Higher ARPU does not prove retention is improving.
Customer Churn and Average Revenue Per Account
The same effect can occur with average revenue per account.
If low-value accounts churn while enterprise customers remain, ARPA can increase.
This can produce a misleading dashboard if management sees rising ARPA without examining the shrinking account base.
A strong monetization metric should be analyzed alongside customer retention and total recurring revenue.
Pricing and Customer Churn
Pricing decisions can affect customer churn.
Suppose 5,000 customers pay $20 monthly.
The company increases price to $25.
If all customers remain:
Revenue = 5,000 × $25 = $125,000
compared with:
5,000 × $20 = $100,000
Revenue increases 25%.
But suppose 1,200 customers cancel after the change.
Remaining customers:
3,800
New revenue:
3,800 × $25 = $95,000
The higher price produces lower total revenue because churn more than offsets the additional amount per retained customer.
Discounting and Customer Churn
A discount percentage can sometimes reduce near-term churn by making the product more affordable.
Suppose customers threatening to cancel are offered a temporary 20% discount.
Some may remain.
However, the discount lowers revenue per retained customer and can delay the underlying cancellation rather than solve the reason customers want to leave.
Discount-based retention should therefore be measured through both:
customers saved, and
economic value preserved after the discount.
A retention strategy that saves every customer at an unprofitable price is not automatically successful.
Discounted Price and Churn
The final discounted price matters because customers respond to the amount they actually pay, not merely the percentage reduction.
Suppose Product A costs $1,000 and receives a 10% discount:
Discounted Price = $900
Product B costs $100 and receives a 30% discount:
Discounted Price = $70
The larger discount percentage does not necessarily represent the stronger retention incentive in absolute dollar terms.
Customer price sensitivity depends on value, alternatives, budget, switching costs, and product importance.
Break-Even Price and Retention Offers
Retention discounts should also be checked against break-even price.
Suppose a service normally costs $100 monthly.
Break-even price under the relevant assumptions is $70.
A retention discount lowers the customer price to $80.
The account remains above the simplified break-even threshold.
Reducing the price to $60 may retain the customer but leave the account below break-even.
The correct retention decision therefore depends on customer lifetime, service cost, capacity, and strategic value—not just whether the customer agrees to stay.
Churn and Expansion Revenue
Expansion revenue can offset some revenue losses from churn, but it does not replace the lost customer count.
Suppose 10 customers churn, reducing recurring revenue by $50,000.
Remaining accounts expand by $80,000.
Net recurring revenue movement:
+$30,000
The company has positive revenue growth from its existing base despite losing customers.
That can be economically attractive, but management should still understand why customers are leaving.
Persistent customer churn can eventually narrow the pool available for future expansion.
Churn by Customer Segment
Company-wide churn can hide substantial variation.
Suppose:
| Segment | Starting Customers | Lost Customers | Churn |
|---|---|---|---|
| Small Business | 5,000 | 400 | 8% |
| Mid-Market | 1,000 | 30 | 3% |
| Enterprise | 200 | 2 | 1% |
Total starting customers:
6,200
Total lost:
432
Overall churn:
432 ÷ 6,200 × 100 ≈ 6.97%
The company-wide 6.97% result hides a much more serious retention problem among small-business customers.
Segment analysis can reveal where intervention is most valuable.
Churn by Acquisition Channel
Customer churn can also vary by acquisition source.
Suppose:
Paid social customers:
Monthly Churn = 8%
Organic search customers:
Monthly Churn = 3%
Partner referrals:
Monthly Churn = 2%
A channel that produces inexpensive acquisitions may not actually have the strongest economics if those customers leave rapidly.
CAC and churn should therefore be analyzed together by cohort whenever possible.
Churn by Customer Tenure
New customers may churn at a different rate from long-established customers.
Suppose:
First three months:
Monthly Churn = 7%
Customers older than one year:
Monthly Churn = 1%
A company-wide average can conceal a severe onboarding problem.
If new customers fail before experiencing the core product value, improving onboarding may produce a larger retention benefit than changing long-term loyalty programs.
Voluntary vs. Involuntary Churn
Not every customer leaves because they deliberately choose a competitor.
Voluntary churn can result from dissatisfaction, poor value, pricing, lack of product fit, or changing needs.
Involuntary churn can result from failed payments, expired cards, administrative issues, or billing errors.
The solutions differ.
Better product experience may reduce voluntary churn.
Payment retries, card-updating systems, and clearer billing processes may reduce involuntary churn.
Combining both into one headline rate is useful for scale but insufficient for diagnosis.
Churn From Failed Payments
Suppose a subscription company loses 100 customers in a month.
Investigation finds:
60 Voluntary Cancellations
40 Failed-Payment Losses
Total churn is still based on all 100 lost customers if both categories meet the company’s churn definition.
But 40% of the lost customers may be recoverable through billing improvements rather than product changes.
Operational segmentation makes the churn metric actionable.
Cohort Churn
A cohort groups customers by acquisition date or another common characteristic.
Suppose 1,000 customers acquired in January remain as follows:
| Month | Customers Remaining |
|---|---|
| Start | 1,000 |
| Month 1 | 950 |
| Month 2 | 900 |
| Month 3 | 860 |
| Month 6 | 780 |
Six-month retention is:
780 ÷ 1,000 × 100 = 78%
Cumulative six-month churn is:
22%
Cohort analysis reveals when customers are being lost rather than compressing every customer age into one company-wide rate.
Customer Churn Trend Example
Suppose monthly churn is:
| Month | Churn |
|---|---|
| January | 5.0% |
| February | 4.6% |
| March | 4.1% |
| April | 3.5% |
| May | 3.0% |
Churn declines by:
5.0% − 3.0% = 2 Percentage Points
Relative improvement:
2 ÷ 5 × 100 = 40%
The trend is materially positive.
Management should still determine whether improvement comes from product changes, customer mix, annual contracts, discounts, seasonality, or another factor.
High Churn Does Not Always Mean the Product Is Bad
Churn can reflect:
- short natural customer lifecycles;
- seasonal use;
- customer business closures;
- one-time project needs;
- deliberate removal of unprofitable customers;
- changes in customer mix; or
- weak acquisition targeting.
For a service customers need only temporarily, some churn is structurally inevitable.
Benchmarking should therefore use comparable business models rather than a universal target.
Low Churn Does Not Always Mean Strong Economics
A company can retain nearly every customer at a price too low to earn an adequate return.
Suppose customer churn is only 1%, but customers pay below the relevant cost to serve.
Retention is excellent.
Economics are not.
Low churn needs to be combined with monetization, margin, acquisition cost, and expansion to understand whether retained relationships create value.
What Is a Good Customer Churn Rate?
There is no universal good churn rate.
Appropriate levels depend on customer type, contract length, price, industry, product category, customer lifetime, business maturity, and whether the measurement is monthly or annual.
A monthly churn rate and annual churn rate should never be compared directly without converting them to a consistent time basis.
The most useful comparisons are usually:
- the company’s own historical cohorts;
- similar customer segments;
- acquisition channels;
- contract types; and
- genuinely comparable businesses.
How to Reduce Customer Churn
Churn reduction begins with identifying why customers leave.
Useful interventions can include better onboarding, faster time to value, improved reliability, clearer pricing, responsive support, product improvements, stronger customer-success processes, billing recovery, better customer targeting, and proactive renewal management.
The correct intervention should match the diagnosed cause.
Discounting every cancellation request is rarely a complete retention strategy.
Common Customer Churn Mistakes
A common mistake is dividing customers lost by ending customer count rather than the starting cohort.
Another is subtracting new acquisitions from churn.
Businesses can also confuse customer churn with revenue churn.
Another error is comparing monthly churn with annual churn without adjusting for compounding.
A rising ARPA or ARPU can hide churn when low-value customers leave.
Companies may also combine voluntary and involuntary churn without investigating their different causes.
Finally, a low churn percentage should not be treated as proof that customer economics are healthy.
Frequently Asked Questions
What is customer churn in simple terms?
Customer churn is the percentage of customers from a starting population who stop being customers during a defined period.
What is the customer churn formula?
Customer Churn Rate = Customers Lost During Period ÷ Customers at Start of Period × 100
How do you calculate customer churn?
If a company starts with 1,000 customers and loses 40:
40 ÷ 1,000 × 100 = 4%
Customer churn is 4%.
Do new customers reduce customer churn?
No.
New acquisition changes ending customer count but should not normally reduce the percentage of the starting customer cohort that churned.
Is customer churn the same as revenue churn?
No.
Customer churn measures lost customers.
Revenue churn measures lost revenue.
Is churn the opposite of retention?
Under a simple matching customer-count definition:
Retention = 100% − Churn
The precise relationship depends on using the same cohort and measurement rules.
Can a company grow while customer churn is high?
Yes.
Strong acquisition can add more customers than churn removes, producing net growth despite weak retention.
Can ARPA rise while churn worsens?
Yes.
If lower-value accounts leave, average revenue among remaining accounts can increase.
How does churn affect CAC payback?
Customers who leave before reaching the payback point may fail to generate enough contribution to recover their acquisition cost.
How does churn affect LTV:CAC?
Higher churn generally shortens customer lifetime and can reduce lifetime value, weakening the ratio if other factors remain unchanged.
Can discounts reduce churn?
They can in some cases, but the resulting lower customer revenue and margin must be considered. Discounts also may not address the underlying reason the customer wants to leave.
What is involuntary churn?
Involuntary churn occurs when customers are lost because of failed payments or similar operational issues rather than a deliberate cancellation decision.
What is cohort churn?
Cohort churn tracks losses among customers who share a common starting point, such as the month they were acquired.
Why is monthly churn not simply multiplied by 12?
Because churn compounds on the remaining customer base. A constant monthly churn rate should be compounded to estimate annual retention or churn.
Why is customer churn important?
Customer churn shows how much of the customer base the business is losing. Combined with acquisition, monetization, revenue retention, and CAC economics, it helps determine whether growth is durable or continually replacing customers who leave.




