


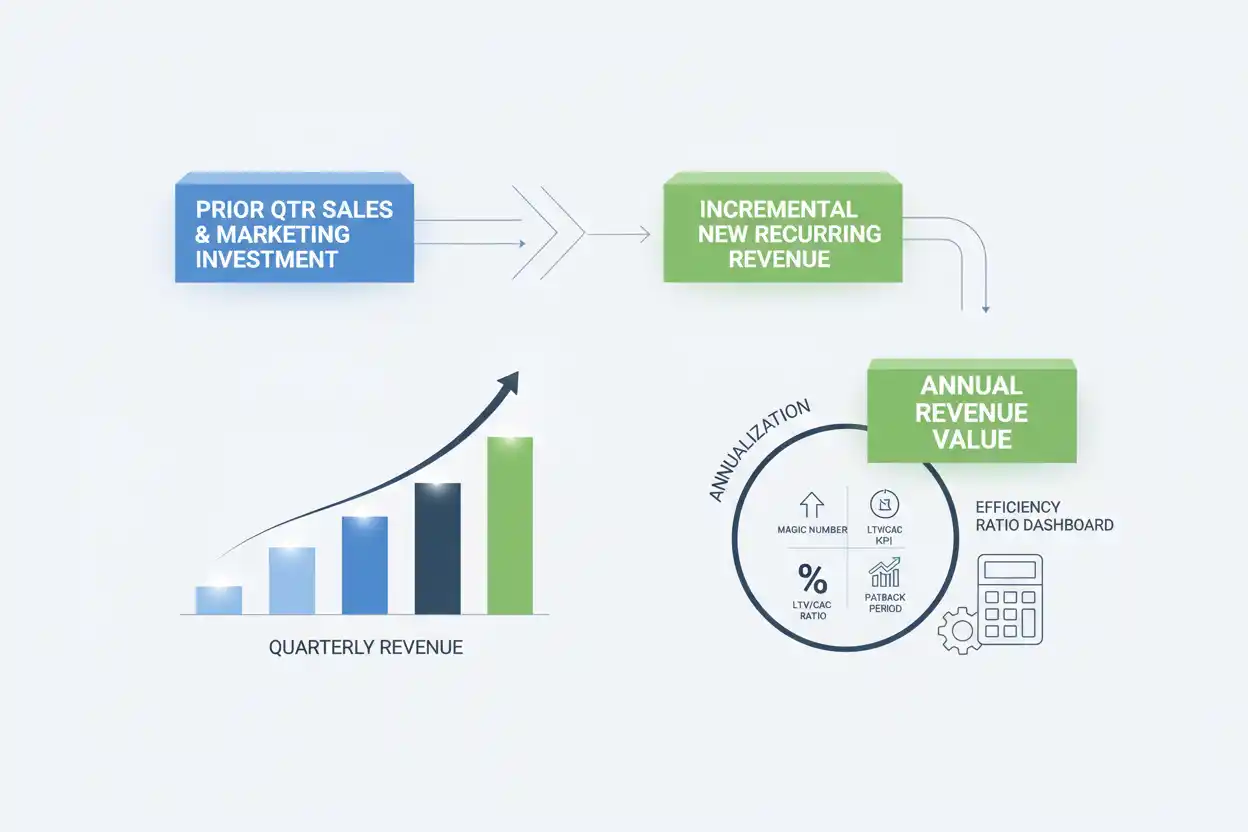
The Magic Number SaaS metric measures how efficiently a SaaS company converts sales and marketing spending into incremental recurring revenue.
A common quarterly version compares the increase in recurring revenue from one quarter to the next, annualizes that increase, and divides it by the prior quarter’s sales and marketing expense.
SaaS Magic Number = (Current Quarter Recurring Revenue − Previous Quarter Recurring Revenue) × 4 ÷ Previous Quarter Sales & Marketing Expense
Suppose quarterly recurring revenue increases from $1.2 million to $1.4 million and the company spent $400,000 on sales and marketing in the previous quarter.
Revenue increase:
$1.4M − $1.2M = $200,000
Annualized:
$200,000 × 4 = $800,000
Magic Number:
$800,000 ÷ $400,000 = 2.0
The company generated $2 of annualized incremental recurring revenue for each $1 of prior-quarter sales and marketing expense under this version of the calculation.
The formula is simple, but interpretation requires care because revenue definitions, gross margins, customer retention, timing, and sales cycles can materially affect the result.
What Is the SaaS Magic Number?
The SaaS Magic Number is a sales-efficiency metric.
It asks:
How much annualized incremental recurring revenue is the company generating relative to the sales and marketing investment associated with creating that growth?
Suppose two companies each spend $1 million on sales and marketing.
Company A generates $250,000 of quarterly incremental recurring revenue.
Annualized:
$250,000 × 4 = $1,000,000
Magic Number:
1.0
Company B generates only $100,000 of quarterly incremental recurring revenue.
Annualized:
$400,000
Magic Number:
0.4
Company A is generating much more incremental recurring revenue relative to the same sales and marketing expenditure.
That does not automatically make Company A more profitable. The Magic Number focuses on commercial efficiency rather than total company economics.
Magic Number SaaS Formula
A common quarterly formula is:
Magic Number = (Current Quarter Recurring Revenue − Previous Quarter Recurring Revenue) × 4 ÷ Previous Quarter Sales & Marketing Expense
Using symbols:
Magic Number = Δ Quarterly Recurring Revenue × 4 ÷ Prior-Quarter S&M
The factor of four annualizes the quarter-over-quarter revenue increase.
The denominator commonly uses the previous quarter’s sales and marketing expense because commercial spending often precedes the recurring revenue growth it helps produce.
Companies should apply one methodology consistently because variations exist in how recurring revenue and sales-and-marketing expense are defined.
Magic Number Example
Suppose:
Q1 Recurring Revenue = $2,000,000
Q2 Recurring Revenue = $2,300,000
Q1 Sales & Marketing Expense = $600,000
Quarter-over-quarter recurring revenue increase:
$2,300,000 − $2,000,000 = $300,000
Annualized increase:
$300,000 × 4 = $1,200,000
Magic Number:
$1,200,000 ÷ $600,000
Magic Number = 2.0
Under the model, every $1 of Q1 sales and marketing expense corresponds to $2 of annualized incremental recurring revenue reflected in the Q2 increase.
Why Multiply by Four?
The calculation typically uses a quarter-over-quarter revenue difference.
A quarter represents approximately one-fourth of a year.
Multiplying by four annualizes the incremental quarterly amount:
Quarterly Increment × 4 = Annualized Increment
If incremental recurring revenue is:
$150,000 for the Quarter
Annualized:
$150,000 × 4 = $600,000
The annualization does not guarantee the company will actually add another $600,000 over the next year.
It simply puts the quarterly recurring-revenue increase on an annual scale for comparison with sales and marketing expenditure.
Why Use Prior-Quarter Sales and Marketing Expense?
Sales and marketing investment often affects revenue with a delay.
A company spends on:
- advertising;
- sales salaries;
- commissions;
- demand generation;
- business development;
- events;
- marketing systems; and
- other customer-acquisition activities
before all resulting recurring revenue appears.
Using the prior quarter attempts to align acquisition investment with subsequent revenue growth.
The alignment is still imperfect when the sales cycle is much shorter or much longer than one quarter.
Example With a Longer Sales Cycle
Suppose an enterprise SaaS company has an average sales cycle of nine months.
Sales and marketing spending in Q1 may not produce meaningful recurring revenue until Q3 or Q4.
Comparing Q2 revenue growth only with Q1 sales and marketing can therefore understate the productivity of Q1 spending.
The Magic Number remains useful as a standardized indicator, but companies with long sales cycles should supplement it with cohort, pipeline, and customer-acquisition analysis.
Example With a Very Short Sales Cycle
A self-service SaaS product may convert users within hours or days.
In that model, much of the current quarter’s sales and marketing spending can influence revenue during the same quarter.
A strict prior-quarter denominator can introduce timing noise.
Consistency across periods is still important because frequently changing the denominator convention can make the trend impossible to interpret.
Magic Number Using Annual Recurring Revenue
Some internal implementations begin with changes in annual recurring revenue rather than quarterly recurring revenue.
When the numerator is already an annualized ARR change, multiplying by four again would generally double-annualize the result.
For example, suppose ARR increases from:
$10M to $11M
ARR increase:
$1M
If the relevant prior sales and marketing expenditure is $500,000:
ARR-Based Efficiency Ratio = $1M ÷ $500K = 2.0
The important point is to understand whether the revenue input is already annualized.
A formula designed for quarterly recurring-revenue changes should not be applied mechanically to ARR without adjusting the methodology.
Magic Number and Monthly Recurring Revenue
Monthly recurring revenue can also be translated into an annualized revenue change.
Suppose MRR grows from:
$500,000 to $550,000
Increase:
$50,000 MRR
Annualized increase:
$50,000 × 12 = $600,000
If the aligned sales and marketing expenditure is $300,000:
Efficiency Ratio = $600,000 ÷ $300,000 = 2.0
This resembles the economic purpose of the Magic Number, although companies should avoid mixing monthly, quarterly, and annual formulas without clearly defining timing.
Magic Number vs. Sales Efficiency
Sales efficiency is the broader concept of how effectively commercial spending creates new revenue or contribution.
The SaaS Magic Number is one specific formula within that broader area.
A company might also analyze:
- CAC;
- CAC payback;
- new ARR per sales representative;
- pipeline conversion;
- sales productivity;
- marketing efficiency; or
- gross-margin-adjusted acquisition efficiency.
The Magic Number provides a standardized high-level indicator rather than replacing all commercial analysis.
Magic Number vs. CAC Payback
The CAC payback period measures how long customer gross contribution takes to recover acquisition cost.
The Magic Number compares revenue growth with sales and marketing spending.
Consider:
Company A:
Magic Number = 1.5
but:
Gross Margin = 30%
Company B:
Magic Number = 1.0
but:
Gross Margin = 85%
Company A creates more incremental revenue per marketing dollar.
Company B may recover acquisition cost faster because much more of each revenue dollar becomes gross profit.
Revenue efficiency and contribution payback are different concepts.
Why Margin Matters
The Magic Number numerator is usually revenue-based.
Margin therefore matters when interpreting the resulting economic return.
Suppose two companies each show:
Magic Number = 1.0
Company A has:
Gross Margin = 90%
Company B:
Gross Margin = 40%
For every $1 of annualized incremental revenue, Company A retains much more gross profit after cost of revenue.
Identical Magic Numbers can therefore correspond to very different underlying economics.
Gross-Margin-Adjusted Interpretation
Suppose incremental annualized revenue is:
$1,000,000
Sales and marketing expense:
$500,000
Magic Number:
2.0
If gross margin is 80%, incremental annualized gross profit is approximately:
$1,000,000 × 80% = $800,000
Gross-profit amount relative to S&M:
$800,000 ÷ $500,000 = 1.6
This does not replace the standard Magic Number formula, but it illustrates how margin can materially change economic interpretation.
Magic Number and Lifetime Value to CAC
The lifetime value to cac ratio estimates total customer value relative to acquisition cost.
The Magic Number focuses more directly on current commercial efficiency.
A business can have:
Strong LTV:CAC
because customers remain for many years,
but:
Weak Magic Number
because current sales and marketing spending is producing incremental revenue inefficiently.
The reverse can also occur.
A company may acquire revenue efficiently today but have weak lifetime economics because customers churn quickly.
Both short-term acquisition productivity and long-term customer value matter.
Magic Number and Logo Retention
Logo retention can strongly influence recurring-revenue growth.
Suppose a company adds:
$1 Million of New Recurring Revenue
but loses:
$900,000 from Customer Churn and Contraction
Net recurring growth is only:
$100,000
The Magic Number based on net revenue growth can look weak even if new-customer acquisition itself performed well.
Poor retention can therefore depress the metric.
A low Magic Number is not always solely a sales-team problem.
Magic Number and Gross Revenue Retention
Gross revenue retention provides further context by showing how much starting revenue survives before expansion.
Suppose two companies each spend the same amount on sales and marketing and acquire equal new recurring revenue.
Company A has:
GRR = 98%
Company B:
GRR = 80%
Company B loses much more starting revenue.
Its net recurring growth—and therefore its Magic Number—can be far weaker even though gross new sales performance is similar.
Revenue retention is part of the overall growth engine.
Magic Number and Expansion Revenue
Expansion revenue can improve the Magic Number because recurring revenue can grow from existing customers as well as new customers.
Suppose during a quarter:
New Customer ARR Added = $400,000
Expansion ARR = $300,000
Churn and Contraction = $200,000
Net ARR growth:
$500,000
The company achieves substantial net growth partly through expansion.
If customer-success or account-management costs responsible for the expansion are not classified inside sales and marketing consistently, the Magic Number can overstate the efficiency of the commercial engine.
Expense classification therefore matters.
Expansion-Led Magic Number
A company with strong net revenue retention can generate recurring revenue growth without proportionally increasing new-customer acquisition spending.
For example:
Beginning ARR = $20M
Existing customers generate net expansion of:
$2M
New customers add:
$1M
Total ARR growth:
$3M
The Magic Number can appear extremely strong because part of the revenue growth comes from previously acquired customers.
That may be economically excellent, but management should understand how much growth comes from new acquisition versus expansion.
Magic Number and Revenue Churn
High revenue churn can depress incremental recurring revenue.
Suppose a company adds:
$2M New and Expansion ARR
but loses:
$1.7M ARR
Net growth:
$300,000
Sales and marketing may be working hard to fill a leaking revenue base.
A low Magic Number can therefore indicate a retention problem, an acquisition-efficiency problem, or both.
Breaking the revenue movement into new, expansion, churn, and contraction components makes the metric more diagnostic.
Magic Number and New-Customer Acquisition
Suppose recurring revenue increases $250,000 quarter over quarter.
Previous-quarter S&M is $500,000.
Magic Number:
$250,000 × 4 ÷ $500,000
= 2.0
Now suppose almost all $250,000 came from upsells to existing customers rather than new acquisition.
The 2.0 ratio still reflects strong aggregate commercial efficiency.
It does not prove the new-customer acquisition funnel is equally productive.
Dedicated CAC and new-ARR metrics are required for that narrower question.
Magic Number and Average Revenue Per Account
Higher average revenue per account can contribute to recurring-revenue growth without adding many new logos.
Suppose:
Accounts = 2,000
ARPA rises from:
$500 to $550 per Month
Monthly revenue increases:
2,000 × $50 = $100,000
Annualized recurring increase:
$1.2 Million
That expansion can improve commercial efficiency significantly.
The Magic Number captures the aggregate revenue effect but not whether it came from new customers, pricing, or expansion.
Magic Number and Pricing
Pricing changes can influence the Magic Number even if the sales organization becomes neither more nor less productive.
Suppose the company raises recurring prices 10% across much of its existing customer base.
Recurring revenue rises substantially.
The numerator of the Magic Number improves.
If customers remain and sales-and-marketing expense is unchanged, the ratio can increase.
The improvement is economically meaningful, but attributing it entirely to acquisition efficiency would be inaccurate.
Pricing and expansion effects should be separated when analyzing the causes.
Magic Number With Negative Revenue Growth
Suppose:
Current Quarter Recurring Revenue = $4.8M
Previous Quarter = $5.0M
Difference:
−$200,000
Previous-quarter S&M:
$1M
Magic Number:
−$200,000 × 4 ÷ $1,000,000
= −0.8
A negative Magic Number indicates recurring revenue declined despite the prior sales and marketing investment.
Possible causes include severe churn, contraction, weak acquisition, seasonality, revenue reclassification, or another business disruption.
The result requires diagnosis rather than a mechanical response.
Magic Number of Zero
If current recurring revenue equals the previous quarter:
Revenue Change = $0
Then:
Magic Number = 0
The recurring revenue base did not increase despite prior-quarter sales and marketing expense.
This can happen during a deliberate strategic transition, but sustained zero growth alongside meaningful acquisition spending generally deserves investigation.
Improving the Magic Number Through Higher Growth
Suppose prior-quarter sales and marketing expense remains:
$500,000
Original quarterly recurring-revenue increase:
$100,000
Magic Number:
$100,000 × 4 ÷ $500,000 = 0.8
Growth improves to:
$175,000
New Magic Number:
$175,000 × 4 ÷ $500,000 = 1.4
The ratio improves because the same commercial spending generates more incremental recurring revenue.
Improving the Magic Number Through Lower S&M Cost
Suppose annualized incremental recurring revenue remains:
$800,000
Original S&M:
$800,000
Magic Number:
1.0
Sales and marketing expense falls to:
$500,000
with growth unchanged.
New Magic Number:
$800,000 ÷ $500,000 = 1.6
The company produces the same recurring growth using less commercial expenditure.
The ratio improves through efficiency rather than faster growth.
Cutting S&M Can Hurt Future Magic Number
Reducing sales and marketing expense can improve the current denominator, but excessive cuts can reduce future pipeline and recurring-revenue growth.
Suppose spending falls sharply this quarter.
The Magic Number calculated from next quarter’s revenue growth may deteriorate because fewer opportunities were created.
Commercial spending should therefore be optimized for productive growth rather than minimized solely to improve a ratio.
Magic Number Trend Example
Suppose:
| Quarter | Magic Number |
|---|---|
| Q1 | 0.5 |
| Q2 | 0.8 |
| Q3 | 1.1 |
| Q4 | 1.4 |
The ratio is improving consistently.
That can indicate:
- better sales productivity;
- higher conversion;
- stronger pricing;
- greater expansion;
- improved retention;
- lower acquisition cost; or
- changes in expense timing.
The trend deserves decomposition before management credits one specific initiative.
Falling Magic Number Example
Suppose:
| Quarter | Magic Number |
|---|---|
| Q1 | 1.5 |
| Q2 | 1.2 |
| Q3 | 0.8 |
| Q4 | 0.4 |
Commercial efficiency is deteriorating under the chosen formula.
Potential causes include:
slower growth, higher S&M spending, longer sales cycles, weaker conversion, rising churn, fewer expansions, pricing pressure, or accounting timing.
The correct response depends on which driver is responsible.
Magic Number and Month-Over-Month Growth
Month-over-month growth provides a faster view of changes in revenue or recurring metrics.
The Magic Number usually works with a broader sales-and-marketing investment window because commercial spending and resulting revenue often have a lag.
A strong one-month growth figure should not automatically be converted into a conclusion about sales efficiency.
Short-term growth can be volatile.
The Magic Number relates growth to the commercial resources required to produce it.
Quarterly Revenue Example
Suppose:
| Quarter | Recurring Revenue | Prior-Qtr S&M |
|---|---|---|
| Q1 | $2.00M | — |
| Q2 | $2.15M | $500K |
| Q3 | $2.35M | $550K |
| Q4 | $2.65M | $600K |
Q2 Magic Number:
($2.15M − $2.00M) × 4 ÷ $500K = 1.2
Q3:
($2.35M − $2.15M) × 4 ÷ $550K
≈ 1.45
Q4:
($2.65M − $2.35M) × 4 ÷ $600K
= 2.0
The company’s recurring-revenue growth becomes increasingly productive relative to the preceding quarter’s sales and marketing expense.
Sales and Marketing Expense Definition Matters
The denominator should be applied consistently.
Depending on company accounting and internal reporting, sales and marketing expense can contain:
- sales salaries;
- commissions;
- advertising;
- demand-generation programs;
- marketing salaries;
- events;
- software;
- agencies;
- business development; and
- allocated overhead.
Excluding legitimate commercial costs can artificially inflate the Magic Number.
Changing classification between periods can create a trend that reflects accounting treatment rather than true efficiency.
Capitalized Commissions and Expense Timing
If certain acquisition-related amounts are accounted for differently across companies or periods, reported sales and marketing expense may not perfectly reflect the economic resources committed to acquisition.
That can complicate Magic Number comparisons.
For internal management analysis, consistent treatment and reconciliation to the company’s accounting policies are essential.
A highly precise ratio built from inconsistent expenses is not useful.
Comparing Companies
Cross-company Magic Number comparisons require caution because businesses can differ in:
- sales cycles;
- customer segment;
- gross margin;
- accounting classification;
- expansion rates;
- churn;
- contract duration;
- billing practices;
- geographic mix; and
- reliance on partners.
A self-service product and an enterprise SaaS company can have fundamentally different timing between marketing spending and recurring-revenue growth.
The ratio is most useful when compared with the same company’s historical results and genuinely similar businesses.
What Is a Good SaaS Magic Number?
There is no universal number that should be applied mechanically to every SaaS business.
A higher positive value generally indicates more annualized incremental recurring revenue relative to sales and marketing expense.
But a strong result should still be tested against:
- gross margin;
- logo retention;
- GRR;
- expansion;
- LTV:CAC;
- CAC payback;
- customer concentration; and
- growth durability.
A lower value may be temporarily reasonable when the company is entering a new market, building a sales organization, or operating with long sales-cycle timing.
High Magic Number Does Not Guarantee Profitability
Suppose:
Magic Number = 2.0
but the company has:
Low Gross Margin
Very High R&D Expense
Large Administrative Costs
Heavy Financing Requirements
The sales-and-marketing engine may be efficient while the company remains unprofitable overall.
The Magic Number measures one part of the business model.
It does not replace an income statement or cash-flow analysis.
High Magic Number Can Reflect Underinvestment
An unusually high sustained Magic Number can sometimes indicate that commercial spending could potentially be increased.
Suppose the company is generating very large recurring-revenue growth from a relatively small S&M budget.
If the market has additional attractive demand and customer economics remain strong, more investment could produce valuable growth.
That does not mean spending should automatically increase.
The company should verify that incremental acquisition opportunities preserve acceptable retention, margin, CAC payback, and LTV:CAC economics.
Low Magic Number Does Not Always Mean Bad Sales Execution
A weak ratio can be caused by:
- customer churn;
- lower pricing;
- deliberate investment ahead of revenue;
- long enterprise sales cycles;
- new market entry;
- customer contractions; or
- temporary hiring ahead of productivity.
Sales productivity is only one possible explanation.
Breaking the numerator into new revenue, expansion, churn, and contraction is more informative than blaming the sales team for the aggregate result.
Magic Number and Sustainable Growth
Strong commercial efficiency is most valuable when supported by durable customer economics.
A company with:
Strong Magic Number
but:
Poor Logo Retention
can continually replace customers rather than compound them.
A company with strong sales efficiency and strong retention has a more powerful growth engine because new revenue is layered onto a base that remains intact.
That interaction is why retention metrics belong beside sales-efficiency metrics.
Common Magic Number SaaS Mistakes
A common mistake is applying the quarterly formula to ARR and still multiplying by four.
Another is using current-quarter sales and marketing expense in one period and prior-quarter expense in another.
Businesses can also ignore gross margin and interpret revenue efficiency as profit efficiency.
Another mistake is assuming all recurring-revenue growth came from new acquisition when expansion or pricing changes contributed materially.
Poor retention can depress the ratio even when acquisition is healthy.
Companies may compare businesses with radically different sales cycles and accounting definitions.
Finally, a single quarter can be noisy. Trends and customer economics matter more than one isolated result.
Frequently Asked Questions
What is the Magic Number SaaS metric?
It is a sales-and-marketing efficiency metric that compares annualized incremental recurring revenue with the commercial spending associated with generating that growth.
What is the SaaS Magic Number formula?
A common quarterly version is:
Magic Number = (Current Quarter Recurring Revenue − Previous Quarter Recurring Revenue) × 4 ÷ Previous Quarter Sales & Marketing Expense
Why is the revenue increase multiplied by four?
The quarter-over-quarter increase is annualized so it can be compared on an annual recurring basis.
Why use previous-quarter sales and marketing expense?
Sales and marketing spending often occurs before the resulting recurring revenue appears. Using the previous quarter attempts to reflect that lag.
What does a Magic Number of 1 mean?
Under the common quarterly formulation, it means the company generated approximately $1 of annualized incremental recurring revenue for each $1 of prior-quarter sales and marketing expense.
What does a Magic Number of 2 mean?
It means approximately $2 of annualized incremental recurring revenue was generated for each $1 of the aligned sales and marketing expenditure under the calculation.
Can the Magic Number be negative?
Yes.
If recurring revenue declines quarter over quarter, the numerator can become negative.
Is a higher Magic Number always better?
Not automatically.
Gross margin, retention, customer lifetime, acquisition capacity, market opportunity, and expense timing all affect whether the result represents strong economics.
Is the Magic Number the same as CAC payback?
No.
Magic Number relates recurring-revenue growth to sales and marketing spending.
CAC payback measures how long customer gross contribution takes to recover acquisition cost.
Is the Magic Number the same as LTV:CAC?
No.
LTV:CAC compares expected lifetime customer value with acquisition cost.
Magic Number evaluates current commercial growth efficiency.
How does logo retention affect the Magic Number?
Weak logo retention can reduce net recurring-revenue growth because acquired customers are being lost, depressing the numerator.
How does gross revenue retention affect the Magic Number?
Poor GRR reduces the amount of starting recurring revenue that survives, making it harder for new sales and expansion to produce strong net growth.
Can expansion revenue improve the Magic Number?
Yes.
Expansion from existing customers can increase recurring-revenue growth and therefore improve the numerator.
Can pricing changes affect the Magic Number?
Yes.
Higher recurring prices can increase revenue growth even when acquisition productivity is unchanged. Pricing effects should therefore be separated when diagnosing the result.
Why does gross margin matter if it is not in the standard formula?
The Magic Number is revenue-based. Two companies with identical Magic Numbers can have very different gross-profit economics if their margins differ.
Should the Magic Number be calculated from ARR?
It can be adapted to an ARR-based analysis, but if the numerator is already an annualized ARR change, multiplying by four again can overstate the result. The revenue period and annualization method must be defined consistently.
Why is the SaaS Magic Number important?
It provides a compact measure of how effectively sales and marketing investment is translating into recurring-revenue growth. Used with retention, margin, CAC payback, LTV:CAC, and expansion metrics, it helps determine whether SaaS growth is commercially efficient and sustainable.




