Statistics & Probability
-

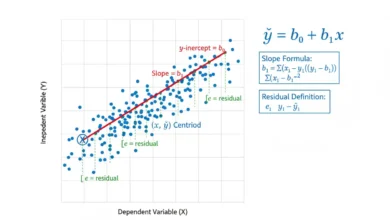
Regression Line: Definition, Formula & Example
A regression line is a straight line fitted to paired numerical data to describe how the expected or predicted value…
Read More » -
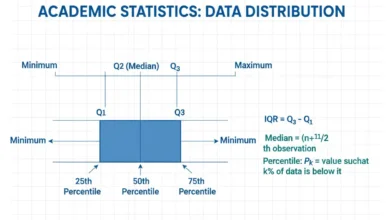
Quartiles: Definition, Formula & Example
Quartiles are measures of position that divide an ordered data set or probability distribution into four broad sections, making them…
Read More » -
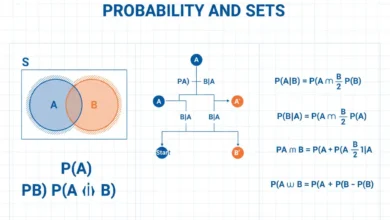
Probability: Definition, Formula & Example
Probability is the mathematical framework used to quantify uncertainty by assigning numerical values to possible events, with values ranging from…
Read More » -
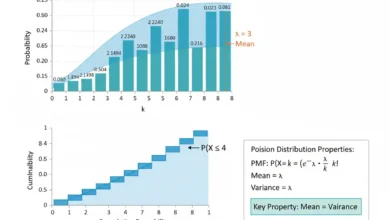
Poisson Distribution: Definition, Formula & Example
The Poisson distribution is a discrete probability distribution used to model the number of events occurring within a fixed interval…
Read More » -
Percentiles: Definition, Formula & Example
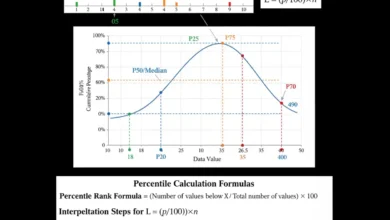
Percentiles describe the relative position of a value within an ordered data set or probability distribution by identifying the point…
Read More » -
P-Values: Definition, Formula & Example
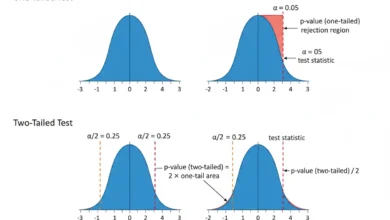
P-values are inferential statistics used to quantify how incompatible observed data are with a specified null hypothesis and statistical model.…
Read More » -
Odds Formats: Implied Probability
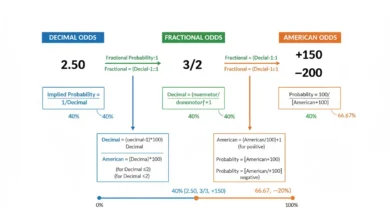
Odds formats are different numerical ways of expressing the relationship between the chance of an event occurring and the return…
Read More » -
Normal Distribution: Definition, Formula & Example
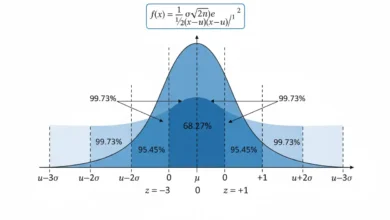
The normal distribution is a continuous probability distribution defined by a symmetric, bell-shaped density centered on its mean. It is…
Read More » -
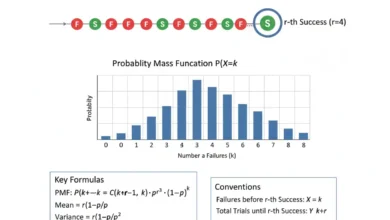
Negative Binomial: Definition, Formula & Example
The negative binomial distribution is a discrete probability distribution used to model how many failures occur before a specified number…
Read More » -
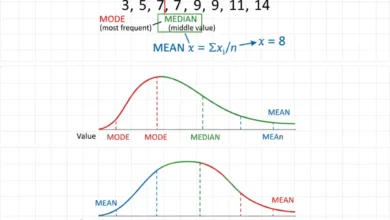
Mean, Median, Mode: Definition, Formula & Example
Mean, median, mode are three fundamental measures of central tendency used to describe where numerical or categorical data tend to…
Read More »