


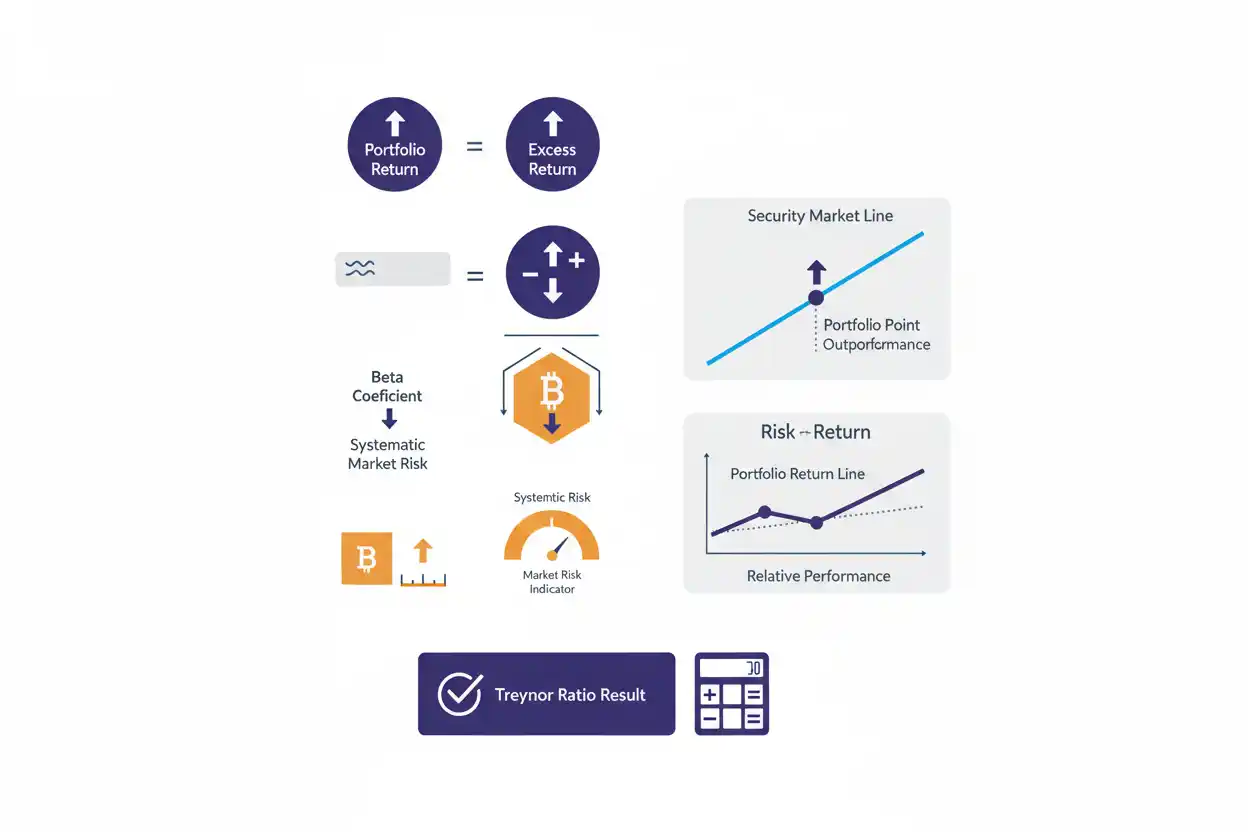
The Treynor ratio measures how much return an investment produced above a risk-free benchmark for each unit of systematic market risk, as measured by beta.
Suppose a portfolio earns 12%, the risk-free rate is 4%, and the portfolio beta is 1.2.
Its excess return is 8 percentage points.
Dividing that excess return by the 1.2 beta produces a Treynor ratio of approximately 0.0667, or 6.67% of excess return per unit of beta when the return inputs are expressed as decimals.
The Treynor ratio is most meaningful for diversified portfolios because beta focuses on market-related risk rather than total investment volatility.
What Is the Treynor Ratio?
The Treynor ratio is a risk-adjusted performance measure.
It asks:
How much excess return did the portfolio generate for the amount of systematic risk it took?
The calculation uses:
- portfolio return;
- risk-free rate;
- beta.
Unlike the Sharpe ratio, it does not divide by total standard deviation.
Instead, beta is the denominator.
Treynor Ratio Formula
Treynor Ratio = (Portfolio Return − Risk-Free Rate) ÷ Portfolio Beta
Using symbols:
Treynor Ratio = (Rₚ − Rf) ÷ βₚ
Where:
- Rₚ = portfolio return;
- Rf = risk-free rate;
- βₚ = portfolio beta.
The portfolio and risk-free returns should cover comparable periods.
Treynor Ratio Example
Suppose:
- portfolio return = 12%;
- risk-free rate = 4%;
- portfolio beta = 1.2.
First calculate excess return:
Excess Return = 12% − 4%
Excess Return = 8%
Using decimal returns:
Treynor Ratio = (0.12 − 0.04) ÷ 1.2
Treynor Ratio = 0.0667
Expressed as a percentage:
Treynor Ratio ≈ 6.67% per Unit of Beta
How to Interpret the Result
A Treynor ratio of 0.0667 means the portfolio generated approximately 6.67 percentage points of excess return for each unit of systematic market risk represented by beta.
The value becomes most useful when comparing similar portfolios.
On its own, 0.0667 does not tell you whether the investment is attractive.
It needs context.
Comparing Two Portfolios
Suppose:
Portfolio A
- return = 12%;
- risk-free rate = 4%;
- beta = 1.2.
Treynor A = 8% ÷ 1.2
≈ 6.67%
Portfolio B
- return = 10%;
- risk-free rate = 4%;
- beta = 0.75.
Treynor B = 6% ÷ 0.75
= 8%
Portfolio A earned the higher raw return.
Portfolio B produced the higher Treynor ratio.
Under this metric, Portfolio B generated more excess return for each unit of market risk.
Why Excess Return Is Used
Suppose a portfolio earns 9%, but a risk-free alternative provides 5%.
Only:
9% − 5% = 4%
represents compensation above the reference return.
Treynor ratio asks whether that additional return justified the portfolio’s systematic market exposure.
If the risk-free rate rises while portfolio return and beta remain unchanged, the Treynor ratio falls.
What Is Beta?
Beta measures how strongly an investment’s returns tend to move with the market benchmark used in the calculation.
Conceptually:
Beta = Covariance With Market ÷ Market Variance
A beta of:
- 1.0 indicates benchmark-like market sensitivity;
- above 1.0 indicates greater historical sensitivity;
- below 1.0 indicates lower sensitivity;
- negative beta indicates an inverse relationship under the measurement period.
Beta is an estimate, not a guaranteed prediction of future price movement.
Beta Example
Suppose:
Portfolio Beta = 1.3
A simplified interpretation is that the portfolio historically moved about 1.3% for each 1% benchmark movement on average, all else equal.
That does not mean every 1% market gain produces exactly a 1.3% portfolio gain.
Beta describes a statistical relationship across observations.
Treynor Ratio With Beta of 1
Suppose:
- portfolio return = 11%;
- risk-free rate = 3%;
- beta = 1.
Then:
Treynor Ratio = (11% − 3%) ÷ 1
= 8%
With beta exactly equal to one, the numerical excess return and Treynor result are the same.
Higher Beta Can Lower the Ratio
Suppose two portfolios both earn 12% and the risk-free rate is 4%.
Portfolio A:
Beta = 1
Treynor = 8%
Portfolio B:
Beta = 1.6
Treynor = 8% ÷ 1.6
= 5%
The same raw return looks less efficient under Treynor when substantially more systematic risk is used to produce it.
Higher Return Can Raise the Ratio
Now hold beta at 1.2.
Portfolio return of 10%:
(10% − 4%) ÷ 1.2 = 5%
Portfolio return of 13%:
(13% − 4%) ÷ 1.2 = 7.5%
Higher return improves the ratio when beta and the reference rate remain unchanged.
Treynor Ratio vs Total Return
Total return tells you how much an investment gained or lost after including capital changes and income.
Treynor ratio asks whether that return was attractive relative to systematic risk.
For example:
Total Return = 12%
may look strong.
But if beta is 2.0 and the risk-free rate is 4%:
Treynor = 8% ÷ 2
= 4%
Risk-adjusted interpretation adds context that raw return alone cannot provide.
Treynor Ratio vs Time-Weighted Return
Time-weighted return isolates portfolio performance from the timing of external investor cash flows.
A portfolio manager’s TWR can be used as the return input in a Treynor calculation when the periods are consistent.
TWR solves the cash-flow measurement problem.
Treynor then relates the resulting return to beta.
Treynor Ratio and Time Value of Money
Time value of money evaluates the growth or discounting of cash flows through time.
Treynor ratio does not value cash flows.
It evaluates investment performance relative to systematic risk.
A projected 8% future return and a historical Treynor ratio therefore answer different questions.
Treynor Ratio and Turnover
A portfolio’s turnover ratio measures trading activity.
High turnover does not automatically produce a high Treynor ratio.
If frequent trading creates additional costs without sufficient excess return, net performance—and therefore the Treynor ratio—can decline.
Trading activity should be evaluated by its contribution to results rather than activity itself.
Treynor Ratio and Yield to Call
Yield to call estimates the return on a callable bond if it is redeemed on a specified call date.
That is a bond cash-flow yield calculation.
Treynor ratio is a market-risk-adjusted portfolio measure.
A bond can have an attractive yield to call but still contribute differently to portfolio beta and overall risk.
Treynor Ratio vs Sharpe Ratio
The core difference is the denominator.
Treynor:
Excess Return ÷ Beta
Sharpe:
Excess Return ÷ Standard Deviation
Treynor measures return relative to systematic market risk.
Sharpe measures return relative to total volatility.
Why Diversification Matters
Treynor ratio assumes that unsystematic asset-specific risk can be diversified away.
For a poorly diversified portfolio containing only a few individual securities, beta may overlook substantial company-specific risk.
In that situation, a total-risk measure can provide additional information.
Treynor is therefore most interpretable when analyzing reasonably diversified portfolios.
Negative Treynor Ratio
Suppose:
- portfolio return = 2%;
- risk-free rate = 4%;
- beta = 1.1.
Then:
Treynor = (2% − 4%) ÷ 1.1
≈ −1.82%
The portfolio underperformed the risk-free benchmark.
Negative Treynor ratios require care when comparing investments, particularly when beta can also be negative.
Beta Near Zero
If beta approaches zero, dividing by beta can produce a very large Treynor ratio.
Suppose:
Beta = 0.02
Even a modest excess return creates a large numerical ratio.
That does not necessarily mean the investment is extraordinarily attractive.
It may indicate that the Treynor framework is not especially informative for that investment.
Negative Beta
Suppose an asset has negative beta and positive excess return.
The Treynor ratio can become negative because the denominator is negative.
This makes interpretation less straightforward.
Treynor is most intuitive for conventional portfolios with positive market beta.
Choice of Market Benchmark
Beta depends on the market benchmark used.
A portfolio can have:
- beta 0.9 relative to one index;
- beta 1.1 relative to another.
Changing the benchmark can therefore change the Treynor ratio.
Comparisons should use compatible beta estimates.
Choice of Risk-Free Rate
The risk-free rate should correspond reasonably with:
- return horizon;
- currency;
- measurement period.
Using a short-term reference rate with a long-period investment return without adjustment can reduce comparability.
Gross vs Net Treynor Ratio
Suppose:
- gross portfolio return = 11%;
- fees reduce net return to 10%;
- risk-free rate = 4%;
- beta = 1.
Gross:
Treynor = 7%
Net:
Treynor = 6%
Costs reduce the investor’s actual risk-adjusted performance.
Historical Treynor Ratio Is Not a Forecast
A portfolio’s historical beta and return can change.
Therefore:
Historical Treynor Ratio ≠ Guaranteed Future Treynor Ratio
Market relationships, management decisions, asset allocation, and economic conditions can all change.
Common Treynor Ratio Mistakes
One mistake is using total return without subtracting the risk-free rate.
Another is using standard deviation instead of beta.
People can also compare Treynor ratios calculated with different benchmarks.
A further mistake is applying Treynor mechanically to concentrated portfolios where unsystematic risk remains substantial.
Frequently Asked Questions
What is the Treynor ratio?
It measures excess portfolio return per unit of systematic market risk.
What is the formula?
Treynor Ratio = (Portfolio Return − Risk-Free Rate) ÷ Beta
What does beta measure?
Beta measures an investment’s sensitivity to movements in a selected market benchmark.
Is a higher Treynor ratio better?
All else equal, a higher positive ratio indicates more excess return per unit of systematic risk.
Is Treynor the same as Sharpe ratio?
No. Treynor uses beta; Sharpe uses total standard deviation.
Why is diversification important?
Treynor focuses on market risk and does not directly penalize diversifiable company-specific risk.
Can Treynor ratio be negative?
Yes.
What happens when beta is close to zero?
The ratio can become numerically unstable or misleadingly large.
Does turnover affect Treynor?
Trading costs associated with turnover can reduce net return and therefore reduce the ratio.
Does Treynor measure bond yield?
No. Bond yield metrics such as yield to call and yield to maturity answer different questions.
Does a high Treynor ratio guarantee future performance?
No.
Why use the Treynor ratio?
It provides a systematic-risk-adjusted perspective on portfolio performance within broader Savings & Investing analysis.




